


Joe Davies
@joewdavies.bsky.social
GIS and Cartography @EU_Eurostat
Exploring new ways of making maps.
observablehq.com/@joewdavies
Exploring new ways of making maps.
observablehq.com/@joewdavies
Grid Cartograms are now available in eurostat-map!
just use map.gridCartogram(true)
observablehq.com/@joewdavies/...
have a nice weekend :)
just use map.gridCartogram(true)
observablehq.com/@joewdavies/...
have a nice weekend :)


January 31, 2025 at 5:26 PM
Grid Cartograms are now available in eurostat-map!
just use map.gridCartogram(true)
observablehq.com/@joewdavies/...
have a nice weekend :)
just use map.gridCartogram(true)
observablehq.com/@joewdavies/...
have a nice weekend :)


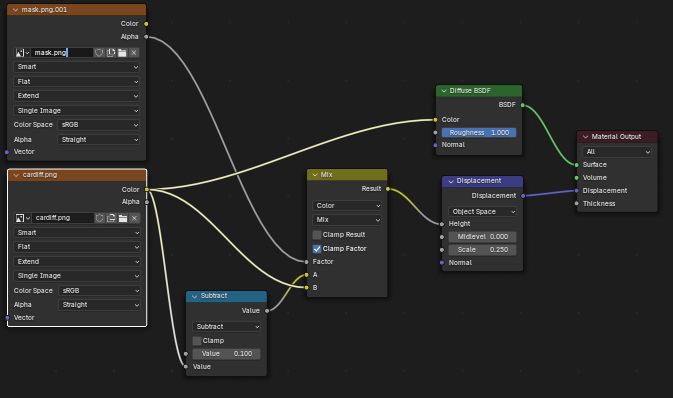
This is my Blender setup, in case its useful. Mask.png is a copy of the map but with buildings in black, and white as the transparent colour (I make them with IrfanView color replace)
January 17, 2025 at 8:54 AM
This is my Blender setup, in case its useful. Mask.png is a copy of the map but with buildings in black, and white as the transparent colour (I make them with IrfanView color replace)


January 14, 2025 at 7:00 AM
Some maps from the Global Climate Highlights 2024 by @copernicusecmwf.bsky.social
"Atmospheric carbon dioxide concentrations were higher in 2024 than at any time in at least 2,000,000 years."
climate.copernicus.eu/global-clima...
"Atmospheric carbon dioxide concentrations were higher in 2024 than at any time in at least 2,000,000 years."
climate.copernicus.eu/global-clima...


January 13, 2025 at 2:11 PM
Some maps from the Global Climate Highlights 2024 by @copernicusecmwf.bsky.social
"Atmospheric carbon dioxide concentrations were higher in 2024 than at any time in at least 2,000,000 years."
climate.copernicus.eu/global-clima...
"Atmospheric carbon dioxide concentrations were higher in 2024 than at any time in at least 2,000,000 years."
climate.copernicus.eu/global-clima...
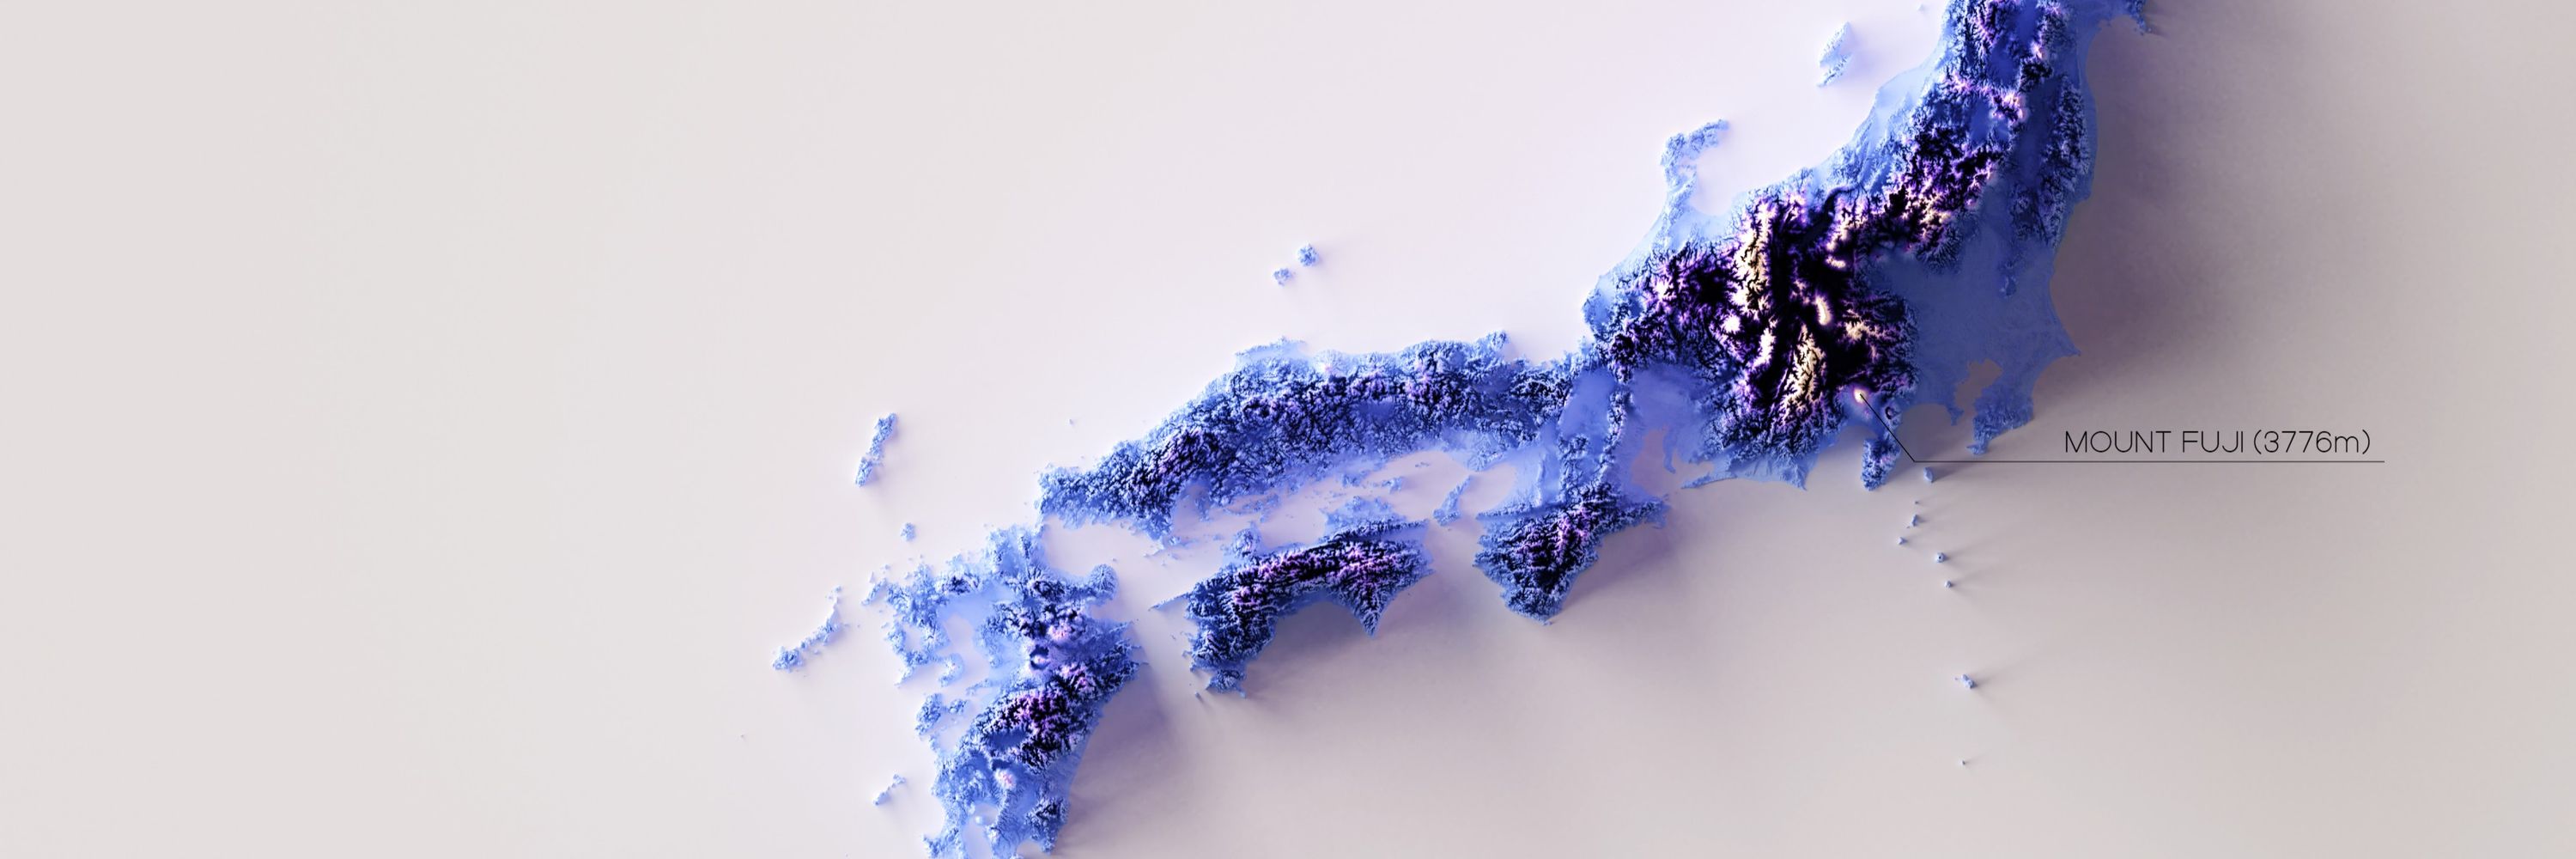
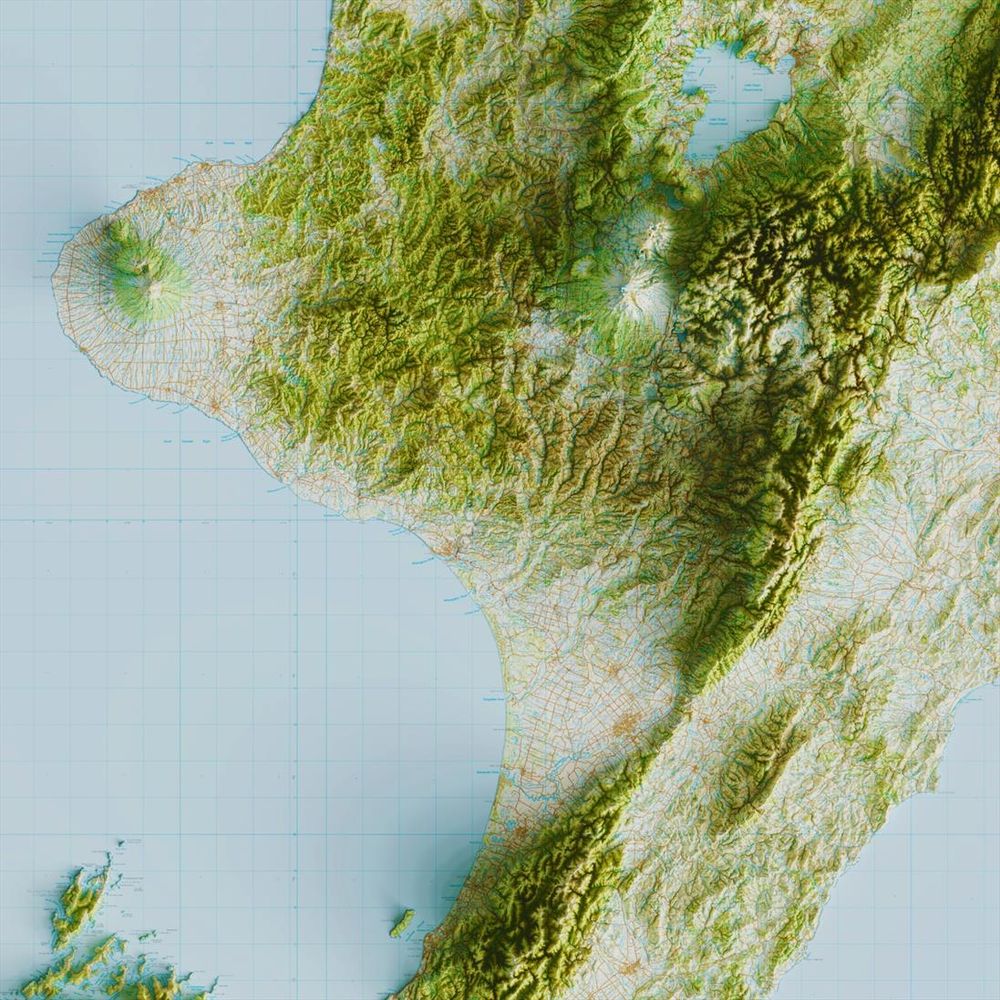
'Put it into Blender and see what happens' #4
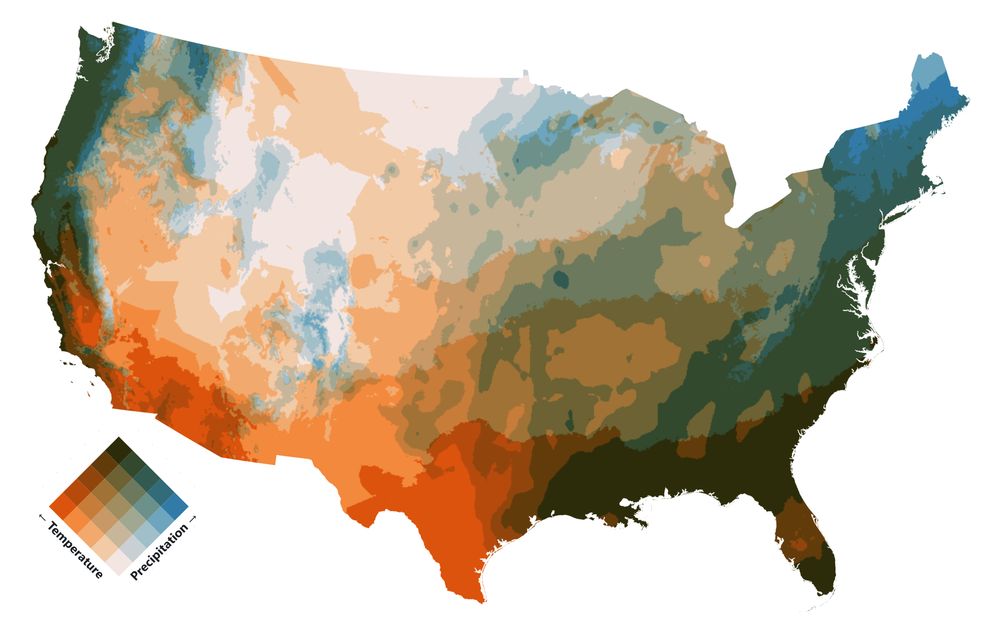
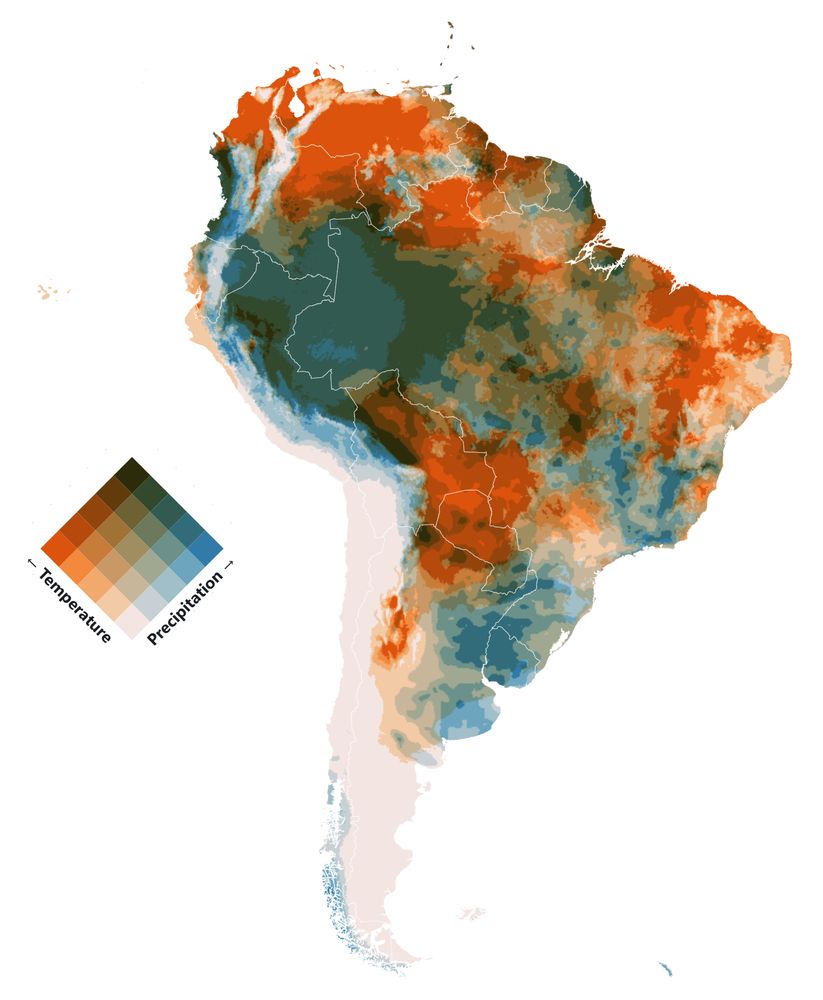
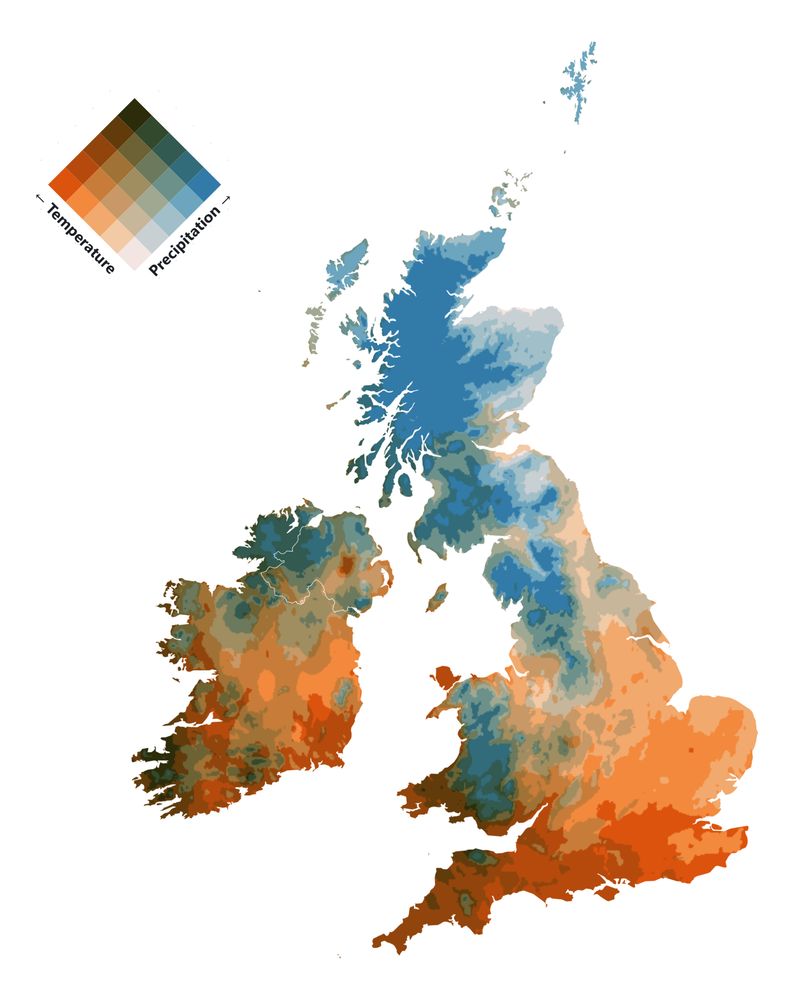
Bivariate maps showing the relationships between Temperature and Precipitation.
(Monthly data since 1958 by TerraClimate)
observablehq.com/@jo...
#maps #blender #climate #sciart #cartography #gis
Bivariate maps showing the relationships between Temperature and Precipitation.
(Monthly data since 1958 by TerraClimate)
observablehq.com/@jo...
#maps #blender #climate #sciart #cartography #gis


January 13, 2025 at 7:00 AM
'Put it into Blender and see what happens' #4
Bivariate maps showing the relationships between Temperature and Precipitation.
(Monthly data since 1958 by TerraClimate)
observablehq.com/@jo...
#maps #blender #climate #sciart #cartography #gis
Bivariate maps showing the relationships between Temperature and Precipitation.
(Monthly data since 1958 by TerraClimate)
observablehq.com/@jo...
#maps #blender #climate #sciart #cartography #gis

Genuary 08 - Draw one million of something.
1 Million Points in Three.js.
observablehq.com/@joewdavies/...
#genuary8 #genuary2025 #genuary
1 Million Points in Three.js.
observablehq.com/@joewdavies/...
#genuary8 #genuary2025 #genuary
January 10, 2025 at 11:46 AM
Genuary 08 - Draw one million of something.
1 Million Points in Three.js.
observablehq.com/@joewdavies/...
#genuary8 #genuary2025 #genuary
1 Million Points in Three.js.
observablehq.com/@joewdavies/...
#genuary8 #genuary2025 #genuary
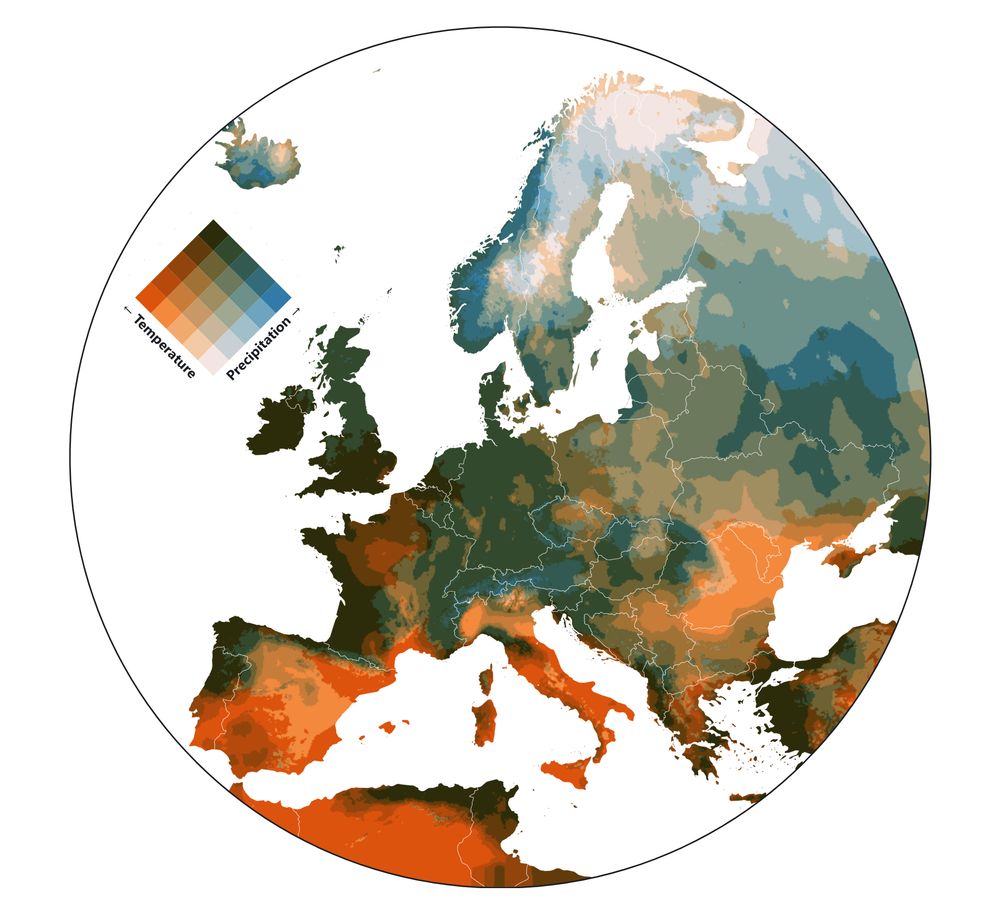
Bivariate maps showing the relationships between Temperature and Precipitation.
Made with Plot, based on a great tutorial by Fil: observablehq.com/@jo...
Data from TerraClimate (1958-present).
#cartography #maps #mapping #climate #dataviz #SciArt
Made with Plot, based on a great tutorial by Fil: observablehq.com/@jo...
Data from TerraClimate (1958-present).
#cartography #maps #mapping #climate #dataviz #SciArt
January 6, 2025 at 7:00 AM
Bivariate maps showing the relationships between Temperature and Precipitation.
Made with Plot, based on a great tutorial by Fil: observablehq.com/@jo...
Data from TerraClimate (1958-present).
#cartography #maps #mapping #climate #dataviz #SciArt
Made with Plot, based on a great tutorial by Fil: observablehq.com/@jo...
Data from TerraClimate (1958-present).
#cartography #maps #mapping #climate #dataviz #SciArt

Bluesky doesnt seem to like SVGs, so heres a png:

January 4, 2025 at 12:09 PM
Bluesky doesnt seem to like SVGs, so heres a png:
Hexbin map showing the percentage of primary schools in Wales that are Welsh-speaking 🏴
With the exception of Pembrokshire, there appears to be a higher percentage of Welsh speaking schools as you move away from the border with England.
Made using d3 observablehq.com/@joewdavies/...
With the exception of Pembrokshire, there appears to be a higher percentage of Welsh speaking schools as you move away from the border with England.
Made using d3 observablehq.com/@joewdavies/...

January 4, 2025 at 12:07 PM
Hexbin map showing the percentage of primary schools in Wales that are Welsh-speaking 🏴
With the exception of Pembrokshire, there appears to be a higher percentage of Welsh speaking schools as you move away from the border with England.
Made using d3 observablehq.com/@joewdavies/...
With the exception of Pembrokshire, there appears to be a higher percentage of Welsh speaking schools as you move away from the border with England.
Made using d3 observablehq.com/@joewdavies/...

Just a reminder that this delightful website exists: github.com/anvaka/city-...
Visualize all roads within any city, in your browser.
Visualize all roads within any city, in your browser.


January 3, 2025 at 4:51 PM
Just a reminder that this delightful website exists: github.com/anvaka/city-...
Visualize all roads within any city, in your browser.
Visualize all roads within any city, in your browser.
Here's an animated version of the same data, progressivley adding and removing the shaded relief in blender.
January 2, 2025 at 10:02 PM
Here's an animated version of the same data, progressivley adding and removing the shaded relief in blender.
Elevation map of Europe!
Some points of interest:
Highest point: Mount Elbrus, Russia (5,642 metres; 18,506 feet
Lowest point (natural, under water): Calypso Deep, Ionian Sea, Greece (5,267 metres; 17,280 feet below sea level)
Long live Wikipedia (more below).
#map #gis #cartography #blender
Some points of interest:
Highest point: Mount Elbrus, Russia (5,642 metres; 18,506 feet
Lowest point (natural, under water): Calypso Deep, Ionian Sea, Greece (5,267 metres; 17,280 feet below sea level)
Long live Wikipedia (more below).
#map #gis #cartography #blender


January 2, 2025 at 10:02 PM
Elevation map of Europe!
Some points of interest:
Highest point: Mount Elbrus, Russia (5,642 metres; 18,506 feet
Lowest point (natural, under water): Calypso Deep, Ionian Sea, Greece (5,267 metres; 17,280 feet below sea level)
Long live Wikipedia (more below).
#map #gis #cartography #blender
Some points of interest:
Highest point: Mount Elbrus, Russia (5,642 metres; 18,506 feet
Lowest point (natural, under water): Calypso Deep, Ionian Sea, Greece (5,267 metres; 17,280 feet below sea level)
Long live Wikipedia (more below).
#map #gis #cartography #blender
A map of South Devon shipwrecks that my friend rescued from a tip shop!


December 30, 2024 at 6:21 PM
A map of South Devon shipwrecks that my friend rescued from a tip shop!
Bannau Brycheiniog visitor centre, Wales #mapsinthewild


December 30, 2024 at 6:18 PM
Bannau Brycheiniog visitor centre, Wales #mapsinthewild
I was just in Exmouth and spotted another one!

December 28, 2024 at 4:09 PM
I was just in Exmouth and spotted another one!
Looking forward to digging into these too

December 25, 2024 at 6:49 PM
Looking forward to digging into these too
I must've been good this year? @kennethfield.bsky.social

December 25, 2024 at 6:35 PM
I must've been good this year? @kennethfield.bsky.social
The crochet mice on top of this post box told me to wish you a very merry Christmas

December 24, 2024 at 6:07 PM
The crochet mice on top of this post box told me to wish you a very merry Christmas
Explore the world’s submarine cables in this interactive notebook! Dive into the global network that connects us across continents. 🌍
👉 observablehq.com/@joewdavies/...
#dataviz #gis #globe #webgl #tech #SubmarineCables
👉 observablehq.com/@joewdavies/...
#dataviz #gis #globe #webgl #tech #SubmarineCables
December 24, 2024 at 10:42 AM
Explore the world’s submarine cables in this interactive notebook! Dive into the global network that connects us across continents. 🌍
👉 observablehq.com/@joewdavies/...
#dataviz #gis #globe #webgl #tech #SubmarineCables
👉 observablehq.com/@joewdavies/...
#dataviz #gis #globe #webgl #tech #SubmarineCables
Experimenting using movement as a visual variable: population density as movement.
observablehq.com/@joewdavies/...
#gischat #dataviz
observablehq.com/@joewdavies/...
#gischat #dataviz
December 23, 2024 at 6:15 PM
Experimenting using movement as a visual variable: population density as movement.
observablehq.com/@joewdavies/...
#gischat #dataviz
observablehq.com/@joewdavies/...
#gischat #dataviz