


erdirstats
@erdirstats.bsky.social
Trying to learn a bit of #rstats
Reposted by erdirstats

I ignored the strip.clip argument in #ggplot2 for way too long 😲
Combined with a small negative margin tweak, you can place facet labels inside each panel. A tiny trick that makes small multiples feel so much cleaner.
🔵 no manual coordinates
🔵 inherits theme styling
🔵 scales nicely when resizing
Combined with a small negative margin tweak, you can place facet labels inside each panel. A tiny trick that makes small multiples feel so much cleaner.
🔵 no manual coordinates
🔵 inherits theme styling
🔵 scales nicely when resizing

December 12, 2025 at 12:51 PM
I ignored the strip.clip argument in #ggplot2 for way too long 😲
Combined with a small negative margin tweak, you can place facet labels inside each panel. A tiny trick that makes small multiples feel so much cleaner.
🔵 no manual coordinates
🔵 inherits theme styling
🔵 scales nicely when resizing
Combined with a small negative margin tweak, you can place facet labels inside each panel. A tiny trick that makes small multiples feel so much cleaner.
🔵 no manual coordinates
🔵 inherits theme styling
🔵 scales nicely when resizing
Reposted by erdirstats


December 11, 2025 at 2:33 PM
Reposted by erdirstats

Big new blogpost!
My guide to data visualization, which includes a very long table of contents, tons of charts, and more.
--> Why data visualization matters and how to make charts more effective, clear, transparent, and sometimes, beautiful.
www.scientificdiscovery.dev/p/salonis-gu...
My guide to data visualization, which includes a very long table of contents, tons of charts, and more.
--> Why data visualization matters and how to make charts more effective, clear, transparent, and sometimes, beautiful.
www.scientificdiscovery.dev/p/salonis-gu...

December 9, 2025 at 8:28 PM
Big new blogpost!
My guide to data visualization, which includes a very long table of contents, tons of charts, and more.
--> Why data visualization matters and how to make charts more effective, clear, transparent, and sometimes, beautiful.
www.scientificdiscovery.dev/p/salonis-gu...
My guide to data visualization, which includes a very long table of contents, tons of charts, and more.
--> Why data visualization matters and how to make charts more effective, clear, transparent, and sometimes, beautiful.
www.scientificdiscovery.dev/p/salonis-gu...
Reposted by erdirstats


Reposted by erdirstats

We're looking at cars in Qatar for #TidyTuesday this week - "an international and modern version of the now-ancient `mtcars`" data! 📊
➡️ 9 ways to visualise the distribution of a variable
Thanks to @andrew.heiss.phd for curating this week's dataset!
#RStats #DataViz
➡️ 9 ways to visualise the distribution of a variable
Thanks to @andrew.heiss.phd for curating this week's dataset!
#RStats #DataViz

December 9, 2025 at 10:51 AM
We're looking at cars in Qatar for #TidyTuesday this week - "an international and modern version of the now-ancient `mtcars`" data! 📊
➡️ 9 ways to visualise the distribution of a variable
Thanks to @andrew.heiss.phd for curating this week's dataset!
#RStats #DataViz
➡️ 9 ways to visualise the distribution of a variable
Thanks to @andrew.heiss.phd for curating this week's dataset!
#RStats #DataViz
Reposted by erdirstats

This might be for an extremely limited target group, but if you ever need to visualize landmarks/keypoints of Mediapipe or OpenFace computer vision models, I've created simple coordinate data files for plotting in a Github repo: github.com/borstell/com...


December 8, 2025 at 7:47 PM
This might be for an extremely limited target group, but if you ever need to visualize landmarks/keypoints of Mediapipe or OpenFace computer vision models, I've created simple coordinate data files for plotting in a Github repo: github.com/borstell/com...
Reposted by erdirstats

HEY! YOU! ggdibbler 0.6.1 is finally up on CRAN!
harriet-mason.github.io/ggdibbler/in...
You can now pass random variables to any aesthetic in any ggplot geom/stat. If you can express it as a distribution, ggdibbler can plot it. It also works with ggplot extensions, like gganimate. #rstats
harriet-mason.github.io/ggdibbler/in...
You can now pass random variables to any aesthetic in any ggplot geom/stat. If you can express it as a distribution, ggdibbler can plot it. It also works with ggplot extensions, like gganimate. #rstats

December 6, 2025 at 3:16 PM
HEY! YOU! ggdibbler 0.6.1 is finally up on CRAN!
harriet-mason.github.io/ggdibbler/in...
You can now pass random variables to any aesthetic in any ggplot geom/stat. If you can express it as a distribution, ggdibbler can plot it. It also works with ggplot extensions, like gganimate. #rstats
harriet-mason.github.io/ggdibbler/in...
You can now pass random variables to any aesthetic in any ggplot geom/stat. If you can express it as a distribution, ggdibbler can plot it. It also works with ggplot extensions, like gganimate. #rstats
Reposted by erdirstats

This is the most exciting time ever to be working in data, and I'm not talking about AI.
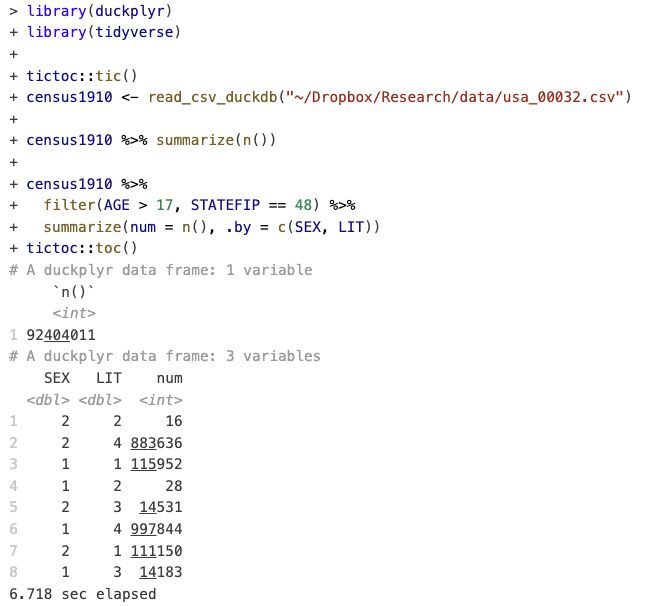
3 years ago, I wrote a database-centric guide in my book for analyzing the full 92 million record 1910 Census.
Now, with #rstats and @duckdb?
Analyze those 92 million rows in seconds.
3 years ago, I wrote a database-centric guide in my book for analyzing the full 92 million record 1910 Census.
Now, with #rstats and @duckdb?
Analyze those 92 million rows in seconds.
December 6, 2025 at 4:46 PM
This is the most exciting time ever to be working in data, and I'm not talking about AI.
3 years ago, I wrote a database-centric guide in my book for analyzing the full 92 million record 1910 Census.
Now, with #rstats and @duckdb?
Analyze those 92 million rows in seconds.
3 years ago, I wrote a database-centric guide in my book for analyzing the full 92 million record 1910 Census.
Now, with #rstats and @duckdb?
Analyze those 92 million rows in seconds.
Reposted by erdirstats

Reposted by erdirstats

marimo notebooks have a great editing experience, but you can also run them as web apps, command line applications or as a testing suite!
It's unconventional, but understanding this is a huge unlock!
So we made a new video to explain it:
youtu.be/q9QPWEnPmlE
It's unconventional, but understanding this is a huge unlock!
So we made a new video to explain it:
youtu.be/q9QPWEnPmlE

How marimo notebooks can be used in four different ways
marimo is most well known for it's edit mode, which has cells and gives the familiar notebook experience. But there are many other ways to use these notebook...
www.youtube.com
December 1, 2025 at 3:14 PM
marimo notebooks have a great editing experience, but you can also run them as web apps, command line applications or as a testing suite!
It's unconventional, but understanding this is a huge unlock!
So we made a new video to explain it:
youtu.be/q9QPWEnPmlE
It's unconventional, but understanding this is a huge unlock!
So we made a new video to explain it:
youtu.be/q9QPWEnPmlE
Reposted by erdirstats

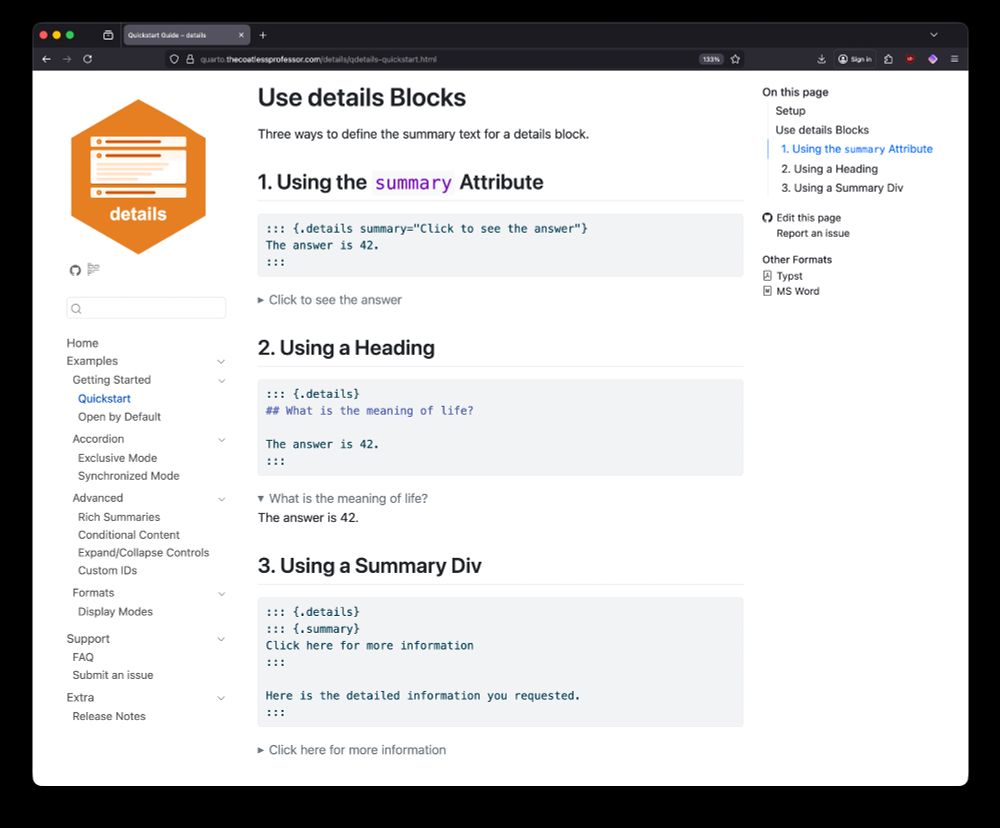
Released a #Quarto extension for collapsible content blocks.
Why? The {details} are inside.
📚 quarto.thecoatlessprofessor.com/details/
💻 github.com/coatless-qua...
Why? The {details} are inside.
📚 quarto.thecoatlessprofessor.com/details/
💻 github.com/coatless-qua...
November 29, 2025 at 7:21 PM
Released a #Quarto extension for collapsible content blocks.
Why? The {details} are inside.
📚 quarto.thecoatlessprofessor.com/details/
💻 github.com/coatless-qua...
Why? The {details} are inside.
📚 quarto.thecoatlessprofessor.com/details/
💻 github.com/coatless-qua...
Reposted by erdirstats

I am tremendously grateful for open source, as it’s had such a huge impact on my career. That’s one of the reasons I’m so happy that Posit has committed to the @opensourcepledge.com. Read about our contributions to non Posit projects at posit.co/blog/posit-o....

Posit’s progress and renewed commitment to the Open Source Pledge - Posit
Posit continues its Open Source Pledge, investing heavily to support the open-source data science ecosystem.
posit.co
November 28, 2025 at 2:03 PM
I am tremendously grateful for open source, as it’s had such a huge impact on my career. That’s one of the reasons I’m so happy that Posit has committed to the @opensourcepledge.com. Read about our contributions to non Posit projects at posit.co/blog/posit-o....
Reposted by erdirstats

#rstats Dev Diary {lofifonts}
Look closely - The segments are polygons, so I can permute all the vertices with some random noise to create a DIY/paint-swatch effect
Look closely - The segments are polygons, so I can permute all the vertices with some random noise to create a DIY/paint-swatch effect


November 26, 2025 at 10:40 AM
#rstats Dev Diary {lofifonts}
Look closely - The segments are polygons, so I can permute all the vertices with some random noise to create a DIY/paint-swatch effect
Look closely - The segments are polygons, so I can permute all the vertices with some random noise to create a DIY/paint-swatch effect
Reposted by erdirstats
#rstats Dev Diary - {lofifonts} [1] WIP
I was inspired by a HN post [2], so I'm working on adding some segmented fonts.
This will require a new backend (in addition to the existing bitmap and vector font backends).
#RStats
1] [ […]
[Original post on fosstodon.org]
I was inspired by a HN post [2], so I'm working on adding some segmented fonts.
This will require a new backend (in addition to the existing bitmap and vector font backends).
#RStats
1] [ […]
[Original post on fosstodon.org]


November 25, 2025 at 10:15 AM
#rstats Dev Diary - {lofifonts} [1] WIP
I was inspired by a HN post [2], so I'm working on adding some segmented fonts.
This will require a new backend (in addition to the existing bitmap and vector font backends).
#RStats
1] [ […]
[Original post on fosstodon.org]
I was inspired by a HN post [2], so I'm working on adding some segmented fonts.
This will require a new backend (in addition to the existing bitmap and vector font backends).
#RStats
1] [ […]
[Original post on fosstodon.org]
Reposted by erdirstats

New Quarto extension: "Reveal.js Tabset"! ✨
Brings proper tabset navigation to Reveal.js presentations with keyboard controls and PDF export support.
Navigate tabs as fragments, support nested content, and export correctly to PDF.
github.com/mcanouil/qua...
#Quarto #RevealJS #Teaching #DataScience
Brings proper tabset navigation to Reveal.js presentations with keyboard controls and PDF export support.
Navigate tabs as fragments, support nested content, and export correctly to PDF.
github.com/mcanouil/qua...
#Quarto #RevealJS #Teaching #DataScience
November 25, 2025 at 10:10 AM
New Quarto extension: "Reveal.js Tabset"! ✨
Brings proper tabset navigation to Reveal.js presentations with keyboard controls and PDF export support.
Navigate tabs as fragments, support nested content, and export correctly to PDF.
github.com/mcanouil/qua...
#Quarto #RevealJS #Teaching #DataScience
Brings proper tabset navigation to Reveal.js presentations with keyboard controls and PDF export support.
Navigate tabs as fragments, support nested content, and export correctly to PDF.
github.com/mcanouil/qua...
#Quarto #RevealJS #Teaching #DataScience
Reposted by erdirstats
New release of quarto-external (1.3.0) is out!
You can now include specific divs by their ID from external documents (online or outside your project).
This makes content reuse more precise and flexible.
Check it out: github.com/mcanouil/qua...
#Quarto #DataScience #Writing
You can now include specific divs by their ID from external documents (online or outside your project).
This makes content reuse more precise and flexible.
Check it out: github.com/mcanouil/qua...
#Quarto #DataScience #Writing

GitHub - mcanouil/quarto-external: Quarto extension to include content or partial content from external file.
Quarto extension to include content or partial content from external file. - mcanouil/quarto-external
github.com
November 23, 2025 at 3:40 PM
New release of quarto-external (1.3.0) is out!
You can now include specific divs by their ID from external documents (online or outside your project).
This makes content reuse more precise and flexible.
Check it out: github.com/mcanouil/qua...
#Quarto #DataScience #Writing
You can now include specific divs by their ID from external documents (online or outside your project).
This makes content reuse more precise and flexible.
Check it out: github.com/mcanouil/qua...
#Quarto #DataScience #Writing
Reposted by erdirstats
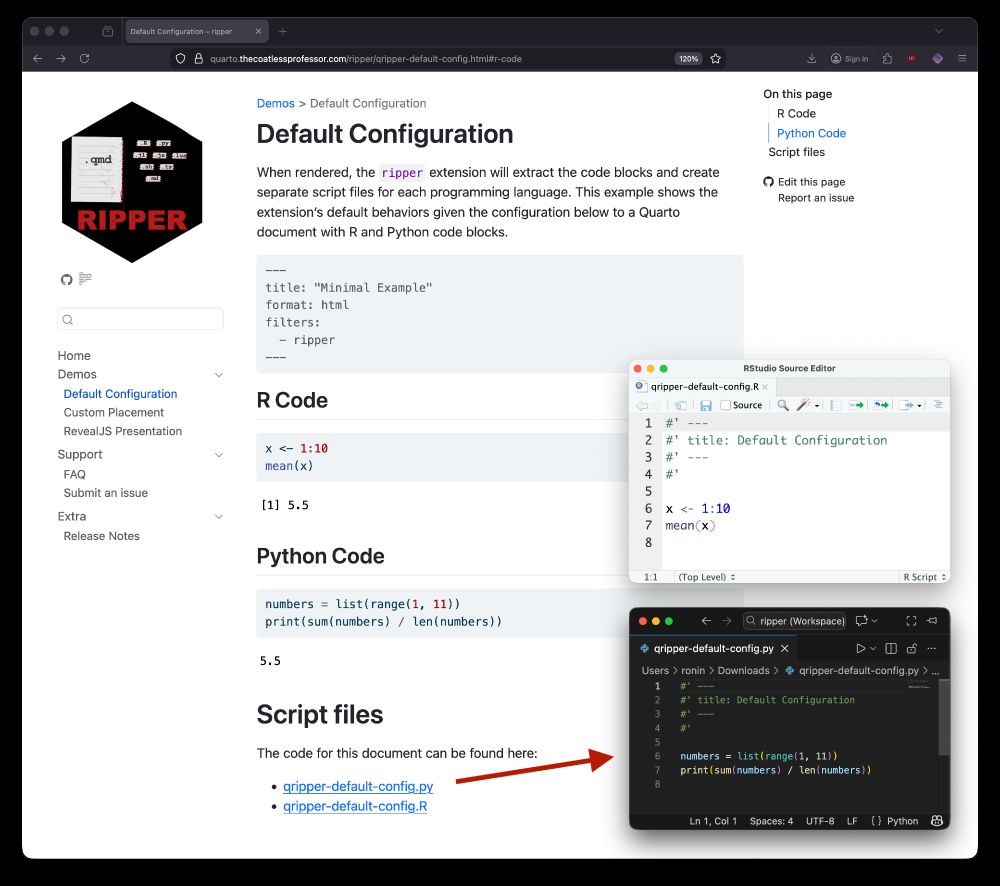
{ripper} dissects your #Quarto documents, extracting code blocks by language and leaving executable scripts behind.
Supports #rstats, #python, #julia, and 13 other victims.
For those who never stopped celebrating Halloween.
📚 quarto.thecoatlessprofessor.com/ripper/
💻 github.com/coatless-qua...
Supports #rstats, #python, #julia, and 13 other victims.
For those who never stopped celebrating Halloween.
📚 quarto.thecoatlessprofessor.com/ripper/
💻 github.com/coatless-qua...

November 22, 2025 at 10:57 PM
{ripper} dissects your #Quarto documents, extracting code blocks by language and leaving executable scripts behind.
Supports #rstats, #python, #julia, and 13 other victims.
For those who never stopped celebrating Halloween.
📚 quarto.thecoatlessprofessor.com/ripper/
💻 github.com/coatless-qua...
Supports #rstats, #python, #julia, and 13 other victims.
For those who never stopped celebrating Halloween.
📚 quarto.thecoatlessprofessor.com/ripper/
💻 github.com/coatless-qua...
Reposted by erdirstats

{ggarrow} is such a nice quality of life package for plotting vowel trajectories

Arrows for ggplot2
A ggplot2 extension that adds specialised arrow geometry layers. It offers more arrow options than the standard grid arrows that are built-in many line-based geom layers.
teunbrand.github.io
November 20, 2025 at 3:44 PM
{ggarrow} is such a nice quality of life package for plotting vowel trajectories
Reposted by erdirstats

#rstats Please welcome Jarl, a new R linter.
Jarl is a CLI tool with extensions in VS Code, Positron, and Zed. It can check thousands of lines of R code in milliseconds.
Jarl provides several output formats, a Github Actions workflow, and more.
Blog post: www.etiennebacher.com/posts/2025-1...
Jarl is a CLI tool with extensions in VS Code, Positron, and Zed. It can check thousands of lines of R code in milliseconds.
Jarl provides several output formats, a Github Actions workflow, and more.
Blog post: www.etiennebacher.com/posts/2025-1...
November 20, 2025 at 4:50 PM
#rstats Please welcome Jarl, a new R linter.
Jarl is a CLI tool with extensions in VS Code, Positron, and Zed. It can check thousands of lines of R code in milliseconds.
Jarl provides several output formats, a Github Actions workflow, and more.
Blog post: www.etiennebacher.com/posts/2025-1...
Jarl is a CLI tool with extensions in VS Code, Positron, and Zed. It can check thousands of lines of R code in milliseconds.
Jarl provides several output formats, a Github Actions workflow, and more.
Blog post: www.etiennebacher.com/posts/2025-1...
Reposted by erdirstats
After years of working with Quarto, I've refined a set of editor settings that significantly improve document editing efficiency.
My latest blog post shares these battle-tested configurations.
mickael.canouil.fr/posts/2025-1...
#Quarto #VSCode #Positron #Productivity #DataScience
My latest blog post shares these battle-tested configurations.
mickael.canouil.fr/posts/2025-1...
#Quarto #VSCode #Positron #Productivity #DataScience

Optimising VS Code and Positron for Quarto: Essential Settings for Better Editing – MCU
Discover the custom settings I use in VS Code and Positron to enhance my Quarto document editing workflow, from improved Git diffs to better visual guides for nested divs.
mickael.canouil.fr
November 20, 2025 at 9:43 AM
After years of working with Quarto, I've refined a set of editor settings that significantly improve document editing efficiency.
My latest blog post shares these battle-tested configurations.
mickael.canouil.fr/posts/2025-1...
#Quarto #VSCode #Positron #Productivity #DataScience
My latest blog post shares these battle-tested configurations.
mickael.canouil.fr/posts/2025-1...
#Quarto #VSCode #Positron #Productivity #DataScience
Reposted by erdirstats

Curious about the journeys of space probes, butterflies, and billionaires? This week's Data Vis Dispatch has all of that and much more! 🛰️ 🦋 📊
www.datawrapper.de/blog/data-vi...
www.datawrapper.de/blog/data-vi...


November 18, 2025 at 5:41 PM
Curious about the journeys of space probes, butterflies, and billionaires? This week's Data Vis Dispatch has all of that and much more! 🛰️ 🦋 📊
www.datawrapper.de/blog/data-vi...
www.datawrapper.de/blog/data-vi...
Reposted by erdirstats

This was just a toy example, but in a real data extraction pipeline, I'd be better off using pre-defined categories. Here, if I use `type_enum()` in my structured output, the LLM must choose from a specific list. (2/3)


November 18, 2025 at 10:08 AM
This was just a toy example, but in a real data extraction pipeline, I'd be better off using pre-defined categories. Here, if I use `type_enum()` in my structured output, the LLM must choose from a specific list. (2/3)
Reposted by erdirstats
If you want to do this for any formats and without requiring R: github.com/mcanouil/qua...
GitHub - mcanouil/quarto-highlight-text: Quarto extension that allows to highlight text in a document for various formats: HTML, LaTeX, Typst, Docx, PowerPoint, Reveal.js, and Beamer.
Quarto extension that allows to highlight text in a document for various formats: HTML, LaTeX, Typst, Docx, PowerPoint, Reveal.js, and Beamer. - mcanouil/quarto-highlight-text
github.com
November 17, 2025 at 7:06 AM
If you want to do this for any formats and without requiring R: github.com/mcanouil/qua...
Reposted by erdirstats
FYI for Positron users missing RStudio's Packages pane:
Dianyi Yang created an extension on OpenVSX that replicates the feature!
open-vsx.org/extension/kv...
Dianyi Yang created an extension on OpenVSX that replicates the feature!
open-vsx.org/extension/kv...
Open VSX Registry
open-vsx.org
November 14, 2025 at 7:04 PM
FYI for Positron users missing RStudio's Packages pane:
Dianyi Yang created an extension on OpenVSX that replicates the feature!
open-vsx.org/extension/kv...
Dianyi Yang created an extension on OpenVSX that replicates the feature!
open-vsx.org/extension/kv...
Reposted by erdirstats
testthat 3.3.0 out now! This is a massive release with tons of improvements including better failure messages, new expectations, improved snapshotting, new vignettes, and much much more: tidyverse.org/blog/2025/11... Post includes some thoughts on developing an #rstats package with Claude Code.

testthat 3.3.0
testthat 3.3.0 brings improved expectations with better error messages, new expectations for common testing patterns, and lifecycle changes including the removal of `local_mock()` and `with_mock()`. I...
tidyverse.org
November 13, 2025 at 5:24 PM
testthat 3.3.0 out now! This is a massive release with tons of improvements including better failure messages, new expectations, improved snapshotting, new vignettes, and much much more: tidyverse.org/blog/2025/11... Post includes some thoughts on developing an #rstats package with Claude Code.