


Althea Archer
@aaarcher.bsky.social
multipassionate, broadly-trained ecologist who can do stats, make maps, and paint pretty, too; opinions are my own | Data Visualization Specialist /Science Communicator
Reposted by Althea Archer

//\ Relief #037
Location: Malinau, Kalimantan Utara, Indonesia
Coordinates: 2.7148, 116.1959
Elevation Range: 365m to 1282m
Terrain type: mountainous
#ReliefOfTheDay #DataViz #Geography
Location: Malinau, Kalimantan Utara, Indonesia
Coordinates: 2.7148, 116.1959
Elevation Range: 365m to 1282m
Terrain type: mountainous
#ReliefOfTheDay #DataViz #Geography

June 27, 2025 at 10:17 AM
//\ Relief #037
Location: Malinau, Kalimantan Utara, Indonesia
Coordinates: 2.7148, 116.1959
Elevation Range: 365m to 1282m
Terrain type: mountainous
#ReliefOfTheDay #DataViz #Geography
Location: Malinau, Kalimantan Utara, Indonesia
Coordinates: 2.7148, 116.1959
Elevation Range: 365m to 1282m
Terrain type: mountainous
#ReliefOfTheDay #DataViz #Geography
Reposted by Althea Archer

"The agency has been operating streamgages in the United States since the 1880s. One of the first 120 gages the agency installed was in Wisconsin in 1899 ... That longevity gives scientists an essential resource for tracking Wisconsin’s bodies of water."
via @wisconsinexaminer.com
via @wisconsinexaminer.com

DOGE cancels lease of USGS Rice Lake water monitoring office • Wisconsin Examiner
The planned closure of a USGS water field office in Rice Lake is worrying experts on the future of water quality data in Wisconsin.
wisconsinexaminer.com
May 30, 2025 at 2:11 PM
"The agency has been operating streamgages in the United States since the 1880s. One of the first 120 gages the agency installed was in Wisconsin in 1899 ... That longevity gives scientists an essential resource for tracking Wisconsin’s bodies of water."
via @wisconsinexaminer.com
via @wisconsinexaminer.com
📢 Hey #dataSci, #dataViz, and #reproducibility folks, I just published a new blog on using #Quarto "child" templates to make duplicating code chunks easier.
Reprex example with Quarto-Powerpoint workflow using #openScience #dataRetrieval streamflow data.
waterdata.usgs.gov/blog/quarto-...
Reprex example with Quarto-Powerpoint workflow using #openScience #dataRetrieval streamflow data.
waterdata.usgs.gov/blog/quarto-...
Duplicating Quarto elements with code templates to reduce copy and paste errors
Quarto provides easier-than-ever ways to create data-driven, reproducible documents. This blog demonstrates how to use custom code templates to easily replicate code chunks with a reproducible USGS st...
waterdata.usgs.gov
May 20, 2025 at 4:41 PM
📢 Hey #dataSci, #dataViz, and #reproducibility folks, I just published a new blog on using #Quarto "child" templates to make duplicating code chunks easier.
Reprex example with Quarto-Powerpoint workflow using #openScience #dataRetrieval streamflow data.
waterdata.usgs.gov/blog/quarto-...
Reprex example with Quarto-Powerpoint workflow using #openScience #dataRetrieval streamflow data.
waterdata.usgs.gov/blog/quarto-...
Reposted by Althea Archer

Jazz up your ggplots!
‘Useful tricks to elevate your data viz via `ggplot` extension packages in R”
Custom themes, fonts, annotations, arrows & more
By the USGS
waterdata.usgs.gov/blog/ggplot-...
#RStats #ggplot2 #ggplot #Dataviz
‘Useful tricks to elevate your data viz via `ggplot` extension packages in R”
Custom themes, fonts, annotations, arrows & more
By the USGS
waterdata.usgs.gov/blog/ggplot-...
#RStats #ggplot2 #ggplot #Dataviz
Jazz up your ggplots!
Useful tricks to elevate your data viz via `ggplot` extension packages in R
waterdata.usgs.gov
April 9, 2025 at 10:53 AM
Jazz up your ggplots!
‘Useful tricks to elevate your data viz via `ggplot` extension packages in R”
Custom themes, fonts, annotations, arrows & more
By the USGS
waterdata.usgs.gov/blog/ggplot-...
#RStats #ggplot2 #ggplot #Dataviz
‘Useful tricks to elevate your data viz via `ggplot` extension packages in R”
Custom themes, fonts, annotations, arrows & more
By the USGS
waterdata.usgs.gov/blog/ggplot-...
#RStats #ggplot2 #ggplot #Dataviz
Reposted by Althea Archer

Data that are "available upon request".

May 13, 2025 at 2:53 AM
Data that are "available upon request".
Reposted by Althea Archer

I've reached out to multiple authors this week to try and get data from their papers.
So far, all I've got is a collection of bounced emails.
So far, all I've got is a collection of bounced emails.
May 13, 2025 at 3:23 AM
I've reached out to multiple authors this week to try and get data from their papers.
So far, all I've got is a collection of bounced emails.
So far, all I've got is a collection of bounced emails.
Reposted by Althea Archer

Thrilled to have played a part in this excellent story about the stock market during Trump's first 100 days
www.cnn.com/interactive/...
www.cnn.com/interactive/...

April 30, 2025 at 7:29 AM
Thrilled to have played a part in this excellent story about the stock market during Trump's first 100 days
www.cnn.com/interactive/...
www.cnn.com/interactive/...
Reposted by Althea Archer

I wrote about the data-to-ink ratio and a new game I've invented called "ink golf" for data visualization.
I hope you enjoy:
www.frank.computer/blog/2025/04...
I hope you enjoy:
www.frank.computer/blog/2025/04...

Minimalism and the absurdity of the data-to-ink-ratio
How much minimalism is too much minimalism? I explore this question and propose the most minimalist, highest scoring data-to-ink ratio on a visualization ever made as a thought piece. Why? Well novice...
www.frank.computer
April 23, 2025 at 2:28 AM
I wrote about the data-to-ink ratio and a new game I've invented called "ink golf" for data visualization.
I hope you enjoy:
www.frank.computer/blog/2025/04...
I hope you enjoy:
www.frank.computer/blog/2025/04...
Reposted by Althea Archer


Reposted by Althea Archer

Join your local protest on April 19th. Spread the word.

April 14, 2025 at 12:58 AM
Join your local protest on April 19th. Spread the word.
Reposted by Althea Archer
Yesterday was incredible. The official count is in — 5.2 million people joined the #HandsOff protest nationwide. So many are asking: what’s next? Mark your calendars: 4/19 is the next nationwide day of protest.
April 6, 2025 at 2:26 PM
Yesterday was incredible. The official count is in — 5.2 million people joined the #HandsOff protest nationwide. So many are asking: what’s next? Mark your calendars: 4/19 is the next nationwide day of protest.
Reposted by Althea Archer

As Governor, I will always stand with Minnesotans in the business of protecting fundamental rights.
March 3, 2025 at 10:18 PM
As Governor, I will always stand with Minnesotans in the business of protecting fundamental rights.
Reposted by Althea Archer
Musk’s status as a “special government employee” limits him to 130 days in the executive branch. However, despite working daily—documented by his own X posts—they claim he only works one day a week, effectively stretching his limit to 130 weeks. This needs to be brought to Congress—please share.
March 2, 2025 at 3:18 PM
Musk’s status as a “special government employee” limits him to 130 days in the executive branch. However, despite working daily—documented by his own X posts—they claim he only works one day a week, effectively stretching his limit to 130 weeks. This needs to be brought to Congress—please share.
Reposted by Althea Archer

Learn how to create stunning charts 📈 and maps 🌍 in this new lesson on Code Like a Journalist! We'll code #dataviz together using data from the 2023 Canadian wildfires.
I rewrote it a few times, so I’d love for you to check it out. 😅
Link in the comments! 👇
I rewrote it a few times, so I’d love for you to check it out. 😅
Link in the comments! 👇


February 20, 2025 at 1:46 PM
Learn how to create stunning charts 📈 and maps 🌍 in this new lesson on Code Like a Journalist! We'll code #dataviz together using data from the 2023 Canadian wildfires.
I rewrote it a few times, so I’d love for you to check it out. 😅
Link in the comments! 👇
I rewrote it a few times, so I’d love for you to check it out. 😅
Link in the comments! 👇
Reposted by Althea Archer
Every scientist, long before they were a scientist, was a little kid who stood in front of a fish tank or stared up at the stars or turned over a rock to look at the bugs underneath and said “wow”. On the best days, working in science still feels like that.
February 19, 2025 at 2:08 AM
Every scientist, long before they were a scientist, was a little kid who stood in front of a fish tank or stared up at the stars or turned over a rock to look at the bugs underneath and said “wow”. On the best days, working in science still feels like that.
Reposted by Althea Archer

Dear federal scientists: If you have been affected by the probationary firings and would be willing to speak with Science, please reach out to me by email (klangin@aaas.org) or on Signal. We can guarantee annonymity.
February 14, 2025 at 8:05 PM
Dear federal scientists: If you have been affected by the probationary firings and would be willing to speak with Science, please reach out to me by email (klangin@aaas.org) or on Signal. We can guarantee annonymity.
Reposted by Althea Archer

The making of last week's #TidyTuesday visualisation, recorded using {camcorder} in #RStats 📹
There was something weird going on with the interaction between {ggtext}/{marquee} and {ggpattern} for displaying images, so the hardest part ended up being arranging them with {patchwork}
There was something weird going on with the interaction between {ggtext}/{marquee} and {ggpattern} for displaying images, so the hardest part ended up being arranging them with {patchwork}
February 12, 2025 at 9:34 AM
The making of last week's #TidyTuesday visualisation, recorded using {camcorder} in #RStats 📹
There was something weird going on with the interaction between {ggtext}/{marquee} and {ggpattern} for displaying images, so the hardest part ended up being arranging them with {patchwork}
There was something weird going on with the interaction between {ggtext}/{marquee} and {ggpattern} for displaying images, so the hardest part ended up being arranging them with {patchwork}
Reposted by Althea Archer

#MakeOverMonday week 7 - Most Popular Valentine Day candy.
Tableau Public: public.tableau.com/app/profile/...
#dataviz #Tableau
Tableau Public: public.tableau.com/app/profile/...
#dataviz #Tableau

February 12, 2025 at 12:42 PM
#MakeOverMonday week 7 - Most Popular Valentine Day candy.
Tableau Public: public.tableau.com/app/profile/...
#dataviz #Tableau
Tableau Public: public.tableau.com/app/profile/...
#dataviz #Tableau
Reposted by Althea Archer

Reposted by Althea Archer

Alternatives to error bars in data visualization. www.storytellingwithdata.com/blog/error-b... #dataviz

an alternative to error bars — storytelling with data
So many data visualization and design-related questions are context-dependent. For example, if someone asks if one chart type is better or worse than another, the answer is, “It depends.” Who's the au...
www.storytellingwithdata.com
January 31, 2025 at 2:12 PM
Alternatives to error bars in data visualization. www.storytellingwithdata.com/blog/error-b... #dataviz
Reposted by Althea Archer

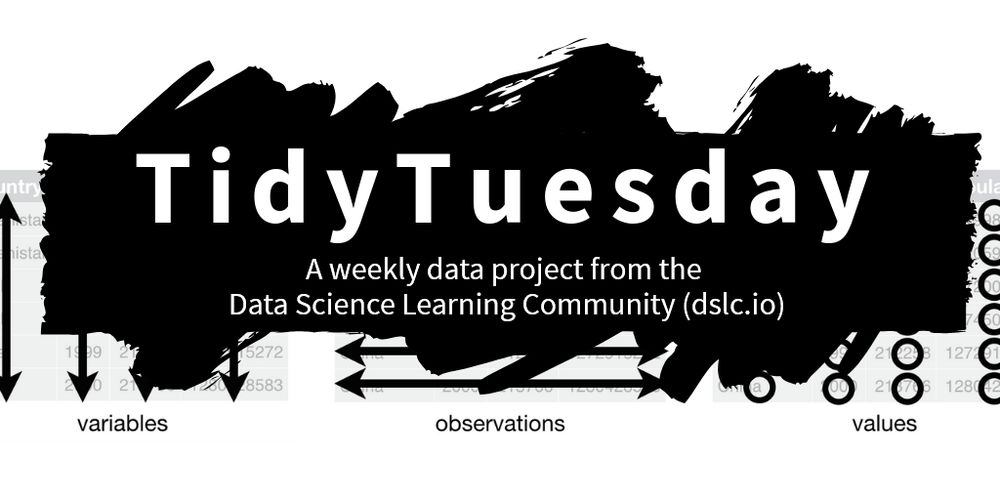
It's #TidyTuesday y'all! Show us what you made on our Slack at https://dslc.io!
#RStats #PyData #JuliaLang #RustLang #DataViz #DataScience #DataAnalytics #data #tidyverse #DataBS
#RStats #PyData #JuliaLang #RustLang #DataViz #DataScience #DataAnalytics #data #tidyverse #DataBS
Curator: @nnpereira
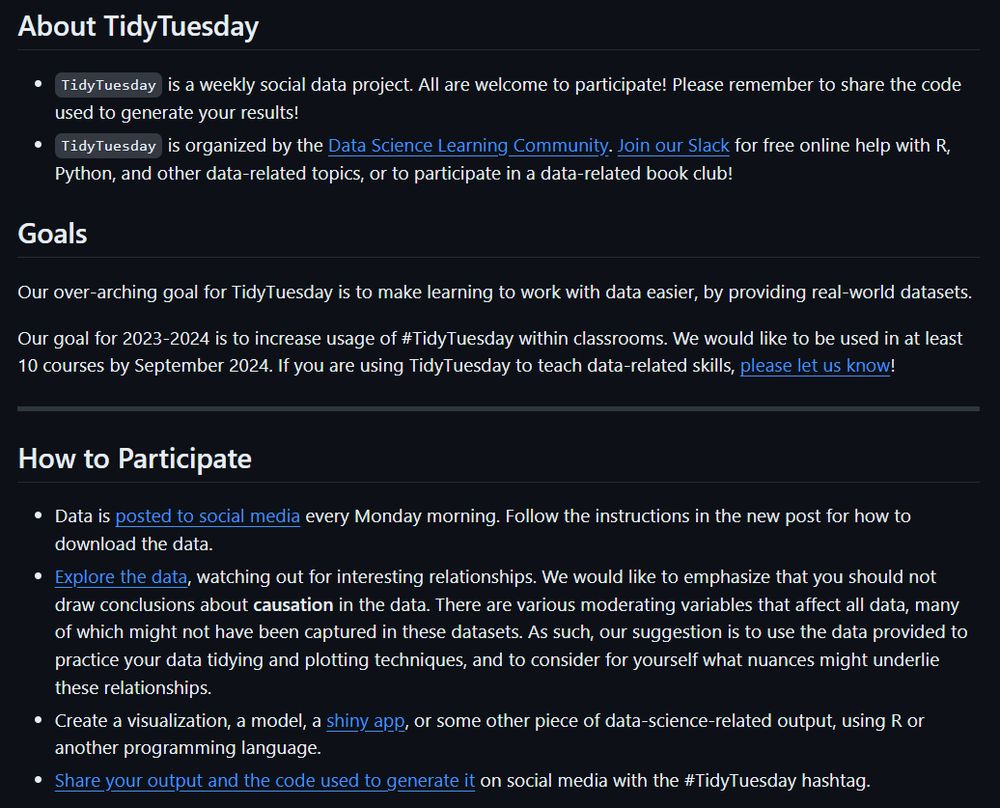
@dslc.io welcomes you to week 4 of #TidyTuesday! We're exploring Water Insecurity!
📁 https://tidytues.day/2025/2025-01-28
🗞️ https://waterdata.usgs.gov/blog/acs-maps/
#RStats #PyData #JuliaLang #DataViz #tidyverse #r4ds
@dslc.io welcomes you to week 4 of #TidyTuesday! We're exploring Water Insecurity!
📁 https://tidytues.day/2025/2025-01-28
🗞️ https://waterdata.usgs.gov/blog/acs-maps/
#RStats #PyData #JuliaLang #DataViz #tidyverse #r4ds

January 28, 2025 at 12:59 PM
It's #TidyTuesday y'all! Show us what you made on our Slack at https://dslc.io!
#RStats #PyData #JuliaLang #RustLang #DataViz #DataScience #DataAnalytics #data #tidyverse #DataBS
#RStats #PyData #JuliaLang #RustLang #DataViz #DataScience #DataAnalytics #data #tidyverse #DataBS
Reposted by Althea Archer

Curator: @nnpereira
@dslc.io welcomes you to week 4 of #TidyTuesday! We're exploring Water Insecurity!
📁 https://tidytues.day/2025/2025-01-28
🗞️ https://waterdata.usgs.gov/blog/acs-maps/
#RStats #PyData #JuliaLang #DataViz #tidyverse #r4ds
@dslc.io welcomes you to week 4 of #TidyTuesday! We're exploring Water Insecurity!
📁 https://tidytues.day/2025/2025-01-28
🗞️ https://waterdata.usgs.gov/blog/acs-maps/
#RStats #PyData #JuliaLang #DataViz #tidyverse #r4ds
January 27, 2025 at 1:40 PM
Curator: @nnpereira
@dslc.io welcomes you to week 4 of #TidyTuesday! We're exploring Water Insecurity!
📁 https://tidytues.day/2025/2025-01-28
🗞️ https://waterdata.usgs.gov/blog/acs-maps/
#RStats #PyData #JuliaLang #DataViz #tidyverse #r4ds
@dslc.io welcomes you to week 4 of #TidyTuesday! We're exploring Water Insecurity!
📁 https://tidytues.day/2025/2025-01-28
🗞️ https://waterdata.usgs.gov/blog/acs-maps/
#RStats #PyData #JuliaLang #DataViz #tidyverse #r4ds
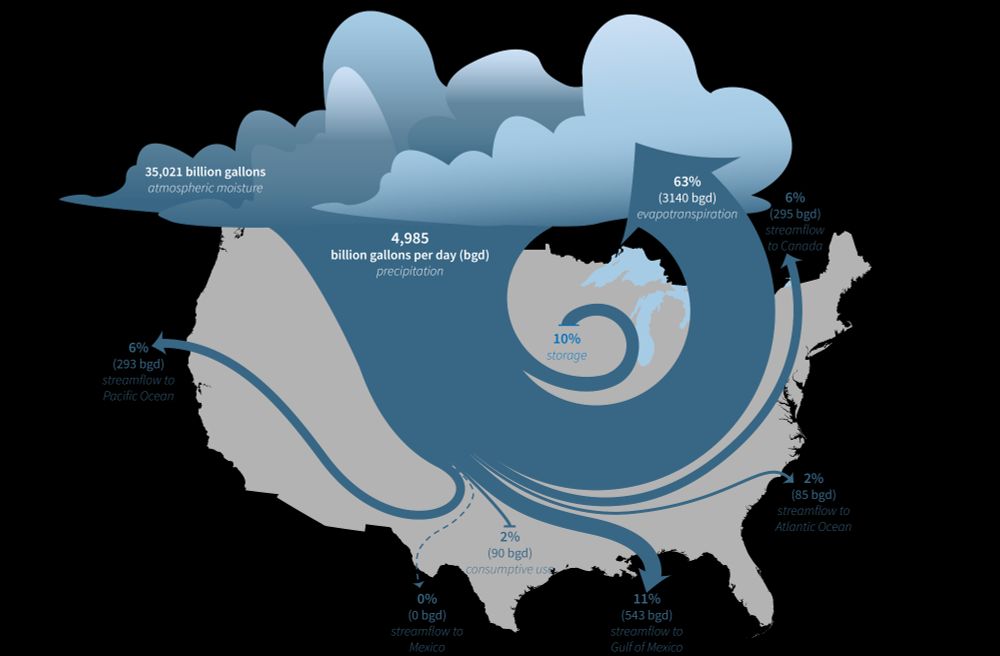
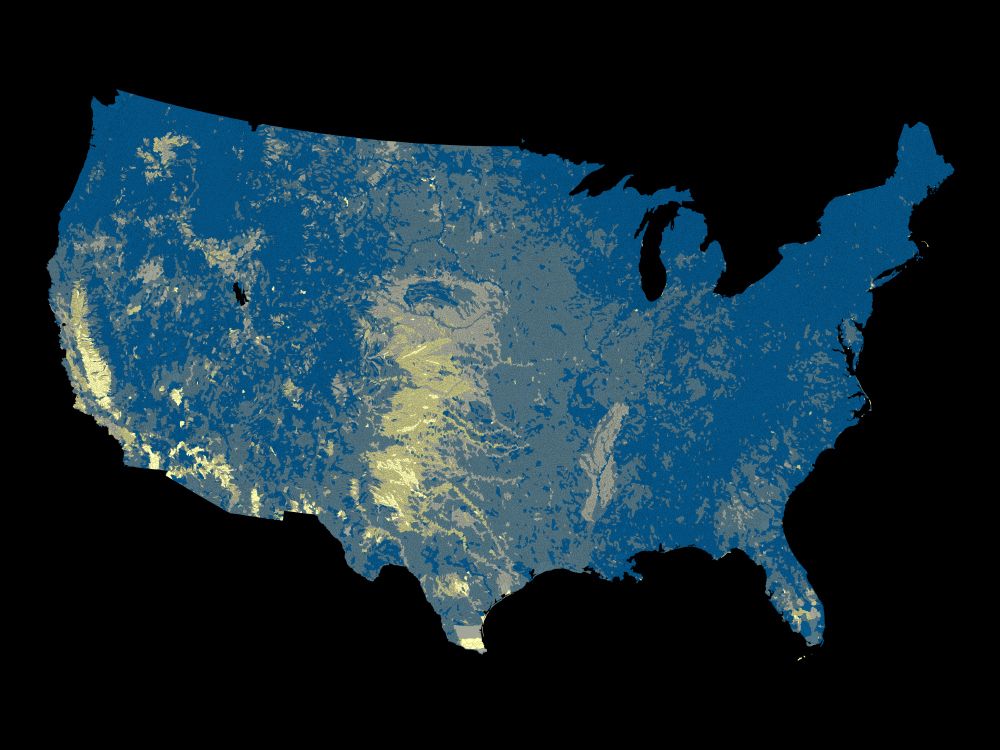
The U.S. Geological Survey (USGS) Vizlab has just released a new, interactive data visualization website about the USGS National Water Availability Assessment Report and Data Companion. Explore the data and the key findings of the assessment at water.usgs.gov/vizlab/water... #DataViz #rstats #USGS
January 16, 2025 at 6:20 PM
The U.S. Geological Survey (USGS) Vizlab has just released a new, interactive data visualization website about the USGS National Water Availability Assessment Report and Data Companion. Explore the data and the key findings of the assessment at water.usgs.gov/vizlab/water... #DataViz #rstats #USGS
Reposted by Althea Archer

NEW: Animation showing how the LA fires have spread over the past 7 days. Near hurricane-force winds are expected later today which firefighters fear could fan the devastating wildfires.
Read @grimeslikedimes.bsky.social and Myles McCormick's report
www.ft.com/content/1304...
#dataviz
Read @grimeslikedimes.bsky.social and Myles McCormick's report
www.ft.com/content/1304...
#dataviz
January 13, 2025 at 6:47 PM
NEW: Animation showing how the LA fires have spread over the past 7 days. Near hurricane-force winds are expected later today which firefighters fear could fan the devastating wildfires.
Read @grimeslikedimes.bsky.social and Myles McCormick's report
www.ft.com/content/1304...
#dataviz
Read @grimeslikedimes.bsky.social and Myles McCormick's report
www.ft.com/content/1304...
#dataviz
This whole blog series is 🔥
Reproducible Data Science in R: Writing better functions
Write functions in R that run better and are easier to understand. waterdata.usgs.gov/blog/rds-bet... #rstats #waterData
Write functions in R that run better and are easier to understand. waterdata.usgs.gov/blog/rds-bet... #rstats #waterData

January 16, 2025 at 5:05 PM
This whole blog series is 🔥