


Wílmar López-Barrios
@wil-lopezbarrios.bsky.social
Ph.D in Hipanic Linguistics
Currently working at Northwestern University
Opinions expressed are my own.
Currently working at Northwestern University
Opinions expressed are my own.
Reposted by Wílmar López-Barrios

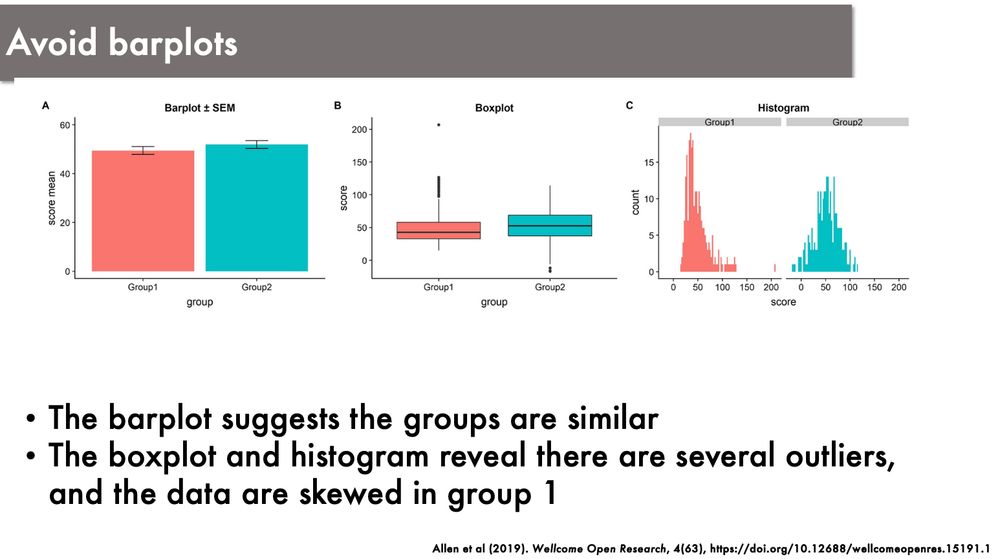
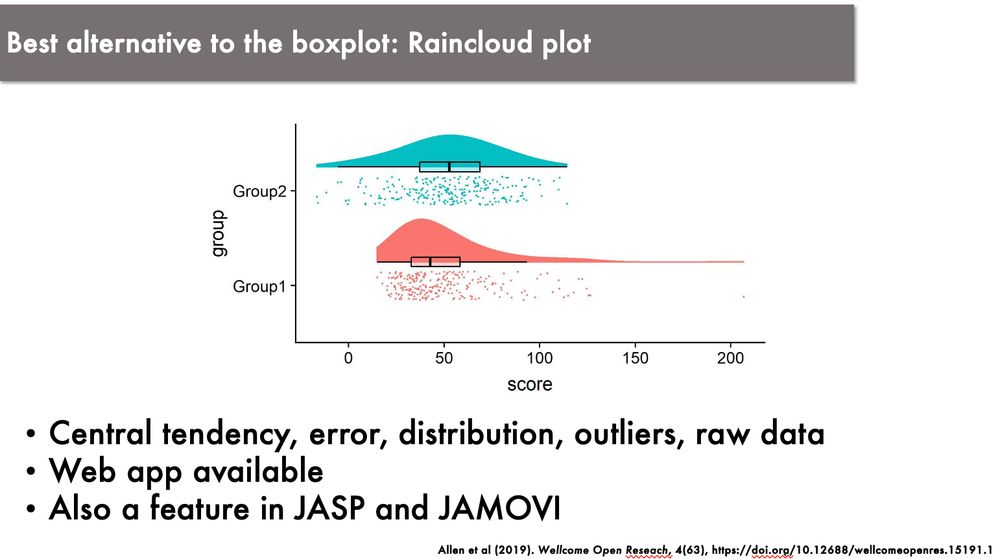
🎁 New tutorial on the R Graph Gallery!
A bump chart by @matschnetzer
The key to clarity in this #dataviz is highlighting a few key lines, preventing the chart from becoming too cluttered (aka spaghetti chart)
➡️ Full code and explanation:
r-graph-gallery.com/web-bump-plot-with-highlights.html
A bump chart by @matschnetzer
The key to clarity in this #dataviz is highlighting a few key lines, preventing the chart from becoming too cluttered (aka spaghetti chart)
➡️ Full code and explanation:
r-graph-gallery.com/web-bump-plot-with-highlights.html

January 15, 2025 at 2:38 PM
🎁 New tutorial on the R Graph Gallery!
A bump chart by @matschnetzer
The key to clarity in this #dataviz is highlighting a few key lines, preventing the chart from becoming too cluttered (aka spaghetti chart)
➡️ Full code and explanation:
r-graph-gallery.com/web-bump-plot-with-highlights.html
A bump chart by @matschnetzer
The key to clarity in this #dataviz is highlighting a few key lines, preventing the chart from becoming too cluttered (aka spaghetti chart)
➡️ Full code and explanation:
r-graph-gallery.com/web-bump-plot-with-highlights.html
Reposted by Wílmar López-Barrios
Additionally, you can now control the range of the y-axis when plotting waveforms, fx to ensure that multiple channels share the same range for easier comparison. (Thanks to @susfuchs.bsky.social for suggesting this!)


August 25, 2025 at 3:17 PM
Additionally, you can now control the range of the y-axis when plotting waveforms, fx to ensure that multiple channels share the same range for easier comparison. (Thanks to @susfuchs.bsky.social for suggesting this!)
Reposted by Wílmar López-Barrios
💥praatpicture 1.6.2 now on CRAN 💥
The main new feature is that there's now a function to draw spectral slices
The main new feature is that there's now a function to draw spectral slices

August 25, 2025 at 3:17 PM
💥praatpicture 1.6.2 now on CRAN 💥
The main new feature is that there's now a function to draw spectral slices
The main new feature is that there's now a function to draw spectral slices
Reposted by Wílmar López-Barrios

As a prep for my last lectures on phonetic fieldwork at the LSA summer institute, I created a youtube video guiding users through how I (quickly) mark phonetic variants in recordings. I’m happy to send along the Praat script (or similar versions on my website).
www.youtube.com/watch?v=cggx...
www.youtube.com/watch?v=cggx...
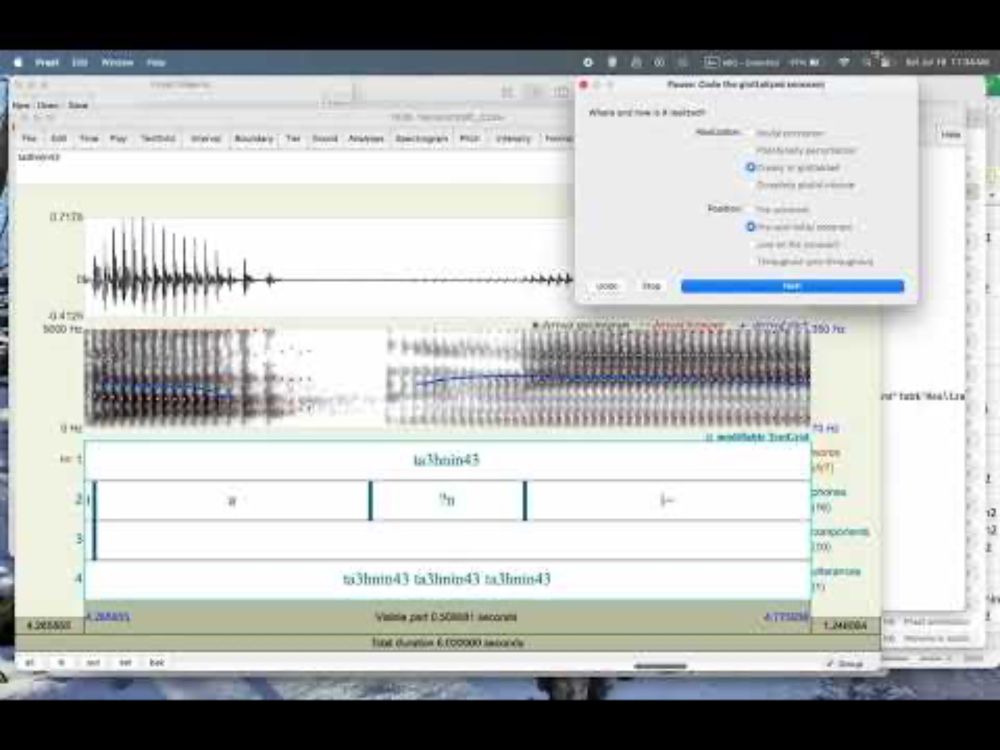
Phonetic variant coding - glottalized sonorants
YouTube video by Christian DiCanio
www.youtube.com
July 20, 2025 at 6:17 AM
As a prep for my last lectures on phonetic fieldwork at the LSA summer institute, I created a youtube video guiding users through how I (quickly) mark phonetic variants in recordings. I’m happy to send along the Praat script (or similar versions on my website).
www.youtube.com/watch?v=cggx...
www.youtube.com/watch?v=cggx...
Reposted by Wílmar López-Barrios
Nice article by @jrkasstan.bsky.social


August 16, 2025 at 1:57 PM
Nice article by @jrkasstan.bsky.social
Reposted by Wílmar López-Barrios

I wrote a quick tutorial for a student on how to use to R to get Whisper to automatically transcribe your audio. I figured others might find it useful too. #linguistics joeystanley.com/blog/whisper/
Automated Transcription in R using Whisper – Joey Stanley
joeystanley.com
March 12, 2025 at 7:36 PM
I wrote a quick tutorial for a student on how to use to R to get Whisper to automatically transcribe your audio. I figured others might find it useful too. #linguistics joeystanley.com/blog/whisper/
Reposted by Wílmar López-Barrios
praatpicture v1.4.2 is now on CRAN 🍾 meaning that these highlighting options are now available at an R package store near you (and in the Shiny app!). No other major updates this time!

April 2, 2025 at 2:49 PM
praatpicture v1.4.2 is now on CRAN 🍾 meaning that these highlighting options are now available at an R package store near you (and in the Shiny app!). No other major updates this time!
Reposted by Wílmar López-Barrios

Wow! This looks super useful.
(maybe a little niche but) do you like the look of Praat Pictures but have been annoyed with fiddling with them and having to make them in Praat before importing them into Rmd's or slide decks in R? OH BOY have I got something EXCITING for you!
github.com/rpuggaardrod...
github.com/rpuggaardrod...

GitHub - rpuggaardrode/praatpicture: Make Praat Picture style plots of acoustic data
Make Praat Picture style plots of acoustic data. Contribute to rpuggaardrode/praatpicture development by creating an account on GitHub.
github.com
August 25, 2023 at 3:30 PM
Wow! This looks super useful.
Reposted by Wílmar López-Barrios
🤜🏼🤛🏼

New paper with @casillas.bsky.social on Generalised Additive Models for bilingualism research: www.jbe-platform.com/content/jour...
A tutorial on generalised additive mixed effects models for bilingualism research | John Benjamins
Abstract
While recent years have seen a shift towards random effects modelling, particularly in areas of linguistics in
which nested structure is the norm (e.g., trial repetitions nested within partic...
www.jbe-platform.com
December 4, 2024 at 1:03 PM
🤜🏼🤛🏼
Reposted by Wílmar López-Barrios

More helpful (at least for me) resources from the blog archive: Seven (7!) tidyexplain-esque animations (downloadable and CC-licensed) showing how {dplyr}'s mutate(), summarize(), group_by(), and ungroup() all work together #rstats #dataskyence www.andrewheiss.com/blog/2024/04...


November 18, 2024 at 5:26 PM
More helpful (at least for me) resources from the blog archive: Seven (7!) tidyexplain-esque animations (downloadable and CC-licensed) showing how {dplyr}'s mutate(), summarize(), group_by(), and ungroup() all work together #rstats #dataskyence www.andrewheiss.com/blog/2024/04...
Reposted by Wílmar López-Barrios

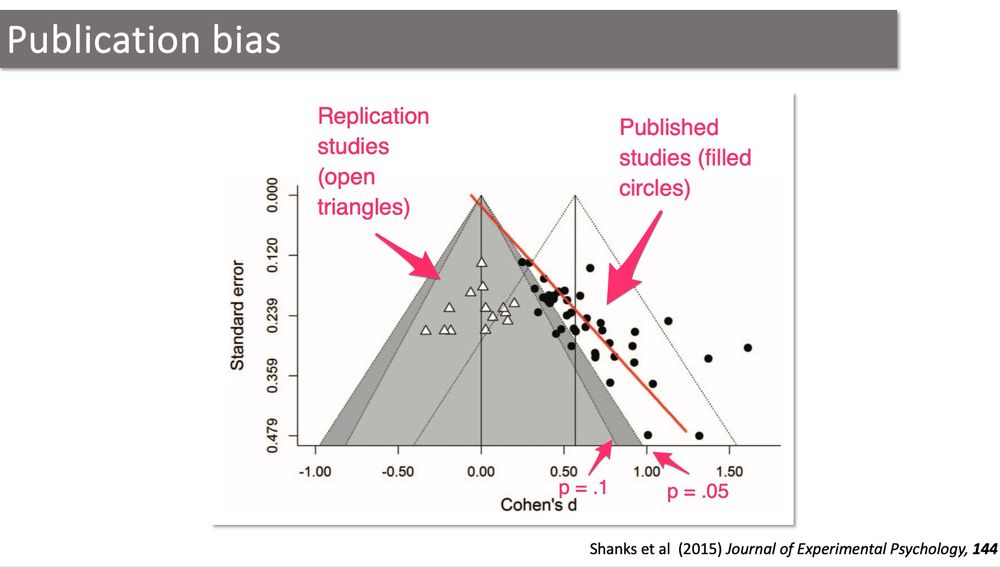
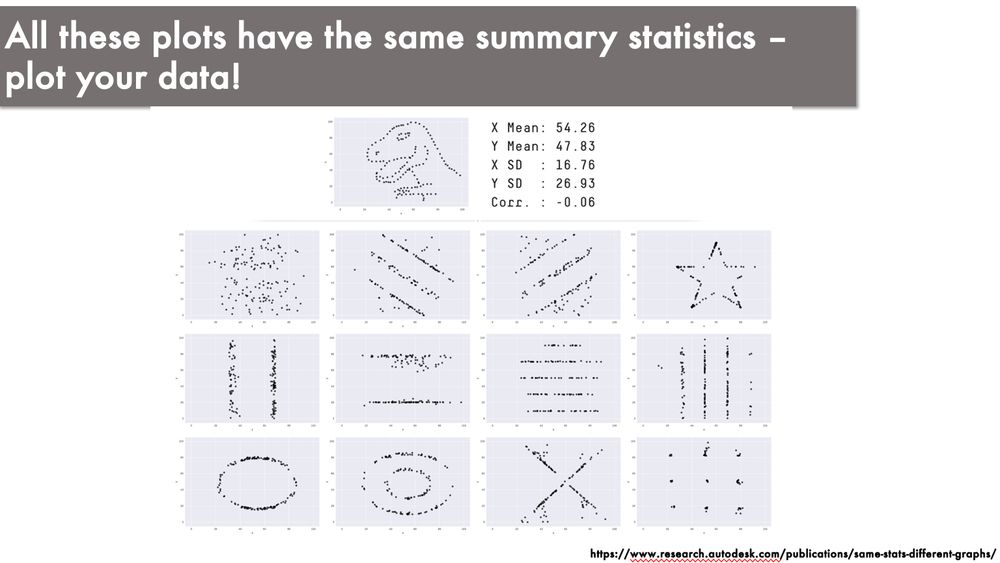
Today I'm delivering an open science lecture for our master students. These kind of lectures are one of the most enjoyable parts of my job
March 5, 2025 at 9:06 AM
Today I'm delivering an open science lecture for our master students. These kind of lectures are one of the most enjoyable parts of my job
Reposted by Wílmar López-Barrios

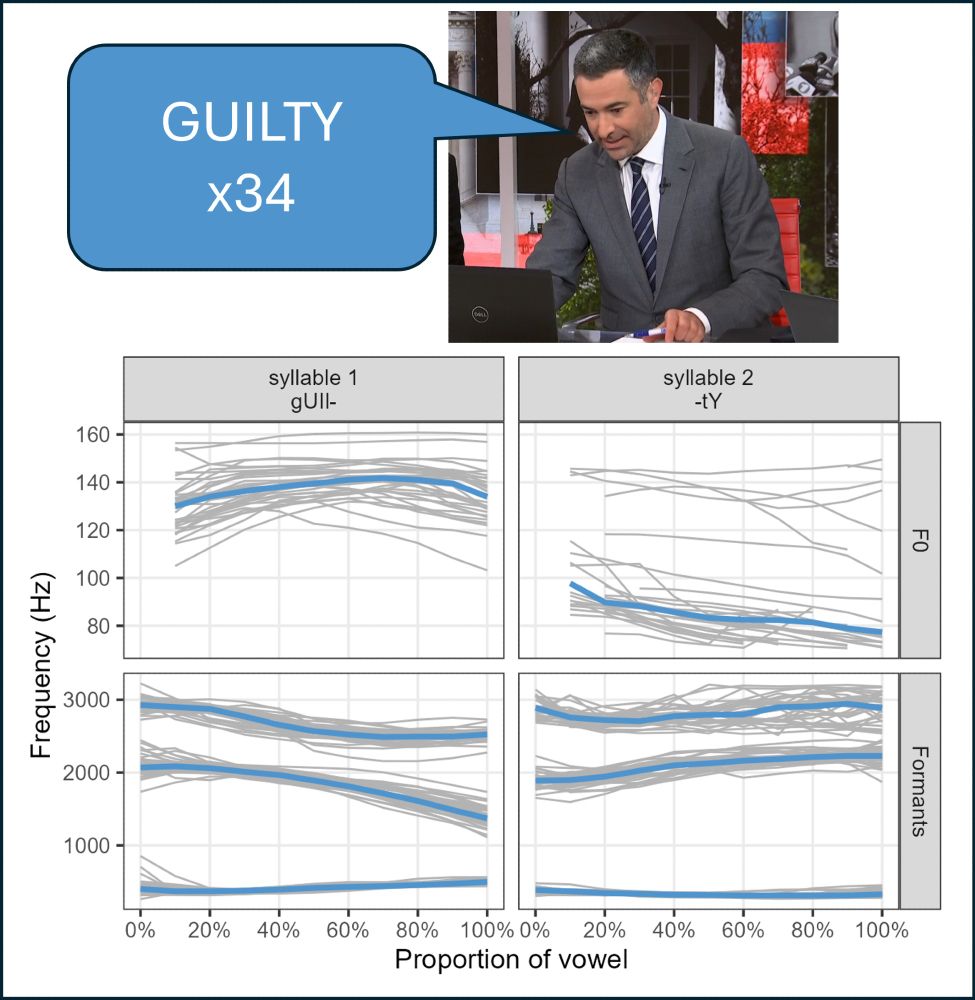
When a talker repeats the same vowel sequence 34 times in quick succession, a good phonetician simply can’t let that opportunity pass.
I present to you: the definitive acoustic analysis of Ari Melber's pronunciation of "guilty"
I present to you: the definitive acoustic analysis of Ari Melber's pronunciation of "guilty"
May 31, 2024 at 5:57 AM
When a talker repeats the same vowel sequence 34 times in quick succession, a good phonetician simply can’t let that opportunity pass.
I present to you: the definitive acoustic analysis of Ari Melber's pronunciation of "guilty"
I present to you: the definitive acoustic analysis of Ari Melber's pronunciation of "guilty"
Reposted by Wílmar López-Barrios
highlight individual waveforms in multichannel data!

May 23, 2024 at 10:05 AM
highlight individual waveforms in multichannel data!
Reposted by Wílmar López-Barrios
praatpicture 1.2.0 is now on CRAN, time for a HYPE THREAD 👀💅💯💥🍾🎉🎆

May 23, 2024 at 10:03 AM
praatpicture 1.2.0 is now on CRAN, time for a HYPE THREAD 👀💅💯💥🍾🎉🎆
Reposted by Wílmar López-Barrios
the Shiny app is opened with the shiny_praatpicture() command, but if you want to try it out, it's also running here: rpuggaardrode.shinyapps.io/praatpicture/
(it'll stop running if too many people use it at the same time though)
(it'll stop running if too many people use it at the same time though)
praatpicture: Praat-style plots of acousic data in R
rpuggaardrode.shinyapps.io
October 14, 2024 at 4:21 PM
the Shiny app is opened with the shiny_praatpicture() command, but if you want to try it out, it's also running here: rpuggaardrode.shinyapps.io/praatpicture/
(it'll stop running if too many people use it at the same time though)
(it'll stop running if too many people use it at the same time though)
Reposted by Wílmar López-Barrios
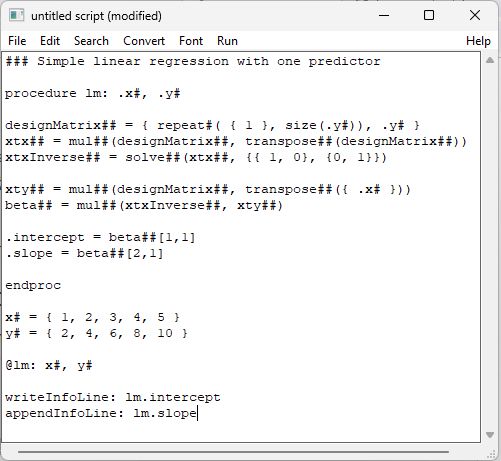
Praat: a language and environment for statistical computing
November 21, 2024 at 12:21 PM
Praat: a language and environment for statistical computing