


vey
@veytohell.bsky.social
yeah like 90% chance i'll have forgotten my password but i do not care
!i am not using this platform actively!
Mercedes fanboy
Hot Wheels collector
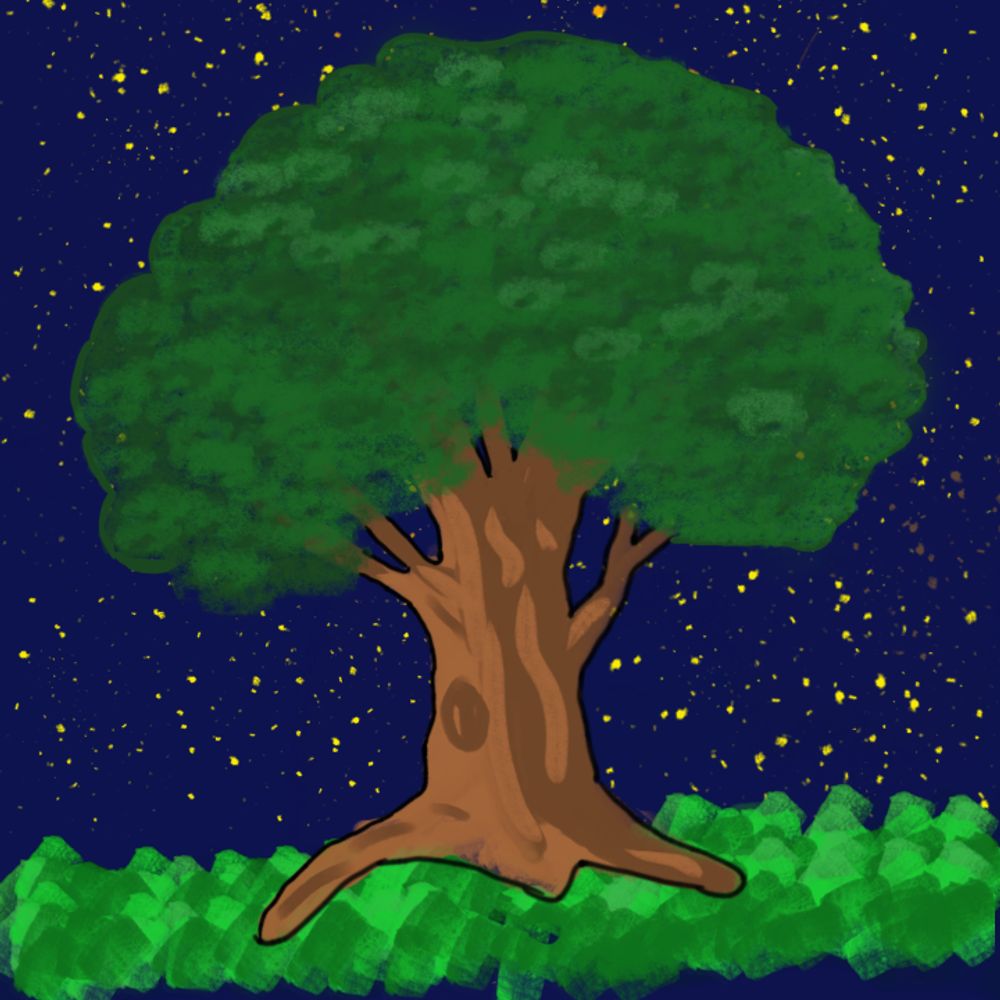
Drosera longifolia best plant
star star space beste coldmirror produktion
!i am not using this platform actively!
Mercedes fanboy
Hot Wheels collector
Drosera longifolia best plant
star star space beste coldmirror produktion
Me when I eat something and suddenly my stomach ache diminishes: Huh. I will learn nothing from this.
July 20, 2025 at 9:36 AM
Me when I eat something and suddenly my stomach ache diminishes: Huh. I will learn nothing from this.
I'm also not the happiest about Silverstone but I somehow manage to not have legitimately the worst takes ever about it.
July 15, 2025 at 4:37 PM
I'm also not the happiest about Silverstone but I somehow manage to not have legitimately the worst takes ever about it.
How is having a crush so much like getting rickrolled. Send help.
June 28, 2025 at 5:11 PM
How is having a crush so much like getting rickrolled. Send help.
Honestly, at this point it's a skill issue.
June 28, 2025 at 5:08 PM
Honestly, at this point it's a skill issue.
Reposted by vey
"Du bist doch Biologe, was ist das da!!??"
Biologe: "Ein Renault Twingo, willst du noch die Lottozahlen für nächste Woche wissen!!??" 😡
Biologe: "Ein Renault Twingo, willst du noch die Lottozahlen für nächste Woche wissen!!??" 😡
June 27, 2025 at 3:28 PM
"Du bist doch Biologe, was ist das da!!??"
Biologe: "Ein Renault Twingo, willst du noch die Lottozahlen für nächste Woche wissen!!??" 😡
Biologe: "Ein Renault Twingo, willst du noch die Lottozahlen für nächste Woche wissen!!??" 😡
Reposted by vey

Du bist doch Biologin, was für eine Pflanze ist das? Oder, noch verrückter: mir tut da was weh.
June 27, 2025 at 2:48 PM
Du bist doch Biologin, was für eine Pflanze ist das? Oder, noch verrückter: mir tut da was weh.
Reposted by vey
(1) VĚDCI OBJEVILI NOVÝ STAV HMOTY!!!
Senzační titulek jasně míří na zvědavost čtenáře. Nezkušeného čtenáře. Zkušený čtenář si totiž řekne: “Počkat, už zase? Není těch STATE OF MATTER už nějak moc?!”.
Senzační titulek jasně míří na zvědavost čtenáře. Nezkušeného čtenáře. Zkušený čtenář si totiž řekne: “Počkat, už zase? Není těch STATE OF MATTER už nějak moc?!”.
June 4, 2025 at 7:21 AM
(1) VĚDCI OBJEVILI NOVÝ STAV HMOTY!!!
Senzační titulek jasně míří na zvědavost čtenáře. Nezkušeného čtenáře. Zkušený čtenář si totiž řekne: “Počkat, už zase? Není těch STATE OF MATTER už nějak moc?!”.
Senzační titulek jasně míří na zvědavost čtenáře. Nezkušeného čtenáře. Zkušený čtenář si totiž řekne: “Počkat, už zase? Není těch STATE OF MATTER už nějak moc?!”.
Reposted by vey
WARUM UNTERBRECHEN NICHT ALLE SENDER IHR PROGRAMM??? HALLO???
June 2, 2025 at 5:25 PM
WARUM UNTERBRECHEN NICHT ALLE SENDER IHR PROGRAMM??? HALLO???
she looks so good in that hoodie and stupid backwards cap and even stupider fucking glasses
May 19, 2025 at 6:44 PM
she looks so good in that hoodie and stupid backwards cap and even stupider fucking glasses
nur um hier klarzustellen, von wem geraubt wurde
Island mit einem Lied über das Rudern – ein wissenschaftlich unterschätztes Thema. Die Hydromechanik des Ruderns ist komplex. Beim Ruderschlag entstehen kleine rotierende Strömungen, sogenannte Vortices, die unerwünscht sind, weil ihre Energie nicht zur Vorwärtsbewegung beiträgt. #ESC2025
May 18, 2025 at 7:26 AM
nur um hier klarzustellen, von wem geraubt wurde
Reposted by vey

#Arctic air temperature rank by month over the satellite era - now updated through April 2025, which was less anomalous than earlier in the year
+ Ranks: 1=warmest (red), 46/47=coldest (blue)
+ Download higher resolution: zacklabe.com/arctic-tempe...
+ Data from: psl.noaa.gov/data/gridded...
+ Ranks: 1=warmest (red), 46/47=coldest (blue)
+ Download higher resolution: zacklabe.com/arctic-tempe...
+ Data from: psl.noaa.gov/data/gridded...
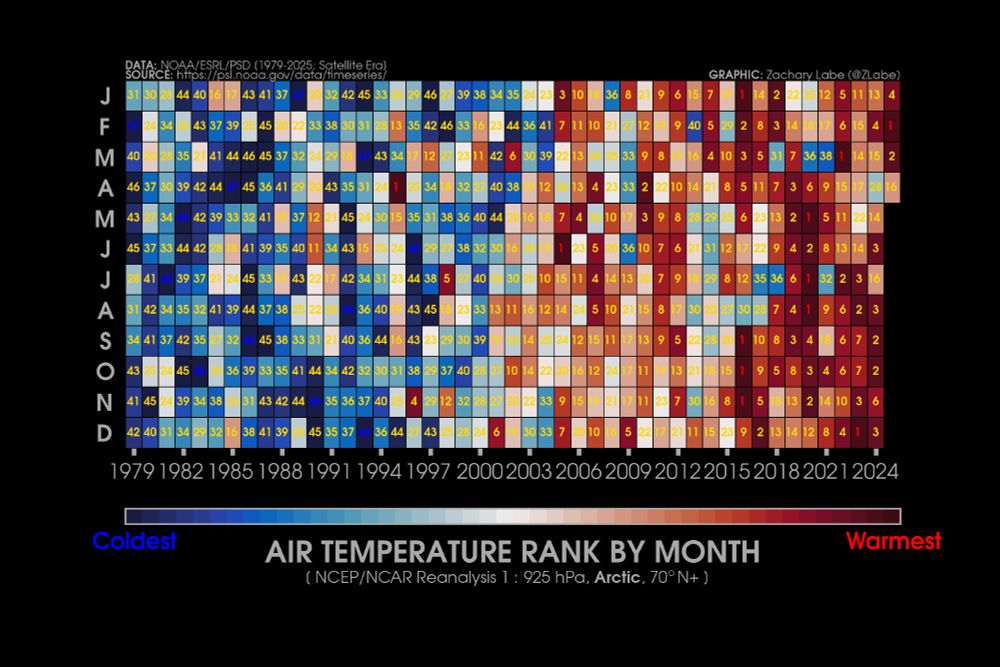
May 3, 2025 at 4:16 PM
#Arctic air temperature rank by month over the satellite era - now updated through April 2025, which was less anomalous than earlier in the year
+ Ranks: 1=warmest (red), 46/47=coldest (blue)
+ Download higher resolution: zacklabe.com/arctic-tempe...
+ Data from: psl.noaa.gov/data/gridded...
+ Ranks: 1=warmest (red), 46/47=coldest (blue)
+ Download higher resolution: zacklabe.com/arctic-tempe...
+ Data from: psl.noaa.gov/data/gridded...
maybe I should listen to Reddit
April 14, 2025 at 11:33 AM
maybe I should listen to Reddit
Reposted by vey
Friday ice update - #Arctic sea ice extent is currently the 5th lowest on record (JAXA data)
• about 310,000 km² below the 2010s mean
• about 660,000 km² below the 2000s mean
• about 1,130,000 km² below the 1990s mean
• about 1,640,000 km² below the 1980s mean
Plots: zacklabe.com/arctic-sea-i... 🧪
• about 310,000 km² below the 2010s mean
• about 660,000 km² below the 2000s mean
• about 1,130,000 km² below the 1990s mean
• about 1,640,000 km² below the 1980s mean
Plots: zacklabe.com/arctic-sea-i... 🧪

April 11, 2025 at 8:02 PM
Friday ice update - #Arctic sea ice extent is currently the 5th lowest on record (JAXA data)
• about 310,000 km² below the 2010s mean
• about 660,000 km² below the 2000s mean
• about 1,130,000 km² below the 1990s mean
• about 1,640,000 km² below the 1980s mean
Plots: zacklabe.com/arctic-sea-i... 🧪
• about 310,000 km² below the 2010s mean
• about 660,000 km² below the 2000s mean
• about 1,130,000 km² below the 1990s mean
• about 1,640,000 km² below the 1980s mean
Plots: zacklabe.com/arctic-sea-i... 🧪
You begged god for help and god sent you that resource and you just wouldn't take it.
Whose fault is it really? Wasn't Mephisto correct in his assumption?
Whose fault is it really? Wasn't Mephisto correct in his assumption?
April 10, 2025 at 9:02 PM
You begged god for help and god sent you that resource and you just wouldn't take it.
Whose fault is it really? Wasn't Mephisto correct in his assumption?
Whose fault is it really? Wasn't Mephisto correct in his assumption?
Come to the bad side we have edgy teens who really should grow up but can't accept they've wasted their childhood on some lie of fitting in when they've known they just won't since they were nine.
aka: could've been a youngshit, could still be a youngishshit but too much of a coward (sry future me)
aka: could've been a youngshit, could still be a youngishshit but too much of a coward (sry future me)
April 10, 2025 at 8:58 PM
Come to the bad side we have edgy teens who really should grow up but can't accept they've wasted their childhood on some lie of fitting in when they've known they just won't since they were nine.
aka: could've been a youngshit, could still be a youngishshit but too much of a coward (sry future me)
aka: could've been a youngshit, could still be a youngishshit but too much of a coward (sry future me)
Reposted by vey
Spring didn't really start out very interesting (arriving later than average in much of the south & west), but is showing up early in the middle of the country and creeping into the NE early now! #phenology #statusofspring @usa-npn.bsky.social www.usanpn.org/data/maps/sp...

April 10, 2025 at 5:40 PM
Spring didn't really start out very interesting (arriving later than average in much of the south & west), but is showing up early in the middle of the country and creeping into the NE early now! #phenology #statusofspring @usa-npn.bsky.social www.usanpn.org/data/maps/sp...
Reposted by vey

📞🌆 || #pixelart #artpost #pixel_dailies
April 2, 2025 at 8:01 PM
📞🌆 || #pixelart #artpost #pixel_dailies
Coolest shit I've seen in my life (since his last graph)
My #Arctic observation and climate model comparison page has been updated through 2024 (along with the addition of a new visualization or two). This page is updated seasonally. zacklabe.com/climate-mode... ⚒️

Climate model projections compared to observations in the Arctic
Note: The climate model projections here primarily use SSP3-7.0/RCP8.5, which consider extreme greenhouse gas emissions scenarios (outliers). I will include more realistic SSP2-4.5 graphics in a fu…
zacklabe.com
April 2, 2025 at 2:25 PM
Coolest shit I've seen in my life (since his last graph)
Real
Wenn man im tiefen Niederösterreich einen Quantenvortrag hält und dann in den Bus steigt, dann hat man gleichzeitig das Gefühl, im richtigen Bus zu sitzen und nicht das Gefühl, im richtigen Bus zu sitzen, bis man hinschaut wo man ist, und der Busfahrer sagt "nein, Mödling ist völlig wo anders"
HILFE
HILFE
April 2, 2025 at 2:19 PM
Real
Reposted by vey

birds are so cool I wish they were real
March 29, 2025 at 4:15 PM
birds are so cool I wish they were real
Genial, endlich jemand in diesem Kontinent, der Logik besitzt
Leute, die Sommerzeit-Umstellung ist eine gute Sache. Ich weiß - man hört jetzt wieder überall "aber WISSENSCHAFTLICH GESEHEN sollten wir doch ganzjährig NORMALZEIT haben!"
Das halte ich für ein Missverständnis.
Let me explain. (Thread)
Das halte ich für ein Missverständnis.
Let me explain. (Thread)
April 2, 2025 at 2:11 PM
Genial, endlich jemand in diesem Kontinent, der Logik besitzt
Reposted by vey
Your 'moment of doom' for March 30, 2025 ~ The end of bees.
"The data is showing us this is the worst bee loss in recorded history"
www.cbsnews.com/news/bee-dea...
"The data is showing us this is the worst bee loss in recorded history"
www.cbsnews.com/news/bee-dea...

Millions of bees have died this year. It's "the worst bee loss in recorded history," one beekeeper says
Bees play a key role in the U.S. food supply, and the mass deaths could jeopardize that.
www.cbsnews.com
March 30, 2025 at 11:54 AM
Your 'moment of doom' for March 30, 2025 ~ The end of bees.
"The data is showing us this is the worst bee loss in recorded history"
www.cbsnews.com/news/bee-dea...
"The data is showing us this is the worst bee loss in recorded history"
www.cbsnews.com/news/bee-dea...
Reposted by vey
Thanks to a follower suggestion, I've added a visualization showing the mean #Arctic sea ice extent for each summer season (June-September). This can be a way of tracking whether each region is becoming seasonally ice-free.
Graphic will be updated annually at: zacklabe.com/arctic-sea-i... 🌊
Graphic will be updated annually at: zacklabe.com/arctic-sea-i... 🌊

April 1, 2025 at 5:26 PM
Thanks to a follower suggestion, I've added a visualization showing the mean #Arctic sea ice extent for each summer season (June-September). This can be a way of tracking whether each region is becoming seasonally ice-free.
Graphic will be updated annually at: zacklabe.com/arctic-sea-i... 🌊
Graphic will be updated annually at: zacklabe.com/arctic-sea-i... 🌊
Reposted by vey
Temperature anomalies by latitude band for every month of 2024...
Plot shows zonal-mean surface air temperature anomalies, where latitude = x-axis (not scaled by distance). Note that there is coarse data (e.g., flat line ends) at the poles (GISTEMPv4 data). Graphic from zacklabe.com/climate-chan...
Plot shows zonal-mean surface air temperature anomalies, where latitude = x-axis (not scaled by distance). Note that there is coarse data (e.g., flat line ends) at the poles (GISTEMPv4 data). Graphic from zacklabe.com/climate-chan...
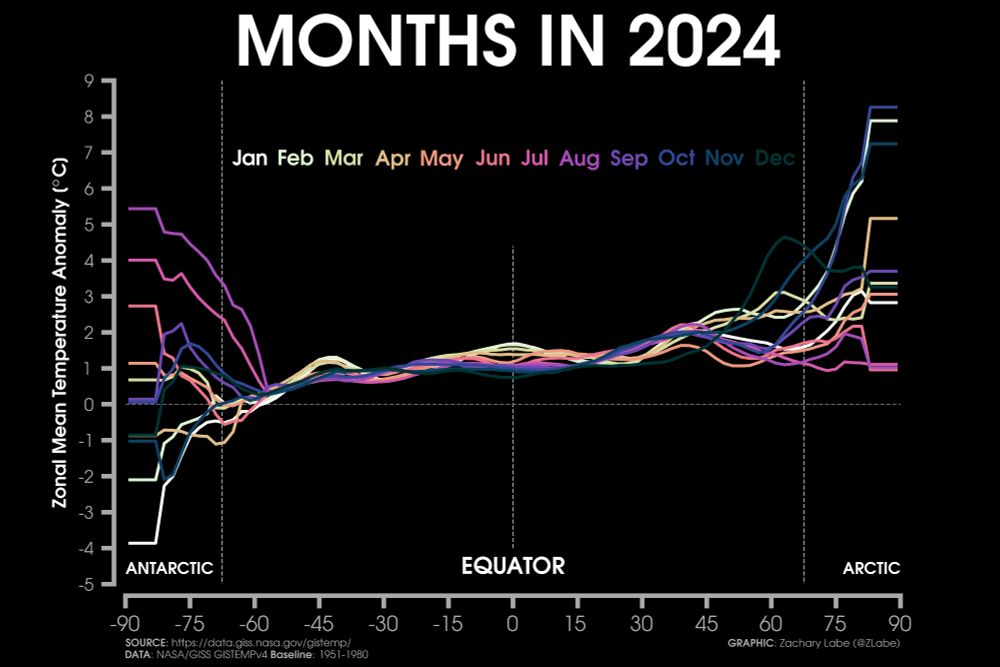
April 1, 2025 at 12:08 PM
Temperature anomalies by latitude band for every month of 2024...
Plot shows zonal-mean surface air temperature anomalies, where latitude = x-axis (not scaled by distance). Note that there is coarse data (e.g., flat line ends) at the poles (GISTEMPv4 data). Graphic from zacklabe.com/climate-chan...
Plot shows zonal-mean surface air temperature anomalies, where latitude = x-axis (not scaled by distance). Note that there is coarse data (e.g., flat line ends) at the poles (GISTEMPv4 data). Graphic from zacklabe.com/climate-chan...
Reposted by vey
My monthly #Arctic temperature graphics have just been updated through February 2025, which was one of the most anomalous months on record for this region: zacklabe.com/arctic-tempe...
#DataViz #SciComm #OpenScience #OpenData ⚒️
#DataViz #SciComm #OpenScience #OpenData ⚒️

Arctic Temperatures
My visualizations: Arctic Climate Seasonality and Variability Arctic Sea Ice Extent and Concentration Arctic Sea Ice Volume and Thickness Arctic Temperatures Antarctic Sea Ice Extent and Concentrat…
zacklabe.com
March 9, 2025 at 10:22 PM
My monthly #Arctic temperature graphics have just been updated through February 2025, which was one of the most anomalous months on record for this region: zacklabe.com/arctic-tempe...
#DataViz #SciComm #OpenScience #OpenData ⚒️
#DataViz #SciComm #OpenScience #OpenData ⚒️