


Thaddeus Sholto
@thadsholto.bsky.social
Reposted by Thaddeus Sholto

Here's a new GAO report on the federal statistical system's need to modernize and adapt to a rapidly changing data landscape--based on a forum GAO held in 2024 with experts and stakeholders.
#econsky
www.gao.gov/products/gao...
#econsky
www.gao.gov/products/gao...
www.gao.gov
September 24, 2025 at 9:36 PM
Here's a new GAO report on the federal statistical system's need to modernize and adapt to a rapidly changing data landscape--based on a forum GAO held in 2024 with experts and stakeholders.
#econsky
www.gao.gov/products/gao...
#econsky
www.gao.gov/products/gao...
Reposted by Thaddeus Sholto

"This paper presents new methods for estimating long run treatment effects from short term experiments and observational data."
New paper from Athey, Chetty, Imbens, and Kang:
restud.com/the-surrogat...
#econsky
#REStud
New paper from Athey, Chetty, Imbens, and Kang:
restud.com/the-surrogat...
#econsky
#REStud

September 24, 2025 at 1:36 PM
"This paper presents new methods for estimating long run treatment effects from short term experiments and observational data."
New paper from Athey, Chetty, Imbens, and Kang:
restud.com/the-surrogat...
#econsky
#REStud
New paper from Athey, Chetty, Imbens, and Kang:
restud.com/the-surrogat...
#econsky
#REStud
Reposted by Thaddeus Sholto

christinecai.github.io
August 25, 2025 at 9:32 AM
Reposted by Thaddeus Sholto
1/
What does the social fabric of an entire country look like?
We built a nation-scale social network of Denmark — 7.2 million people, 1.4 billion ties, 14 years of data.
Here’s what we found 👇
📄 doi.org/10.1038/s415...
#NetworkScience #Sociology
What does the social fabric of an entire country look like?
We built a nation-scale social network of Denmark — 7.2 million people, 1.4 billion ties, 14 years of data.
Here’s what we found 👇
📄 doi.org/10.1038/s415...
#NetworkScience #Sociology
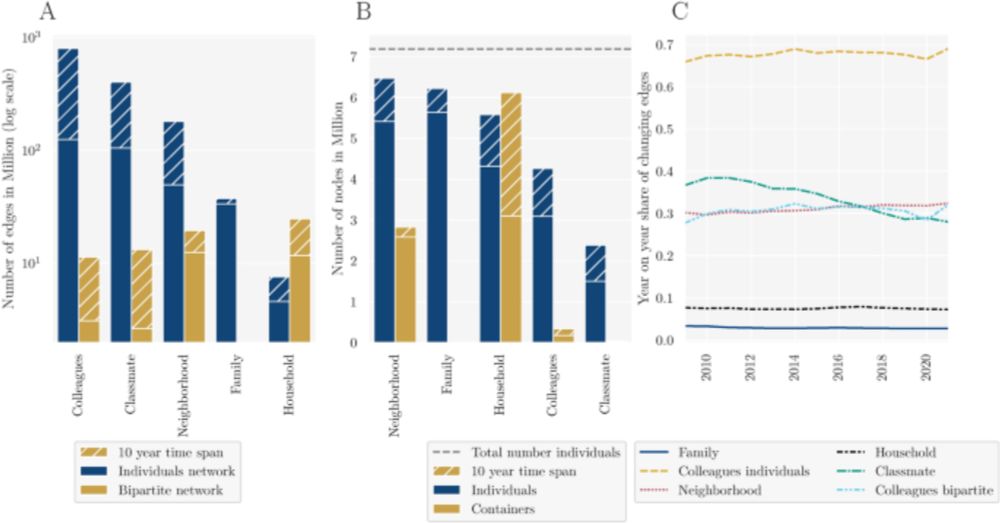
Unveiling the social fabric through a temporal, nation-scale social network and its characteristics - Scientific Reports
Scientific Reports - Unveiling the social fabric through a temporal, nation-scale social network and its characteristics
doi.org
July 29, 2025 at 3:35 PM
1/
What does the social fabric of an entire country look like?
We built a nation-scale social network of Denmark — 7.2 million people, 1.4 billion ties, 14 years of data.
Here’s what we found 👇
📄 doi.org/10.1038/s415...
#NetworkScience #Sociology
What does the social fabric of an entire country look like?
We built a nation-scale social network of Denmark — 7.2 million people, 1.4 billion ties, 14 years of data.
Here’s what we found 👇
📄 doi.org/10.1038/s415...
#NetworkScience #Sociology
Reposted by Thaddeus Sholto

A Lightweight Deep Learning-based Model for Ranking Influential Nodes in Complex Networks
https://arxiv.org/abs/2507.19702
Identifying influential nodes in complex networks is a critical task with a wide range of applications across different domains. However, existing approaches often face t...📈🤖
https://arxiv.org/abs/2507.19702
Identifying influential nodes in complex networks is a critical task with a wide range of applications across different domains. However, existing approaches often face t...📈🤖
July 29, 2025 at 4:32 PM
A Lightweight Deep Learning-based Model for Ranking Influential Nodes in Complex Networks
https://arxiv.org/abs/2507.19702
Identifying influential nodes in complex networks is a critical task with a wide range of applications across different domains. However, existing approaches often face t...📈🤖
https://arxiv.org/abs/2507.19702
Identifying influential nodes in complex networks is a critical task with a wide range of applications across different domains. However, existing approaches often face t...📈🤖
Reposted by Thaddeus Sholto

Quasi-Experimental Shift-Share Research Designs
by Kirill Borusyak & Peter Hull & Xavier Jaravel (2018)
by Kirill Borusyak & Peter Hull & Xavier Jaravel (2018)
IDEAS/RePEc link
to RePEc:arx:papers:1806.01221
ideas.repec.org
February 1, 2025 at 7:43 AM
Quasi-Experimental Shift-Share Research Designs
by Kirill Borusyak & Peter Hull & Xavier Jaravel (2018)
by Kirill Borusyak & Peter Hull & Xavier Jaravel (2018)
Reposted by Thaddeus Sholto

Economists love using linear regression to estimate treatment effects — it turns out that there are perils to this method, but also amazing perks
Come with me in this 🧵 if you want to learn about our now-published paper "Contamination Bias in Linear Regressions!"
1/ (Twitter rerun!)
Come with me in this 🧵 if you want to learn about our now-published paper "Contamination Bias in Linear Regressions!"
1/ (Twitter rerun!)

The December 2024 issue of the American Economic Review (114, 12) is now available online at aeaweb.org/issues/785.

American Economic Review
Vol. 114 No. 12 December 2024
aeaweb.org
November 30, 2024 at 12:29 PM
Economists love using linear regression to estimate treatment effects — it turns out that there are perils to this method, but also amazing perks
Come with me in this 🧵 if you want to learn about our now-published paper "Contamination Bias in Linear Regressions!"
1/ (Twitter rerun!)
Come with me in this 🧵 if you want to learn about our now-published paper "Contamination Bias in Linear Regressions!"
1/ (Twitter rerun!)
Reposted by Thaddeus Sholto
In order to add some clarity on why the answer is just "use robust SE", here's a simulations that follow Abadie et al.'s paper "When Should You Adjust Standard Errors for Clustering?"
This is pure random assignment of treatment. Cluster SE are way too big, and robust SE are close.
This is pure random assignment of treatment. Cluster SE are way too big, and robust SE are close.

November 22, 2024 at 1:02 AM
In order to add some clarity on why the answer is just "use robust SE", here's a simulations that follow Abadie et al.'s paper "When Should You Adjust Standard Errors for Clustering?"
This is pure random assignment of treatment. Cluster SE are way too big, and robust SE are close.
This is pure random assignment of treatment. Cluster SE are way too big, and robust SE are close.
Reposted by Thaddeus Sholto

1. The conventional explanation for food deserts—that these places are too poor or too rural to generate enough spending on groceries, or too Black to overcome racist corporate redlining — fail to grapple with a key fact: food deserts didn’t used to exist. My new piece in The Atlantic.
The Mystery of Food Deserts
They didn’t materialize around the country for no reason. Something happened.
www.theatlantic.com
December 1, 2024 at 2:06 PM
1. The conventional explanation for food deserts—that these places are too poor or too rural to generate enough spending on groceries, or too Black to overcome racist corporate redlining — fail to grapple with a key fact: food deserts didn’t used to exist. My new piece in The Atlantic.
Reposted by Thaddeus Sholto

Mapping out tangible ways economists can use language models in their daily workflow, from ideation to publication, from Anton Korinek https://www.nber.org/papers/w33198

November 30, 2024 at 8:00 PM
Mapping out tangible ways economists can use language models in their daily workflow, from ideation to publication, from Anton Korinek https://www.nber.org/papers/w33198
Reposted by Thaddeus Sholto
P-EBT, which gave grocery vouchers worth about $300 to students who lost access to free meals during COVID, reduced food hardship and moms' mental health problems, from Lauren L. Bauer, Krista J. Ruffini, and Diane Whitmore Schanzenbach https://www.nber.org/papers/w33199

November 30, 2024 at 10:00 PM
P-EBT, which gave grocery vouchers worth about $300 to students who lost access to free meals during COVID, reduced food hardship and moms' mental health problems, from Lauren L. Bauer, Krista J. Ruffini, and Diane Whitmore Schanzenbach https://www.nber.org/papers/w33199
Reposted by Thaddeus Sholto

Two-thirds of Illinoisans live in the six-county Chicago region. 41% live in Cook County.

November 18, 2024 at 8:46 PM
Two-thirds of Illinoisans live in the six-county Chicago region. 41% live in Cook County.
Reposted by Thaddeus Sholto
Oh, forgot to include the "policy didn't cause inflation" chart 5/

November 18, 2024 at 2:57 PM
Oh, forgot to include the "policy didn't cause inflation" chart 5/
Reposted by Thaddeus Sholto

Reposted by Thaddeus Sholto

Consider the simplest DiD setup with panel data. T = 2, controls X(i) don't change over time. D(i) is the "ever treated" indicator, f2(t) the second period time dummy. W(i,t) the time-varying treatment W(i,t) = D(i)*f2(t). The X(i) appear flexibly to allow selection and heterogeneous trends.
November 20, 2024 at 4:45 PM
Consider the simplest DiD setup with panel data. T = 2, controls X(i) don't change over time. D(i) is the "ever treated" indicator, f2(t) the second period time dummy. W(i,t) the time-varying treatment W(i,t) = D(i)*f2(t). The X(i) appear flexibly to allow selection and heterogeneous trends.