


Rutger
@rutje.bsky.social
They share a lot of data on KNMI's Climate Explorer, which has its issues as shown and the versioning could be better, but it helps understanding the workflow. As far as I can tell all their publications are open access, which is also awesome.
November 12, 2025 at 12:48 PM
They share a lot of data on KNMI's Climate Explorer, which has its issues as shown and the versioning could be better, but it helps understanding the workflow. As far as I can tell all their publications are open access, which is also awesome.
To end on a more positive note. It's awesome that they have a repo with their code (even though it obviously doesn't match the paper, it's not too far off either). That should be required for any analysis of this type.
November 12, 2025 at 12:48 PM
To end on a more positive note. It's awesome that they have a repo with their code (even though it obviously doesn't match the paper, it's not too far off either). That should be required for any analysis of this type.
Specifically regarding the misleading way they communicate their results in the media even as early as March 2014 (see Meteorologica magazine for that month) were they publicly called out by former @KNMI employee Henk de Bruin (no slouch on evaporation), to this day they keep doubling down on it.
November 12, 2025 at 12:48 PM
Specifically regarding the misleading way they communicate their results in the media even as early as March 2014 (see Meteorologica magazine for that month) were they publicly called out by former @KNMI employee Henk de Bruin (no slouch on evaporation), to this day they keep doubling down on it.
@knmi.nl has been well aware of the quality issues with their work and communication for many years, this paper is just an example, not an incident. Many people have notified them about these issues, myself included. They simply refuse to address it.
November 12, 2025 at 12:48 PM
@knmi.nl has been well aware of the quality issues with their work and communication for many years, this paper is just an example, not an incident. Many people have notified them about these issues, myself included. They simply refuse to address it.
I'm sure there are many more issues, one I haven't mentioned is them taking a grid average (on a regular grid in epsg:4326) instead of a "cos(latitude)" weighted average. The effect is limited here on the equator, but could be significant for other areas.
November 12, 2025 at 12:48 PM
I'm sure there are many more issues, one I haven't mentioned is them taking a grid average (on a regular grid in epsg:4326) instead of a "cos(latitude)" weighted average. The effect is limited here on the equator, but could be significant for other areas.
I don't think those residuals impact the issues I raised above. But my attempts of course shouldn't be trusted either. They also do a lot of text-based I/O (reading/writing intermediates), I haven't fully chased the impact of that, but doubt it explains it.
November 12, 2025 at 12:48 PM
I don't think those residuals impact the issues I raised above. But my attempts of course shouldn't be trusted either. They also do a lot of text-based I/O (reading/writing intermediates), I haven't fully chased the impact of that, but doubt it explains it.
Here are the residuals (lower left) after replicating their SPEI24 as close as possible. It's close but not perfect, and the magnitude/pattern can't be just (blown up) numerical-precision/noise. Clearly I'm either overlooking or doing something wrong but I can't figure it out.

November 12, 2025 at 12:48 PM
Here are the residuals (lower left) after replicating their SPEI24 as close as possible. It's close but not perfect, and the magnitude/pattern can't be just (blown up) numerical-precision/noise. Clearly I'm either overlooking or doing something wrong but I can't figure it out.
Taking a monthly avg, applying PET (Thornthwaite), taking an area avg, and finally creating a rolling 24-month SPEI really muffles the impact of such outliers. Too much to see anything meaningful when I compare it with the SPEI24 that they share on KNMI's Climate Explorer.
November 12, 2025 at 12:48 PM
Taking a monthly avg, applying PET (Thornthwaite), taking an area avg, and finally creating a rolling 24-month SPEI really muffles the impact of such outliers. Too much to see anything meaningful when I compare it with the SPEI24 that they share on KNMI's Climate Explorer.
The Tmin & Tmax data shows clear outliers, sometimes a daily Tmin that is as low as -60°C (for the Horn of Africa!). Especially their "event year" 2022 contains a lot of bad data. Here's an example for a single location (no area/aoi average).

November 12, 2025 at 12:48 PM
The Tmin & Tmax data shows clear outliers, sometimes a daily Tmin that is as low as -60°C (for the Horn of Africa!). Especially their "event year" 2022 contains a lot of bad data. Here's an example for a single location (no area/aoi average).
One obvious issue that I haven't addressed myself is the terrible quality of the CPC temperature data. I also don't see them addressing it in any way (in the paper or code), but they could have of course altered the "raw" data from NOAA prior to reading it (they should, it's bad).
November 12, 2025 at 12:48 PM
One obvious issue that I haven't addressed myself is the terrible quality of the CPC temperature data. I also don't see them addressing it in any way (in the paper or code), but they could have of course altered the "raw" data from NOAA prior to reading it (they should, it's bad).
Regarding some loose ends. While their code captures the gist of their analysis, the repo doesn't exactly match the publication. Perhaps their code changed, maybe a 3rd party library changed (there's no versioning). Maybe the inputs (NOAA PSL's CPC data) changed?
November 12, 2025 at 12:48 PM
Regarding some loose ends. While their code captures the gist of their analysis, the repo doesn't exactly match the publication. Perhaps their code changed, maybe a 3rd party library changed (there's no versioning). Maybe the inputs (NOAA PSL's CPC data) changed?
It seems a self-fulfilling prophecy, double counting the impact of climate change, which manifests itself specifically in the local temperature that's already used for SPEI-24. What's the added value of again regressing that with GMST? Of course there's a correlation.
November 12, 2025 at 12:48 PM
It seems a self-fulfilling prophecy, double counting the impact of climate change, which manifests itself specifically in the local temperature that's already used for SPEI-24. What's the added value of again regressing that with GMST? Of course there's a correlation.
Tangent; I don't get the point of using something that's already effectively *only* a (hyper)sensitive function of local temperature (Thornthwaite + no rainfall trend), regress this with GMST to amplify what was already a probability (the SPEI-24)!?
November 12, 2025 at 12:48 PM
Tangent; I don't get the point of using something that's already effectively *only* a (hyper)sensitive function of local temperature (Thornthwaite + no rainfall trend), regress this with GMST to amplify what was already a probability (the SPEI-24)!?
And the same for the probability-ratio (figure 6b).
November 12, 2025 at 12:48 PM
And the same for the probability-ratio (figure 6b).
The SPEI24 regression with GMST and the subsequent probability ration plot change as follows. Note that I don't exactly replicate their claimed 5500x pr-ratio, there are some loose ends but it's pretty close.
With my fix the pr-ratio drops to around ~400x.
Their Fig 6a:
With my fix the pr-ratio drops to around ~400x.
Their Fig 6a:
November 12, 2025 at 12:48 PM
The SPEI24 regression with GMST and the subsequent probability ration plot change as follows. Note that I don't exactly replicate their claimed 5500x pr-ratio, there are some loose ends but it's pretty close.
With my fix the pr-ratio drops to around ~400x.
Their Fig 6a:
With my fix the pr-ratio drops to around ~400x.
Their Fig 6a:
Back to the paper. Fixing all the above significantly impacts the SPEI calculations, that only applies to the CPC data. I'll only show their 24-month runs btw, the MAM & OND seasonal precipitation stuff is basically the same methodology with less data. It'll suffer in similar ways.
November 12, 2025 at 12:48 PM
Back to the paper. Fixing all the above significantly impacts the SPEI calculations, that only applies to the CPC data. I'll only show their 24-month runs btw, the MAM & OND seasonal precipitation stuff is basically the same methodology with less data. It'll suffer in similar ways.
The automagic unit conversion they use defines a month as 30.4375 days. The Pint package is otherwise pretty cool, but not PEBKAC proof. They make their input avg temperature using calendar months, so it's clearly incorrect even when arguing that calendar months are also awkward.

November 12, 2025 at 12:48 PM
The automagic unit conversion they use defines a month as 30.4375 days. The Pint package is otherwise pretty cool, but not PEBKAC proof. They make their input avg temperature using calendar months, so it's clearly incorrect even when arguing that calendar months are also awkward.
My attempt was consistently ~0.9856x lower, each month. But when converting it into a "days-equivalent" in their (incorrect) 30-day amount that became 30.4375 which finally made it click, recognizing the value being 365.25 days/year divided by 12 months.

November 12, 2025 at 12:48 PM
My attempt was consistently ~0.9856x lower, each month. But when converting it into a "days-equivalent" in their (incorrect) 30-day amount that became 30.4375 which finally made it click, recognizing the value being 365.25 days/year divided by 12 months.
The amount (mm) is "changed" to a rate in mm/day by dividing with the (calendar!) days in the month. This is converted to kg/m2/s and then finally converted back to mm/month (yes really...). What snuck up to me was the issue with this last conversion.
November 12, 2025 at 12:48 PM
The amount (mm) is "changed" to a rate in mm/day by dividing with the (calendar!) days in the month. This is converted to kg/m2/s and then finally converted back to mm/month (yes really...). What snuck up to me was the issue with this last conversion.
The first mistake is to assign this 30-day amount (in mm) to the calendar month. I initially thought that was it after skimming the code, it gets worse. They proceed with a rollercoaster of unit conversions that will knock your socks off.
November 12, 2025 at 12:48 PM
The first mistake is to assign this 30-day amount (in mm) to the calendar month. I initially thought that was it after skimming the code, it gets worse. They proceed with a rollercoaster of unit conversions that will knock your socks off.
It's clear that the equations from Thornthwaite result in a value that represents 30 days of 12 hours of daylight. The daylight correction in Kimutai et al 2025 is fine, but they mess up the correction for the length of the month in a very strange way.
November 12, 2025 at 12:48 PM
It's clear that the equations from Thornthwaite result in a value that represents 30 days of 12 hours of daylight. The daylight correction in Kimutai et al 2025 is fine, but they mess up the correction for the length of the month in a very strange way.
Another issue is the incorrect adjustment for the length of the month. (See also Willmott's definition at the bottom of the earlier image). Thornthwaite was also crystal clear on how this is done.
Clipping latitude >-50° & <50° as Thornthwaite prescribes isn't relevant here.
Clipping latitude >-50° & <50° as Thornthwaite prescribes isn't relevant here.

November 12, 2025 at 12:48 PM
Another issue is the incorrect adjustment for the length of the month. (See also Willmott's definition at the bottom of the earlier image). Thornthwaite was also crystal clear on how this is done.
Clipping latitude >-50° & <50° as Thornthwaite prescribes isn't relevant here.
Clipping latitude >-50° & <50° as Thornthwaite prescribes isn't relevant here.
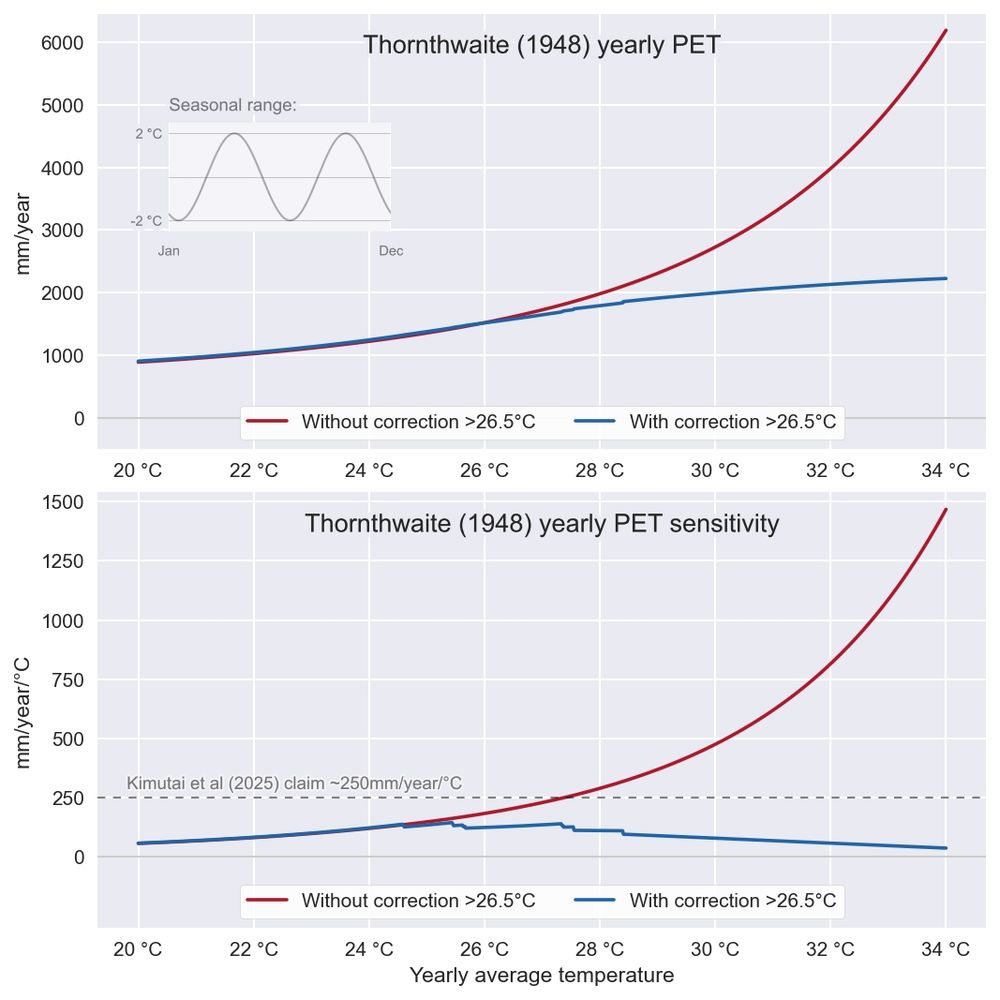
The recent (~15 years) surge in interest to use Thornthwaite ('48) within climate science is very odd to me, my best guess of its appeal is this unrealistic sensitivity with warming, guaranteeing "a result". A correct implementation would decrease this incentive significantly.
November 12, 2025 at 12:48 PM
The recent (~15 years) surge in interest to use Thornthwaite ('48) within climate science is very odd to me, my best guess of its appeal is this unrealistic sensitivity with warming, guaranteeing "a result". A correct implementation would decrease this incentive significantly.
Some people use Thornthwaite's table (his Fig 13) as a LUT that somehow gets interpolated. The more pragmatic approach would be to use the polynomial fit (eq 10 below) from Willmott et al (1985), but not above 38°C.

November 12, 2025 at 12:48 PM
Some people use Thornthwaite's table (his Fig 13) as a LUT that somehow gets interpolated. The more pragmatic approach would be to use the polynomial fit (eq 10 below) from Willmott et al (1985), but not above 38°C.
It's only a function of temperature so it's relatively easy to explore this sensitivity. The example sensitivity below uses a (hypothetical) double sine for the seasonal temperature range, common at the equator. It's low amplitude anyway so it won't matter much.
November 12, 2025 at 12:48 PM
It's only a function of temperature so it's relatively easy to explore this sensitivity. The example sensitivity below uses a (hypothetical) double sine for the seasonal temperature range, common at the equator. It's low amplitude anyway so it won't matter much.