


Rutger
@rutje.bsky.social
Since @knmi.nl & friends ( @utrechtuniversity.bsky.social, @icrc.org etc.) still refuse to address the issues with their work, let's revisit it once more. I've done this before focussing on what I think is the main conceptual error, but apparently that didn't resonate.
November 12, 2025 at 12:48 PM
Since @knmi.nl & friends ( @utrechtuniversity.bsky.social, @icrc.org etc.) still refuse to address the issues with their work, let's revisit it once more. I've done this before focussing on what I think is the main conceptual error, but apparently that didn't resonate.
Reposted by Rutger

"Where were you when I needed you?"
Climate scientist Jos de Laat on the DOE CWG and the biases of the climate beat
rogerpielkejr.substack.com/p/where-were...
Climate scientist Jos de Laat on the DOE CWG and the biases of the climate beat
rogerpielkejr.substack.com/p/where-were...

August 18, 2025 at 3:44 PM
"Where were you when I needed you?"
Climate scientist Jos de Laat on the DOE CWG and the biases of the climate beat
rogerpielkejr.substack.com/p/where-were...
Climate scientist Jos de Laat on the DOE CWG and the biases of the climate beat
rogerpielkejr.substack.com/p/where-were...
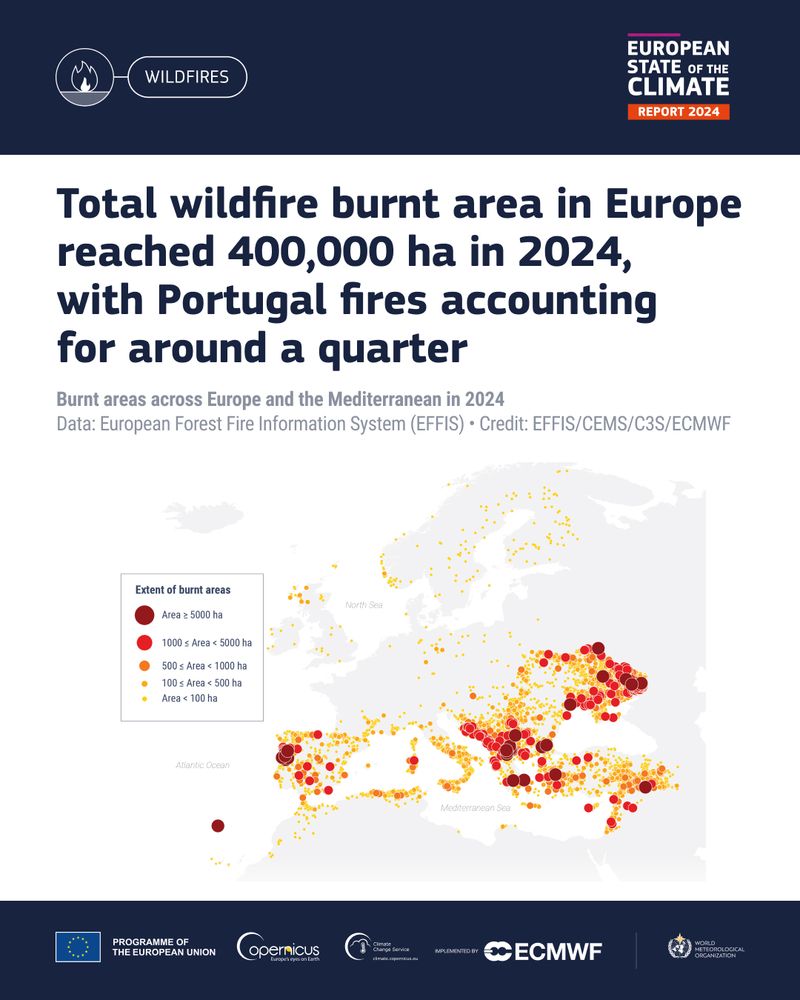
This map really had me puzzled, I initially thought there's no way Portugal makes up a quarter. And that was before reading the post which mentions just the fires in September in Portugal make up a quarter of Europe's total for 2024.

In 2024, Europe saw average to slightly above-average fire danger for most of the year, with the highest values in September. Around 110,000 hectares burnt in Portugal that month, accounting for around a quarter of the overall total burnt area in Europe for the year. bit.ly/4ctJySA #ESOTC2024 #C3S
May 21, 2025 at 2:24 PM
This map really had me puzzled, I initially thought there's no way Portugal makes up a quarter. And that was before reading the post which mentions just the fires in September in Portugal make up a quarter of Europe's total for 2024.
The soil texture is often simplified by expressing it as fractions of clay, silt & sand. Since these sum to 100% a ternary plot can be used to easily visualise the 3 dimensions in a 2D chart. Any boundaries are somewhat subjective of course, shown here is the common USDA method:

May 1, 2025 at 10:10 AM
The soil texture is often simplified by expressing it as fractions of clay, silt & sand. Since these sum to 100% a ternary plot can be used to easily visualise the 3 dimensions in a 2D chart. Any boundaries are somewhat subjective of course, shown here is the common USDA method:
Reposted by Rutger
Her methodology is absolutely terrible, it's depressing to see how few climate scientists or hydrologists are willing to speak out against it. It strikes me as activism over science.
April 20, 2025 at 7:22 AM
Her methodology is absolutely terrible, it's depressing to see how few climate scientists or hydrologists are willing to speak out against it. It strikes me as activism over science.
The average precipitation (119mm) over Spain was the 2nd highest after 2013 for March in this CHIRPS dataset (since 1981). In the past decade the years 2018 (116mm), 2022 (115mm) & 2024 (106mm) had similar amounts for March.


April 17, 2025 at 12:04 PM
The average precipitation (119mm) over Spain was the 2nd highest after 2013 for March in this CHIRPS dataset (since 1981). In the past decade the years 2018 (116mm), 2022 (115mm) & 2024 (106mm) had similar amounts for March.
Reposted by Rutger
Yes, often it's used in the absence of actual values, sometimes people don't even seem to realise the difference. It really depends how you define potential though and at what (spatial scale), which is all over the place in scientific literature.
March 31, 2025 at 8:36 AM
Yes, often it's used in the absence of actual values, sometimes people don't even seem to realise the difference. It really depends how you define potential though and at what (spatial scale), which is all over the place in scientific literature.

The precipitation anomaly for May till September, which usually covers the bulk of the West African monsoon.
It really highlights this season's anomalous northward displacement of the ITCZ (Intertropical Convergence Zone).
It really highlights this season's anomalous northward displacement of the ITCZ (Intertropical Convergence Zone).


November 11, 2024 at 11:04 AM
The precipitation anomaly for May till September, which usually covers the bulk of the West African monsoon.
It really highlights this season's anomalous northward displacement of the ITCZ (Intertropical Convergence Zone).
It really highlights this season's anomalous northward displacement of the ITCZ (Intertropical Convergence Zone).