


Rutger
@rutje.bsky.social
Here's what @bobkopp.net & @pammcelwee.bsky.social say about it on the website of @ruclimateenergy.bsky.social, at:
rcei.rutgers.edu/climate-expe...
rcei.rutgers.edu/climate-expe...

November 13, 2025 at 8:21 AM
Here's what @bobkopp.net & @pammcelwee.bsky.social say about it on the website of @ruclimateenergy.bsky.social, at:
rcei.rutgers.edu/climate-expe...
rcei.rutgers.edu/climate-expe...
Here are the residuals (lower left) after replicating their SPEI24 as close as possible. It's close but not perfect, and the magnitude/pattern can't be just (blown up) numerical-precision/noise. Clearly I'm either overlooking or doing something wrong but I can't figure it out.

November 12, 2025 at 12:48 PM
Here are the residuals (lower left) after replicating their SPEI24 as close as possible. It's close but not perfect, and the magnitude/pattern can't be just (blown up) numerical-precision/noise. Clearly I'm either overlooking or doing something wrong but I can't figure it out.
The Tmin & Tmax data shows clear outliers, sometimes a daily Tmin that is as low as -60°C (for the Horn of Africa!). Especially their "event year" 2022 contains a lot of bad data. Here's an example for a single location (no area/aoi average).

November 12, 2025 at 12:48 PM
The Tmin & Tmax data shows clear outliers, sometimes a daily Tmin that is as low as -60°C (for the Horn of Africa!). Especially their "event year" 2022 contains a lot of bad data. Here's an example for a single location (no area/aoi average).
And the same for the probability-ratio (figure 6b).
November 12, 2025 at 12:48 PM
And the same for the probability-ratio (figure 6b).
The SPEI24 regression with GMST and the subsequent probability ration plot change as follows. Note that I don't exactly replicate their claimed 5500x pr-ratio, there are some loose ends but it's pretty close.
With my fix the pr-ratio drops to around ~400x.
Their Fig 6a:
With my fix the pr-ratio drops to around ~400x.
Their Fig 6a:
November 12, 2025 at 12:48 PM
The SPEI24 regression with GMST and the subsequent probability ration plot change as follows. Note that I don't exactly replicate their claimed 5500x pr-ratio, there are some loose ends but it's pretty close.
With my fix the pr-ratio drops to around ~400x.
Their Fig 6a:
With my fix the pr-ratio drops to around ~400x.
Their Fig 6a:
The automagic unit conversion they use defines a month as 30.4375 days. The Pint package is otherwise pretty cool, but not PEBKAC proof. They make their input avg temperature using calendar months, so it's clearly incorrect even when arguing that calendar months are also awkward.

November 12, 2025 at 12:48 PM
The automagic unit conversion they use defines a month as 30.4375 days. The Pint package is otherwise pretty cool, but not PEBKAC proof. They make their input avg temperature using calendar months, so it's clearly incorrect even when arguing that calendar months are also awkward.
My attempt was consistently ~0.9856x lower, each month. But when converting it into a "days-equivalent" in their (incorrect) 30-day amount that became 30.4375 which finally made it click, recognizing the value being 365.25 days/year divided by 12 months.

November 12, 2025 at 12:48 PM
My attempt was consistently ~0.9856x lower, each month. But when converting it into a "days-equivalent" in their (incorrect) 30-day amount that became 30.4375 which finally made it click, recognizing the value being 365.25 days/year divided by 12 months.
Another issue is the incorrect adjustment for the length of the month. (See also Willmott's definition at the bottom of the earlier image). Thornthwaite was also crystal clear on how this is done.
Clipping latitude >-50° & <50° as Thornthwaite prescribes isn't relevant here.
Clipping latitude >-50° & <50° as Thornthwaite prescribes isn't relevant here.

November 12, 2025 at 12:48 PM
Another issue is the incorrect adjustment for the length of the month. (See also Willmott's definition at the bottom of the earlier image). Thornthwaite was also crystal clear on how this is done.
Clipping latitude >-50° & <50° as Thornthwaite prescribes isn't relevant here.
Clipping latitude >-50° & <50° as Thornthwaite prescribes isn't relevant here.
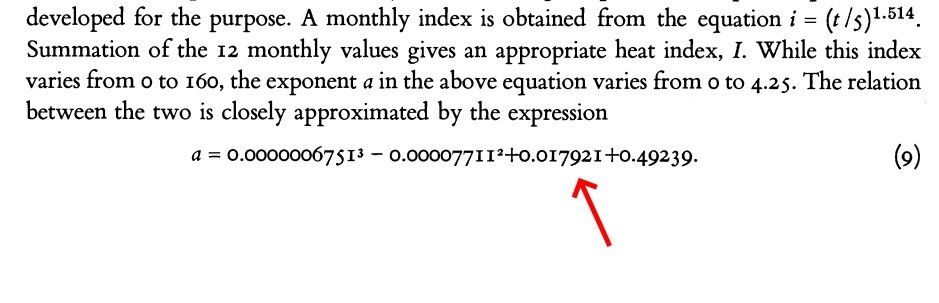
Some people use Thornthwaite's table (his Fig 13) as a LUT that somehow gets interpolated. The more pragmatic approach would be to use the polynomial fit (eq 10 below) from Willmott et al (1985), but not above 38°C.

November 12, 2025 at 12:48 PM
Some people use Thornthwaite's table (his Fig 13) as a LUT that somehow gets interpolated. The more pragmatic approach would be to use the polynomial fit (eq 10 below) from Willmott et al (1985), but not above 38°C.
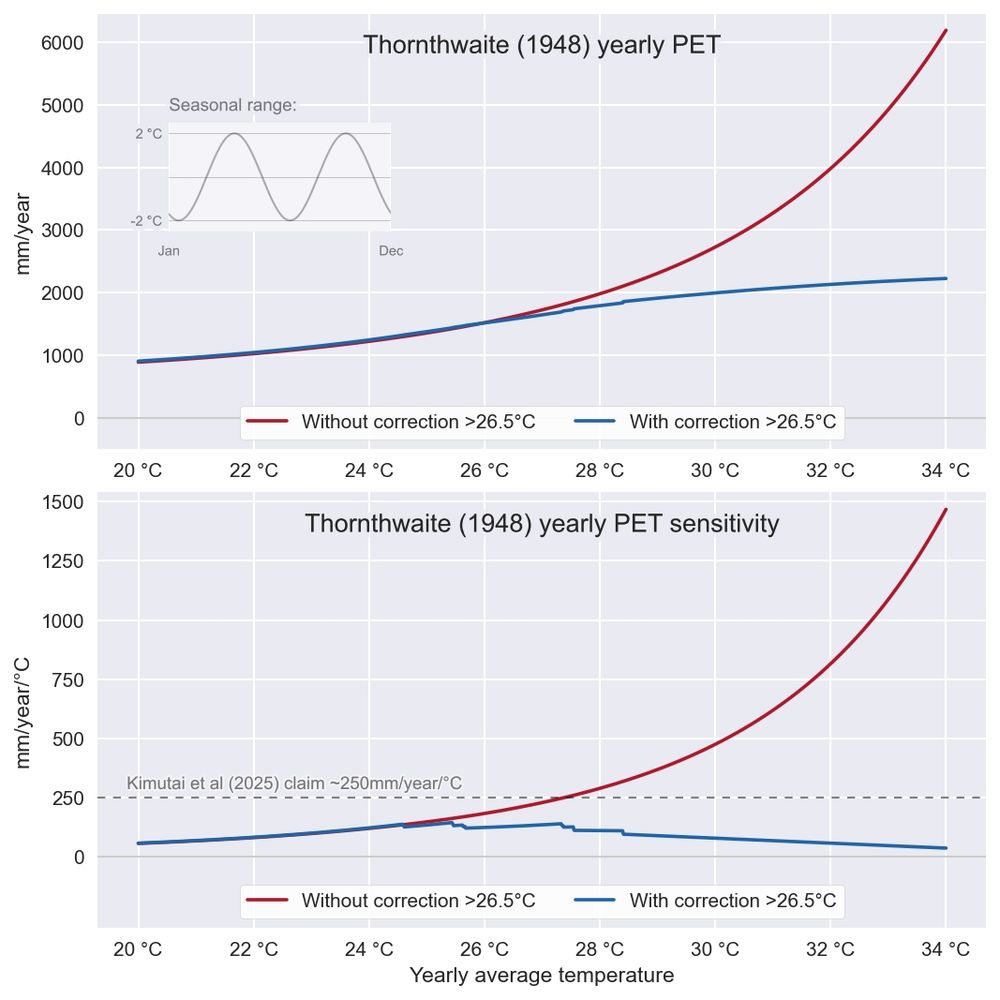
It's only a function of temperature so it's relatively easy to explore this sensitivity. The example sensitivity below uses a (hypothetical) double sine for the seasonal temperature range, common at the equator. It's low amplitude anyway so it won't matter much.
November 12, 2025 at 12:48 PM
It's only a function of temperature so it's relatively easy to explore this sensitivity. The example sensitivity below uses a (hypothetical) double sine for the seasonal temperature range, common at the equator. It's low amplitude anyway so it won't matter much.
Much worse is the omission of the required correction for temperatures over 26.5°C. Thornthwaite is crystal clear about that, it's not optional. This is highly relevant in areas like the Horn of Africa (their aoi) because the uncorrected equation completely blows up above this.

November 12, 2025 at 12:48 PM
Much worse is the omission of the required correction for temperatures over 26.5°C. Thornthwaite is crystal clear about that, it's not optional. This is highly relevant in areas like the Horn of Africa (their aoi) because the uncorrected equation completely blows up above this.
A curious error is the change in one of the coefficients in the equation that calculates the "a exponent". The original Thornthwaite (1948) paper they reference uses "0.01792" but their implementation "0.01791".
That won't change the result much, perhaps an honest mistake.
That won't change the result much, perhaps an honest mistake.

November 12, 2025 at 12:48 PM
A curious error is the change in one of the coefficients in the equation that calculates the "a exponent". The original Thornthwaite (1948) paper they reference uses "0.01792" but their implementation "0.01791".
That won't change the result much, perhaps an honest mistake.
That won't change the result much, perhaps an honest mistake.
The text in their publication isn't worth reading for the most part, but the way they spin the diverging sign between the two datasets they use does provide a nice insight into how scientific publications are written.
The more obvious explanation is of course this error. 🤦♂️
The more obvious explanation is of course this error. 🤦♂️

November 12, 2025 at 12:48 PM
The text in their publication isn't worth reading for the most part, but the way they spin the diverging sign between the two datasets they use does provide a nice insight into how scientific publications are written.
The more obvious explanation is of course this error. 🤦♂️
The more obvious explanation is of course this error. 🤦♂️
And the matching probability-ratio.
November 12, 2025 at 12:48 PM
And the matching probability-ratio.
Fixing this flips the sign of the regression,but unsurprisingly remains insignificant. It's an odd choice to think that global temp (but not local?) captures the influence of climate change on local weather. The causality of an aggregation to global obviously acts the other way.
November 12, 2025 at 12:48 PM
Fixing this flips the sign of the regression,but unsurprisingly remains insignificant. It's an odd choice to think that global temp (but not local?) captures the influence of climate change on local weather. The causality of an aggregation to global obviously acts the other way.
Their method of smoothing is a little awkward for real-time applications (the context it's used). It's a 4-year centered average and assigned to the 3rd year. For 2022 (the "event") that means it's the average of only 2020, 2021, 2022 ignoring 2023 (not available real-time).

November 12, 2025 at 12:48 PM
Their method of smoothing is a little awkward for real-time applications (the context it's used). It's a 4-year centered average and assigned to the 3rd year. For 2022 (the "event") that means it's the average of only 2020, 2021, 2022 ignoring 2023 (not available real-time).
Oopsie. They managed to take the absolute value of the GMST anomaly. Maybe sliced off the sign reading NASA's "fixed width" format? Maybe something else?
The amount of txt-based numbers/dates within climate science is wild, formats like parquet/arrow have been around for a while.
The amount of txt-based numbers/dates within climate science is wild, formats like parquet/arrow have been around for a while.

November 12, 2025 at 12:48 PM
Oopsie. They managed to take the absolute value of the GMST anomaly. Maybe sliced off the sign reading NASA's "fixed width" format? Maybe something else?
The amount of txt-based numbers/dates within climate science is wild, formats like parquet/arrow have been around for a while.
The amount of txt-based numbers/dates within climate science is wild, formats like parquet/arrow have been around for a while.
To ease into it, look at their Fig 5c & 5d, I'll reference the 2025 figures but you can find the same in the '23 report with different numbers.
Here's the publication:
doi.org/10.1016/j.wa...
Here's the publication:
doi.org/10.1016/j.wa...

November 12, 2025 at 12:48 PM
To ease into it, look at their Fig 5c & 5d, I'll reference the 2025 figures but you can find the same in the '23 report with different numbers.
Here's the publication:
doi.org/10.1016/j.wa...
Here's the publication:
doi.org/10.1016/j.wa...
Their text changed slightly, for the worse. Adding references like Jensen et al (1990) implies they've received the feedback on their '23 report, from myself or others, yet choose to dismiss it. Even though it succinctly spells out the main issue with their entire premise.
Jensen et al (1990):
Jensen et al (1990):

November 12, 2025 at 12:48 PM
Their text changed slightly, for the worse. Adding references like Jensen et al (1990) implies they've received the feedback on their '23 report, from myself or others, yet choose to dismiss it. Even though it succinctly spells out the main issue with their entire premise.
Jensen et al (1990):
Jensen et al (1990):
The publications Kimutai et al 2023 (initial WWA report) and subsequent Kimutai et al '25 ( @elsevierconnect.bsky.social 's WACE) are especially egregious. Strangely enough the analysis doesn't seem to have changed at all, despite 15 months of that peer-review I've heard so much about.

November 12, 2025 at 12:48 PM
The publications Kimutai et al 2023 (initial WWA report) and subsequent Kimutai et al '25 ( @elsevierconnect.bsky.social 's WACE) are especially egregious. Strangely enough the analysis doesn't seem to have changed at all, despite 15 months of that peer-review I've heard so much about.
I would be interested in comparing the difference in for example the surface energy balance between the models. Often issues with one will backfire inversely in the forced one. But the source they reference in the paper requires authorisation which is a strange choice to say the least.


September 8, 2025 at 6:26 AM
I would be interested in comparing the difference in for example the surface energy balance between the models. Often issues with one will backfire inversely in the forced one. But the source they reference in the paper requires authorisation which is a strange choice to say the least.
The arguments and citations you and your co-authors use in this rebuttal fit exactly what you accuse others of.
To use such language and accusations only to then proceed to do the same yourself is such a bad look. What's the point of dragging climate science into such a tribal state?
To use such language and accusations only to then proceed to do the same yourself is such a bad look. What's the point of dragging climate science into such a tribal state?

September 5, 2025 at 5:52 AM
The arguments and citations you and your co-authors use in this rebuttal fit exactly what you accuse others of.
To use such language and accusations only to then proceed to do the same yourself is such a bad look. What's the point of dragging climate science into such a tribal state?
To use such language and accusations only to then proceed to do the same yourself is such a bad look. What's the point of dragging climate science into such a tribal state?
Again, what will it take for you to correct this? You & your co-authors go around accusing the DOE of propaganda, cherry picking & fraud. Why not as a minimum apply the same standards to yourself? So many of these 85 self proclaimed experts were aware of these issues, and you still go ahead with it.


September 5, 2025 at 5:21 AM
Again, what will it take for you to correct this? You & your co-authors go around accusing the DOE of propaganda, cherry picking & fraud. Why not as a minimum apply the same standards to yourself? So many of these 85 self proclaimed experts were aware of these issues, and you still go ahead with it.
Jensen et al 1990 already 35 years ago succinctly summerized it's use & abuse by scientists. You're not just repeating that to this day but making it much worse by introducing these implementation errors.
September 4, 2025 at 7:28 AM
Jensen et al 1990 already 35 years ago succinctly summerized it's use & abuse by scientists. You're not just repeating that to this day but making it much worse by introducing these implementation errors.
Thornthwaite himself already cautioned against doing this in the original 1948 paper. Don't just extrapolate the highly empirical fit to a hyperarid area during a drought.
And he was clear about how to handle temperatures above 26.5°C, that's not optional. Without it the sensitivity explodes....
And he was clear about how to handle temperatures above 26.5°C, that's not optional. Without it the sensitivity explodes....

September 4, 2025 at 7:28 AM
Thornthwaite himself already cautioned against doing this in the original 1948 paper. Don't just extrapolate the highly empirical fit to a hyperarid area during a drought.
And he was clear about how to handle temperatures above 26.5°C, that's not optional. Without it the sensitivity explodes....
And he was clear about how to handle temperatures above 26.5°C, that's not optional. Without it the sensitivity explodes....