


Peter Brent
@peterbrent.bsky.social
Elections, electoral behaviour, electoral admin and Related Matters.
Based on a true story.
Based on a true story.
Guy makes fair points, arrest was OTT, but also he does seem to have gone troppo.🤪

September 23, 2025 at 7:29 AM
Guy makes fair points, arrest was OTT, but also he does seem to have gone troppo.🤪
From the democracy index.
See column headings.
See column headings.

August 8, 2025 at 12:15 AM
From the democracy index.
See column headings.
See column headings.
So what happened was I used
@TheEconomist 's democracy index & @Int_IDEA's Model of Electoral Management database to produce table below.
In theory, independent (generally commissions, eg AEC) is best model, rather than govt dept. So what's the deal with numbers below?
Well...1/2
@TheEconomist 's democracy index & @Int_IDEA's Model of Electoral Management database to produce table below.
In theory, independent (generally commissions, eg AEC) is best model, rather than govt dept. So what's the deal with numbers below?
Well...1/2

August 8, 2025 at 12:02 AM
So what happened was I used
@TheEconomist 's democracy index & @Int_IDEA's Model of Electoral Management database to produce table below.
In theory, independent (generally commissions, eg AEC) is best model, rather than govt dept. So what's the deal with numbers below?
Well...1/2
@TheEconomist 's democracy index & @Int_IDEA's Model of Electoral Management database to produce table below.
In theory, independent (generally commissions, eg AEC) is best model, rather than govt dept. So what's the deal with numbers below?
Well...1/2
Blimey, the results overall are pretty stunning.
May 30, 2025 at 7:20 AM
Blimey, the results overall are pretty stunning.
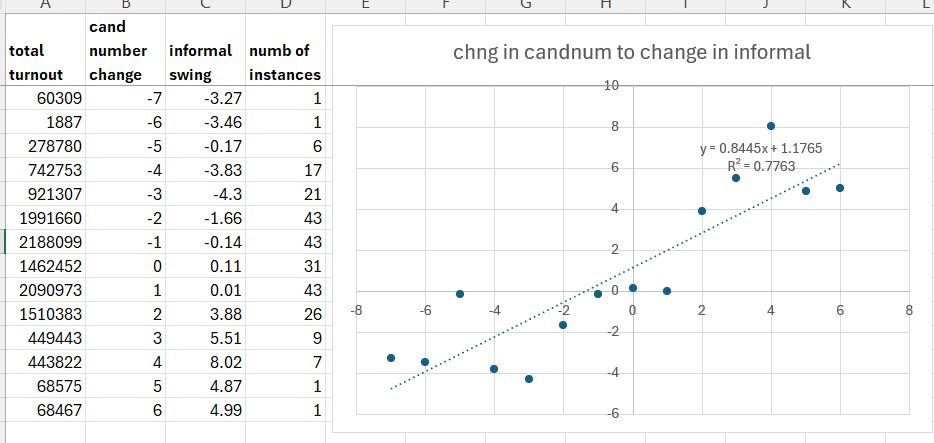
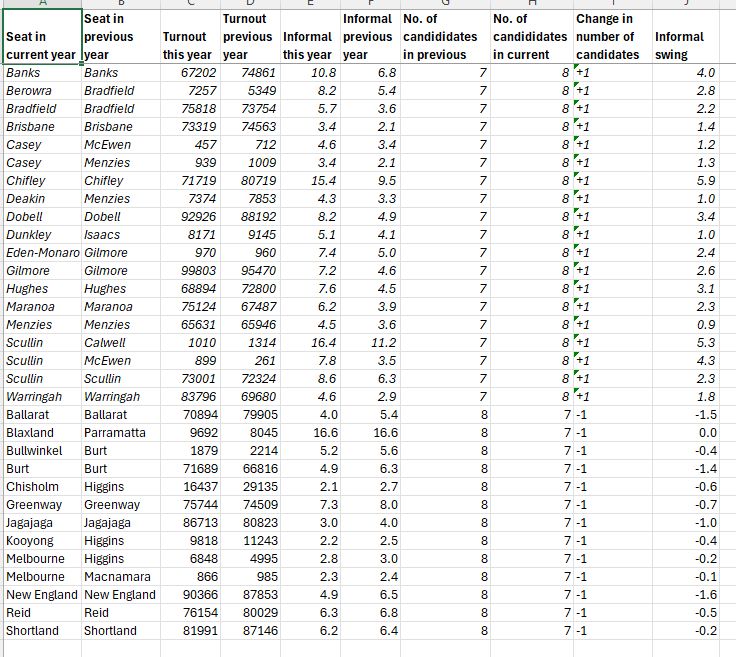
So, like, I took leafoutof @benraue.com's book, checking out relationship b/w change in no. of candidates& change in informal vote, but splitting seats into all variety of being part of one seat in 2022 & another in 2025.
Subset: changes from 7 cands to 8, & vice versa.
www.tallyroom.com.au/60644
Subset: changes from 7 cands to 8, & vice versa.
www.tallyroom.com.au/60644
May 30, 2025 at 2:21 AM
So, like, I took leafoutof @benraue.com's book, checking out relationship b/w change in no. of candidates& change in informal vote, but splitting seats into all variety of being part of one seat in 2022 & another in 2025.
Subset: changes from 7 cands to 8, & vice versa.
www.tallyroom.com.au/60644
Subset: changes from 7 cands to 8, & vice versa.
www.tallyroom.com.au/60644

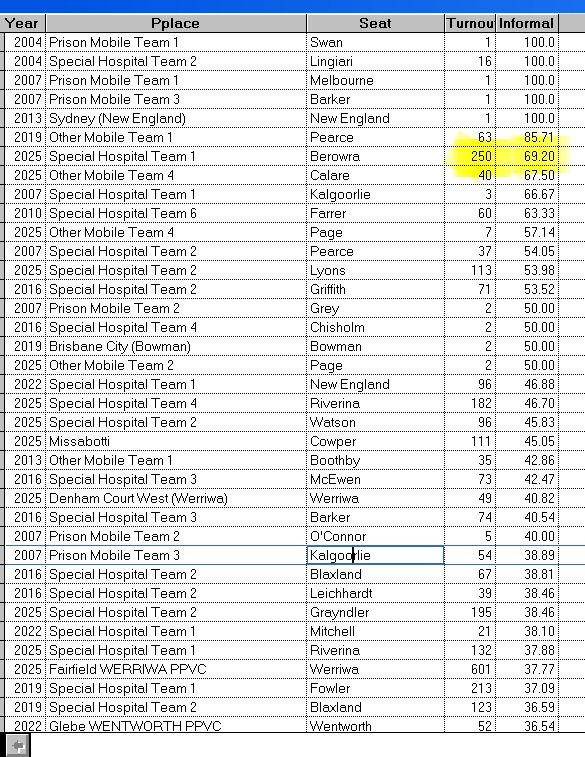
@benraue.com It is highly excellent, but what about Berowra special hospital, a standout across 2004-2025 with its meaningfully large turnout?
May 27, 2025 at 3:18 AM
@benraue.com It is highly excellent, but what about Berowra special hospital, a standout across 2004-2025 with its meaningfully large turnout?
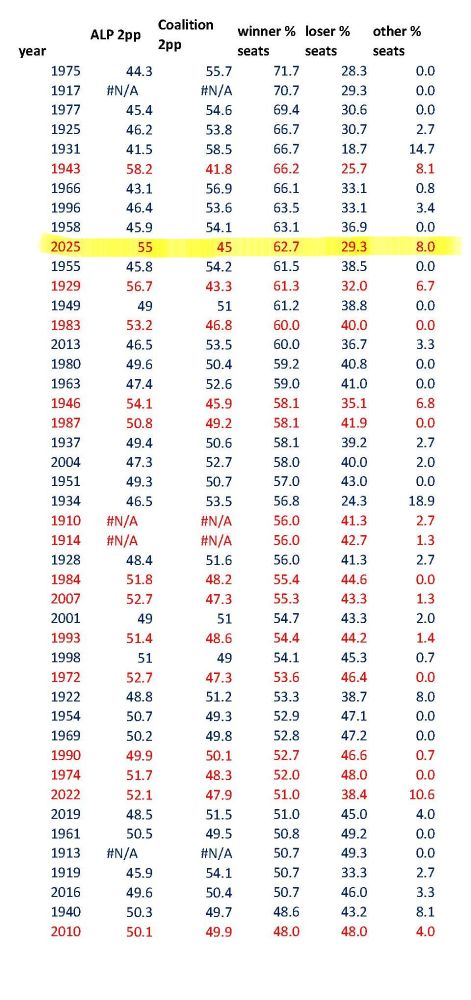
All federal elections 1910 (2pty system) to 2025* in decreasing order of winner % of HoR seats.
1975 a much bigger win than 2025, but similar % of seats for losing side. No crossbench back then.
* 2025 counting not final.
(Some incl in party totals early last century arguable)
1975 a much bigger win than 2025, but similar % of seats for losing side. No crossbench back then.
* 2025 counting not final.
(Some incl in party totals early last century arguable)
May 25, 2025 at 11:31 PM
All federal elections 1910 (2pty system) to 2025* in decreasing order of winner % of HoR seats.
1975 a much bigger win than 2025, but similar % of seats for losing side. No crossbench back then.
* 2025 counting not final.
(Some incl in party totals early last century arguable)
1975 a much bigger win than 2025, but similar % of seats for losing side. No crossbench back then.
* 2025 counting not final.
(Some incl in party totals early last century arguable)
Table 2004 - 2025 (as of current count): all seat results with .5% or lower margin. Three out of five for 2025 involve teals on the losing side.
If change it to 50.7 or less, would also include Fremantle (ALP 50.68 v teal).
😲
If change it to 50.7 or less, would also include Fremantle (ALP 50.68 v teal).
😲

May 19, 2025 at 12:24 AM
Table 2004 - 2025 (as of current count): all seat results with .5% or lower margin. Three out of five for 2025 involve teals on the losing side.
If change it to 50.7 or less, would also include Fremantle (ALP 50.68 v teal).
😲
If change it to 50.7 or less, would also include Fremantle (ALP 50.68 v teal).
😲
What happened was I used @benraue.com's notional post redistribution primary votes & 2cps & calculated 2025 Lib swings against teals.
Looks like Tim Wilson got biggest swing.
(Victoria was Libs' best primary swing state, so the top two unsurprising.)
Ben might have since tweaked numbers a little
Looks like Tim Wilson got biggest swing.
(Victoria was Libs' best primary swing state, so the top two unsurprising.)
Ben might have since tweaked numbers a little

May 17, 2025 at 5:26 AM
What happened was I used @benraue.com's notional post redistribution primary votes & 2cps & calculated 2025 Lib swings against teals.
Looks like Tim Wilson got biggest swing.
(Victoria was Libs' best primary swing state, so the top two unsurprising.)
Ben might have since tweaked numbers a little
Looks like Tim Wilson got biggest swing.
(Victoria was Libs' best primary swing state, so the top two unsurprising.)
Ben might have since tweaked numbers a little
Final Yougov MRP 2pp swings to actual swings (115 seats that are both actual and Yougov classics).
Not toooooo bad?
(Top right corner is Braddon.👍)
Not toooooo bad?
(Top right corner is Braddon.👍)

May 15, 2025 at 11:42 PM
Final Yougov MRP 2pp swings to actual swings (115 seats that are both actual and Yougov classics).
Not toooooo bad?
(Top right corner is Braddon.👍)
Not toooooo bad?
(Top right corner is Braddon.👍)
Table 2pp swings to ALP by state, in 2pps counted in 120 classic seats so far. Projected eventual 2pps rest on unrealistic assumption that swing is same in the 30 non-classics. Danger! swings will decline as more postals (& others) counted. (Turnout was 90% in 2022.)

May 11, 2025 at 1:23 AM
Table 2pp swings to ALP by state, in 2pps counted in 120 classic seats so far. Projected eventual 2pps rest on unrealistic assumption that swing is same in the 30 non-classics. Danger! swings will decline as more postals (& others) counted. (Turnout was 90% in 2022.)
Personal vote effects election 2025 - adjusted for state swings. (Count so far)

May 10, 2025 at 11:45 AM
Personal vote effects election 2025 - adjusted for state swings. (Count so far)
All the teal 2cps in 2025 as of current count, in decreasing order. This time three against ALP.
(I don't include the longer-term MPs in Indi and Mayo, even though they received financial backing.)
(I don't include the longer-term MPs in Indi and Mayo, even though they received financial backing.)

May 7, 2025 at 10:47 PM
All the teal 2cps in 2025 as of current count, in decreasing order. This time three against ALP.
(I don't include the longer-term MPs in Indi and Mayo, even though they received financial backing.)
(I don't include the longer-term MPs in Indi and Mayo, even though they received financial backing.)
Full history of Libs voters' preference flows in Grns v ALP 2cp counts.
For many years Libs routinely recommended, on HTV cards, Grns over ALP. From 2013 they've done the inverse. The effect has been huge
HTV cards definitely determined result in Batman 2016; probably in Wills 2016 & Melb 2010
For many years Libs routinely recommended, on HTV cards, Grns over ALP. From 2013 they've done the inverse. The effect has been huge
HTV cards definitely determined result in Batman 2016; probably in Wills 2016 & Melb 2010

April 29, 2025 at 10:06 PM
Full history of Libs voters' preference flows in Grns v ALP 2cp counts.
For many years Libs routinely recommended, on HTV cards, Grns over ALP. From 2013 they've done the inverse. The effect has been huge
HTV cards definitely determined result in Batman 2016; probably in Wills 2016 & Melb 2010
For many years Libs routinely recommended, on HTV cards, Grns over ALP. From 2013 they've done the inverse. The effect has been huge
HTV cards definitely determined result in Batman 2016; probably in Wills 2016 & Melb 2010
The non classic seats. See New England down the bottom, when On liked Tony Windsor.

April 29, 2025 at 8:07 AM
The non classic seats. See New England down the bottom, when On liked Tony Windsor.
One Nation preference flows to Coalition by seat
2004 - 2022
highest at top, and lowest at bottom (huge middle of the table cut out).
Just interesting, is all.
2004 - 2022
highest at top, and lowest at bottom (huge middle of the table cut out).
Just interesting, is all.

April 29, 2025 at 7:20 AM
One Nation preference flows to Coalition by seat
2004 - 2022
highest at top, and lowest at bottom (huge middle of the table cut out).
Just interesting, is all.
2004 - 2022
highest at top, and lowest at bottom (huge middle of the table cut out).
Just interesting, is all.
ALP wd gain 31 seats (so win govt with 81) but they only got 18.
All praise L/NP marginal seats campainers!
Does thesis hold generally?
Scatter graph has results since 1987.
Very pleasing!
Dots on or near x axis, pendulum worked perfectly. 2/n
All praise L/NP marginal seats campainers!
Does thesis hold generally?
Scatter graph has results since 1987.
Very pleasing!
Dots on or near x axis, pendulum worked perfectly. 2/n

April 12, 2025 at 12:53 AM
ALP wd gain 31 seats (so win govt with 81) but they only got 18.
All praise L/NP marginal seats campainers!
Does thesis hold generally?
Scatter graph has results since 1987.
Very pleasing!
Dots on or near x axis, pendulum worked perfectly. 2/n
All praise L/NP marginal seats campainers!
Does thesis hold generally?
Scatter graph has results since 1987.
Very pleasing!
Dots on or near x axis, pendulum worked perfectly. 2/n
Students to Dutton’s rescue.

March 20, 2025 at 2:50 AM
Students to Dutton’s rescue.
Many pollies would have simply lied in response to this question (perhaps claiming the first they knew of it was Sam Maiden's article).
Charlton's candidness shows he is:
a. Honest
b. Inexperienced
c. Naive
d. All of the above.
Today's webpoll, call us on 1300 8zghasef
smh.com.au/politics/fed...
Charlton's candidness shows he is:
a. Honest
b. Inexperienced
c. Naive
d. All of the above.
Today's webpoll, call us on 1300 8zghasef
smh.com.au/politics/fed...

February 27, 2025 at 11:42 PM
Many pollies would have simply lied in response to this question (perhaps claiming the first they knew of it was Sam Maiden's article).
Charlton's candidness shows he is:
a. Honest
b. Inexperienced
c. Naive
d. All of the above.
Today's webpoll, call us on 1300 8zghasef
smh.com.au/politics/fed...
Charlton's candidness shows he is:
a. Honest
b. Inexperienced
c. Naive
d. All of the above.
Today's webpoll, call us on 1300 8zghasef
smh.com.au/politics/fed...
Australia also punching below its weight as share of national income.

February 18, 2025 at 10:58 PM
Australia also punching below its weight as share of national income.
What happened was I plotted 2pp swings in Accent/Redbridge MRP last year and the just released Yougov MRP (in the 128 seats both had data for).
My take: they're kind of got similar-ish findings overall. I mean, it's not totally random.
My take: they're kind of got similar-ish findings overall. I mean, it's not totally random.

February 16, 2025 at 4:03 AM
What happened was I plotted 2pp swings in Accent/Redbridge MRP last year and the just released Yougov MRP (in the 128 seats both had data for).
My take: they're kind of got similar-ish findings overall. I mean, it's not totally random.
My take: they're kind of got similar-ish findings overall. I mean, it's not totally random.
afaik all major pollsters ask minor party/ind respondents for preferences, even if they don't publish 'em.
Most get income, age, etc.
I would lerv to see minor party data, like Newspoll's qtrly below, but perhaps for whole yr, split by which major party they say they'd preference
Most get income, age, etc.
I would lerv to see minor party data, like Newspoll's qtrly below, but perhaps for whole yr, split by which major party they say they'd preference

February 3, 2025 at 12:08 AM
afaik all major pollsters ask minor party/ind respondents for preferences, even if they don't publish 'em.
Most get income, age, etc.
I would lerv to see minor party data, like Newspoll's qtrly below, but perhaps for whole yr, split by which major party they say they'd preference
Most get income, age, etc.
I would lerv to see minor party data, like Newspoll's qtrly below, but perhaps for whole yr, split by which major party they say they'd preference
Y'know, once upon a time Newspoll quarterlies showed their final week (in previous election campaign) results broken down by age and gender.
These were imo the closest thing we in Oz had to decent published exit polls.
But no more ...
Very no good.
These were imo the closest thing we in Oz had to decent published exit polls.
But no more ...
Very no good.

January 28, 2025 at 10:05 PM
Y'know, once upon a time Newspoll quarterlies showed their final week (in previous election campaign) results broken down by age and gender.
These were imo the closest thing we in Oz had to decent published exit polls.
But no more ...
Very no good.
These were imo the closest thing we in Oz had to decent published exit polls.
But no more ...
Very no good.
Meaning no more “Take me to your leader”, a great podcast.😔

January 14, 2025 at 12:33 AM
Meaning no more “Take me to your leader”, a great podcast.😔