


The Overhang
@overhang-aonz.bsky.social
Structured vibes. Aotearoa-New Zealand political takes, with an analytical bent.
Shocking call but Andrew Little's going to be mayor.
Joining him should be:
🔴2-6 Labour councillors (med 5)
🟢2-5 Greens (3)
🟣0-4 Moderates (2)
🔵3-7 Conservatives (4)
🟡1-4 IT/ACT Locals (1)
Joining him should be:
🔴2-6 Labour councillors (med 5)
🟢2-5 Greens (3)
🟣0-4 Moderates (2)
🔵3-7 Conservatives (4)
🟡1-4 IT/ACT Locals (1)
October 9, 2025 at 7:18 PM
Shocking call but Andrew Little's going to be mayor.
Joining him should be:
🔴2-6 Labour councillors (med 5)
🟢2-5 Greens (3)
🟣0-4 Moderates (2)
🔵3-7 Conservatives (4)
🟡1-4 IT/ACT Locals (1)
Joining him should be:
🔴2-6 Labour councillors (med 5)
🟢2-5 Greens (3)
🟣0-4 Moderates (2)
🔵3-7 Conservatives (4)
🟡1-4 IT/ACT Locals (1)
Technical note: for councils with Māori wards, the general wards are general roll only, and the Māori wards are Māori roll. For councils without Māori wards the figures are all votes.
October 7, 2025 at 11:52 PM
Technical note: for councils with Māori wards, the general wards are general roll only, and the Māori wards are Māori roll. For councils without Māori wards the figures are all votes.
Not a 1:1 relationship with local govt voting given much lower turnout and fuzzier partisanship outside the main centres, but gives an overall vibe.
October 7, 2025 at 11:52 PM
Not a 1:1 relationship with local govt voting given much lower turnout and fuzzier partisanship outside the main centres, but gives an overall vibe.
This draws on the detailed (meshblock level) party vote estimates I'm using for the boundary adjustments work, but aggregated up to council ward level rather than new electorate level.
October 7, 2025 at 11:52 PM
This draws on the detailed (meshblock level) party vote estimates I'm using for the boundary adjustments work, but aggregated up to council ward level rather than new electorate level.
Note that Flat Bush was split off from the Botany local board subdivision, and subdivisions in Rodney were rearranged.
October 7, 2025 at 5:50 AM
Note that Flat Bush was split off from the Botany local board subdivision, and subdivisions in Rodney were rearranged.
Mixed back at a local board level, ranging from 29% in Warkworth to 14% in Flat Bush.
Waiheke (+7.5%) and Papatoetoe (+6%) most improved, with Manguawhau (-5.5%) and Kumeu (-6%) seeing the biggest falls
Waiheke (+7.5%) and Papatoetoe (+6%) most improved, with Manguawhau (-5.5%) and Kumeu (-6%) seeing the biggest falls

October 7, 2025 at 5:50 AM
Mixed back at a local board level, ranging from 29% in Warkworth to 14% in Flat Bush.
Waiheke (+7.5%) and Papatoetoe (+6%) most improved, with Manguawhau (-5.5%) and Kumeu (-6%) seeing the biggest falls
Waiheke (+7.5%) and Papatoetoe (+6%) most improved, with Manguawhau (-5.5%) and Kumeu (-6%) seeing the biggest falls
Pattern is fairly consistent across the wards, with all running significantly higher than 2022.
Wharangi/Onslow-Western both leading (with 25% back) and the most improved (+8% up).
Wharangi/Onslow-Western both leading (with 25% back) and the most improved (+8% up).

October 7, 2025 at 4:42 AM
Pattern is fairly consistent across the wards, with all running significantly higher than 2022.
Wharangi/Onslow-Western both leading (with 25% back) and the most improved (+8% up).
Wharangi/Onslow-Western both leading (with 25% back) and the most improved (+8% up).
Thanks. Took the most work to work out how to represent, trying to pack a lot in.
February 10, 2025 at 8:30 PM
Thanks. Took the most work to work out how to represent, trying to pack a lot in.
Very long way of saying "National might win the next election, but on the other hand they might not".
That uncertainty is the point.
That uncertainty is the point.
February 10, 2025 at 10:35 AM
Very long way of saying "National might win the next election, but on the other hand they might not".
That uncertainty is the point.
That uncertainty is the point.
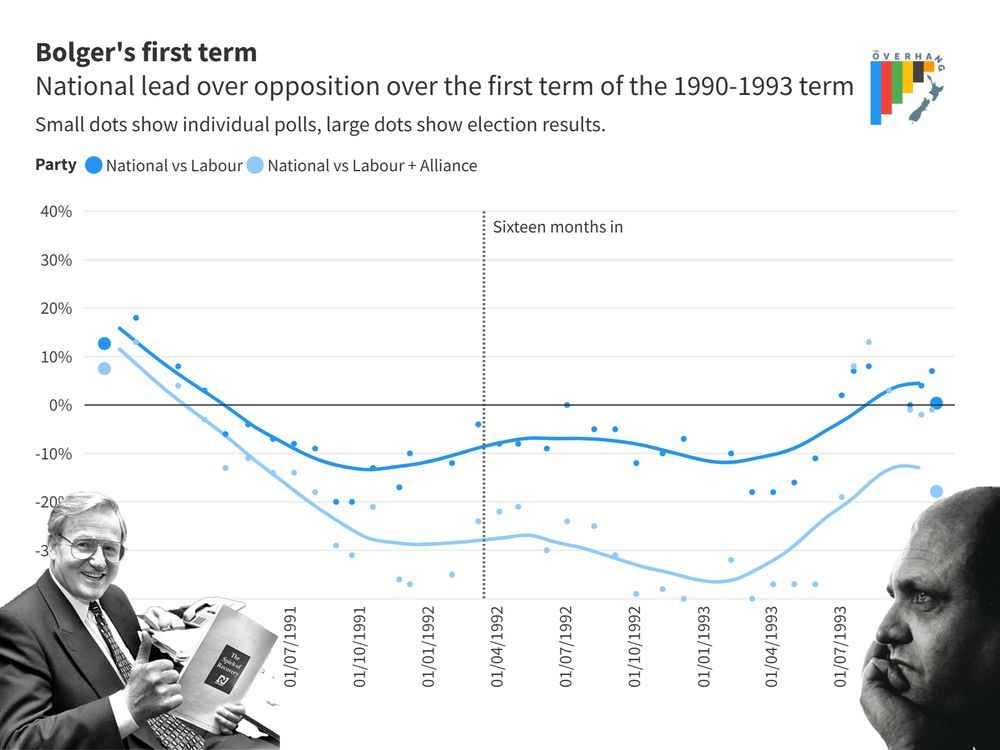
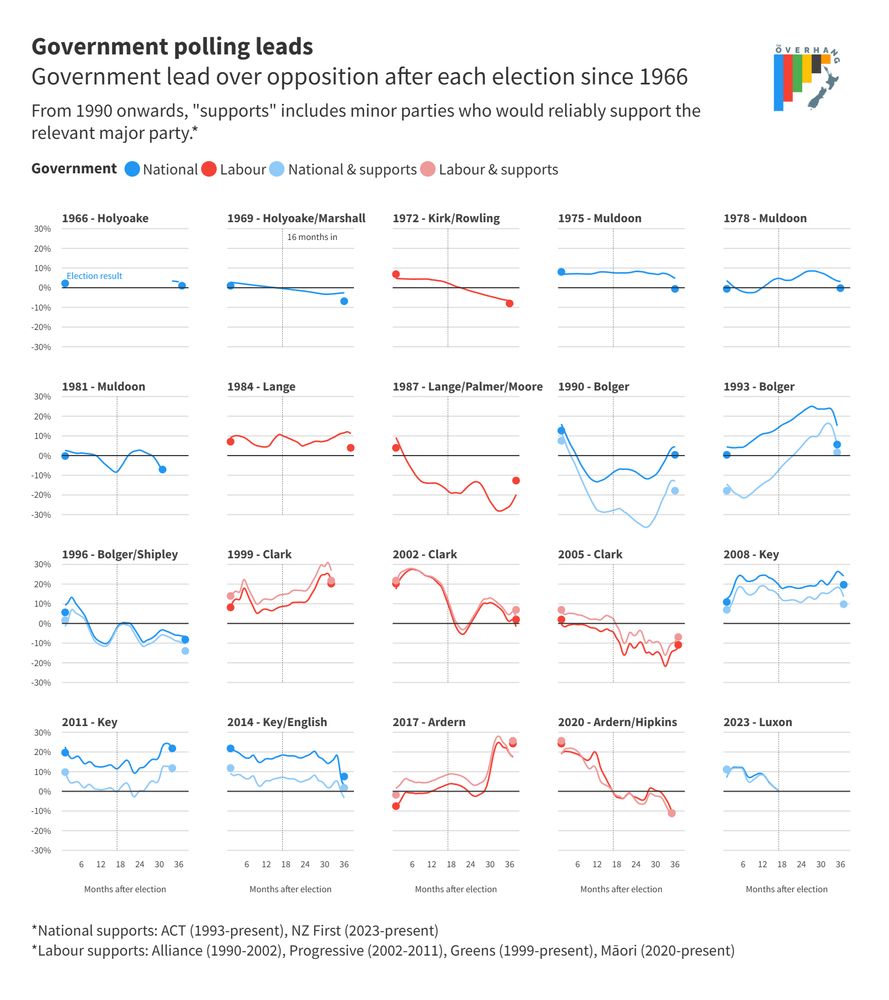
Using 1990-93 as a comparison, things look OK for National: they won in 93, and Luxon has a *much* smaller mountain to climb.
On the other hand, the distortions of FPP aren't there to lend a hand in beating off a fissile left.
On the other hand, the distortions of FPP aren't there to lend a hand in beating off a fissile left.
February 10, 2025 at 10:35 AM
Using 1990-93 as a comparison, things look OK for National: they won in 93, and Luxon has a *much* smaller mountain to climb.
On the other hand, the distortions of FPP aren't there to lend a hand in beating off a fissile left.
On the other hand, the distortions of FPP aren't there to lend a hand in beating off a fissile left.
Like these two examples, the current government is dealing with economic headwinds. Fortunately, they're not as bad (yet) as the 70s or 90s.
The leadership changes that sealed the 3LG's fate seem unlikely to repeat, with both Luxon and Hipkins seeming secure (and uh, healthy).
The leadership changes that sealed the 3LG's fate seem unlikely to repeat, with both Luxon and Hipkins seeming secure (and uh, healthy).
February 10, 2025 at 10:35 AM
Like these two examples, the current government is dealing with economic headwinds. Fortunately, they're not as bad (yet) as the 70s or 90s.
The leadership changes that sealed the 3LG's fate seem unlikely to repeat, with both Luxon and Hipkins seeming secure (and uh, healthy).
The leadership changes that sealed the 3LG's fate seem unlikely to repeat, with both Luxon and Hipkins seeming secure (and uh, healthy).
Moore looked certain to get a second go. But then he didn't.
Instead, Bolger made the mother of all comebacks and by the barest of margins (zero seats, with a speakership deal serving as the boundary countback) clung on in 1993.
Instead, Bolger made the mother of all comebacks and by the barest of margins (zero seats, with a speakership deal serving as the boundary countback) clung on in 1993.
February 10, 2025 at 10:35 AM
Moore looked certain to get a second go. But then he didn't.
Instead, Bolger made the mother of all comebacks and by the barest of margins (zero seats, with a speakership deal serving as the boundary countback) clung on in 1993.
Instead, Bolger made the mother of all comebacks and by the barest of margins (zero seats, with a speakership deal serving as the boundary countback) clung on in 1993.
Bolger started with an even more commanding 13% landslide over hospital-pass recipient Mike Moore.
The crash was harsher too.
By this point, amid economic strife and in the aftermath of the Mother of All Budgets, National had shed a 24 points to be -11 down on Moore's Labour.
The crash was harsher too.
By this point, amid economic strife and in the aftermath of the Mother of All Budgets, National had shed a 24 points to be -11 down on Moore's Labour.
February 10, 2025 at 10:35 AM
Bolger started with an even more commanding 13% landslide over hospital-pass recipient Mike Moore.
The crash was harsher too.
By this point, amid economic strife and in the aftermath of the Mother of All Budgets, National had shed a 24 points to be -11 down on Moore's Labour.
The crash was harsher too.
By this point, amid economic strife and in the aftermath of the Mother of All Budgets, National had shed a 24 points to be -11 down on Moore's Labour.
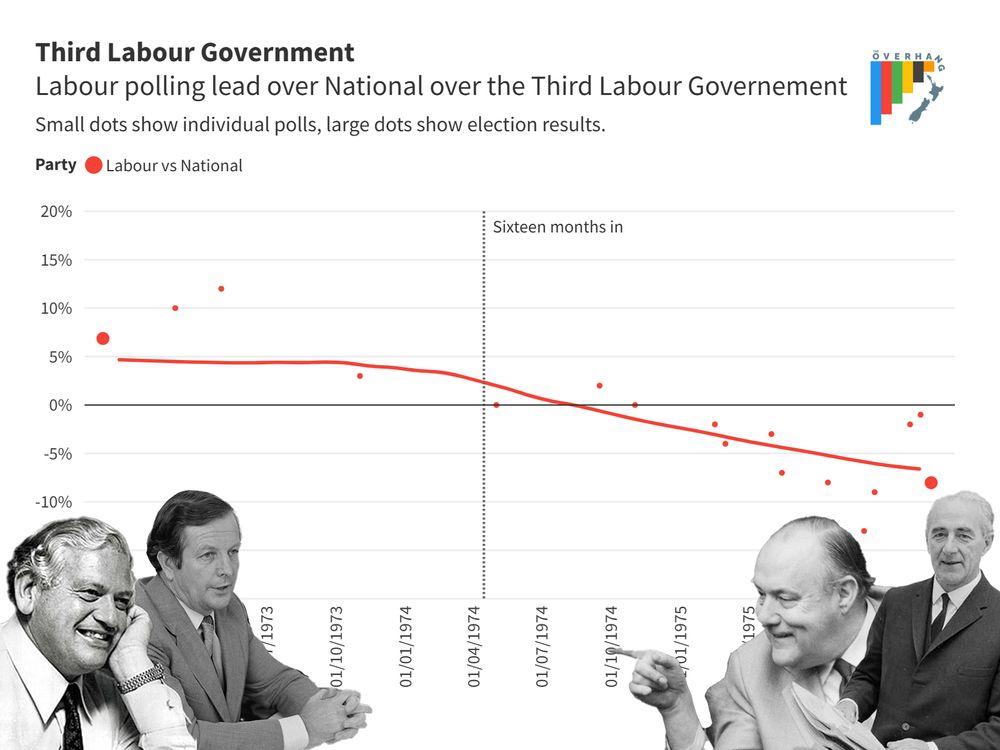
Kirk's untimely death and Muldoon's near coincident take over of National would finish them off.
February 10, 2025 at 10:35 AM
Kirk's untimely death and Muldoon's near coincident take over of National would finish them off.
Kirk started off well (finally defeating the fourth-term, Marshall-led, natural-party-of-government Second National Government) by 8%.
With repeated economic shocks, this had decayed to just 2% by the half way mark.
With repeated economic shocks, this had decayed to just 2% by the half way mark.
February 10, 2025 at 10:35 AM
Kirk started off well (finally defeating the fourth-term, Marshall-led, natural-party-of-government Second National Government) by 8%.
With repeated economic shocks, this had decayed to just 2% by the half way mark.
With repeated economic shocks, this had decayed to just 2% by the half way mark.
The two past governments who were below this average were Norman Kirk's third Labour government in the 1970s and Jim Bolger's Fourth National Government in the 1990s.
February 10, 2025 at 10:35 AM
The two past governments who were below this average were Norman Kirk's third Labour government in the 1970s and Jim Bolger's Fourth National Government in the 1990s.
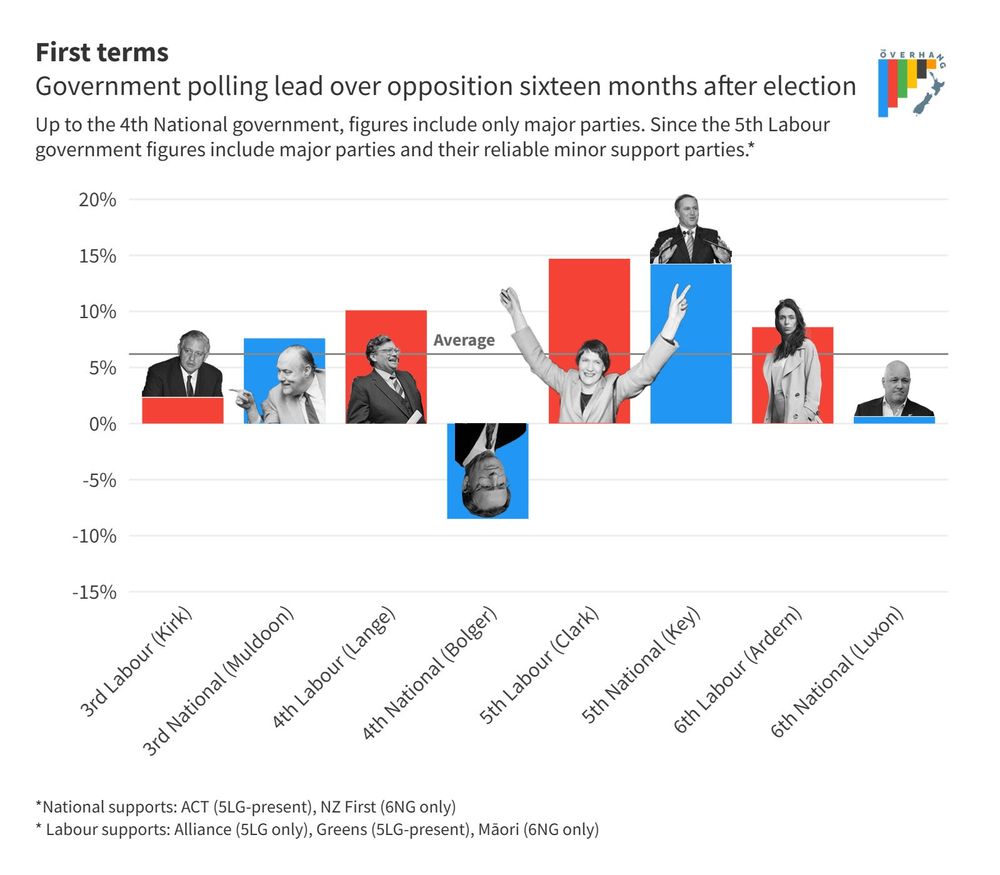
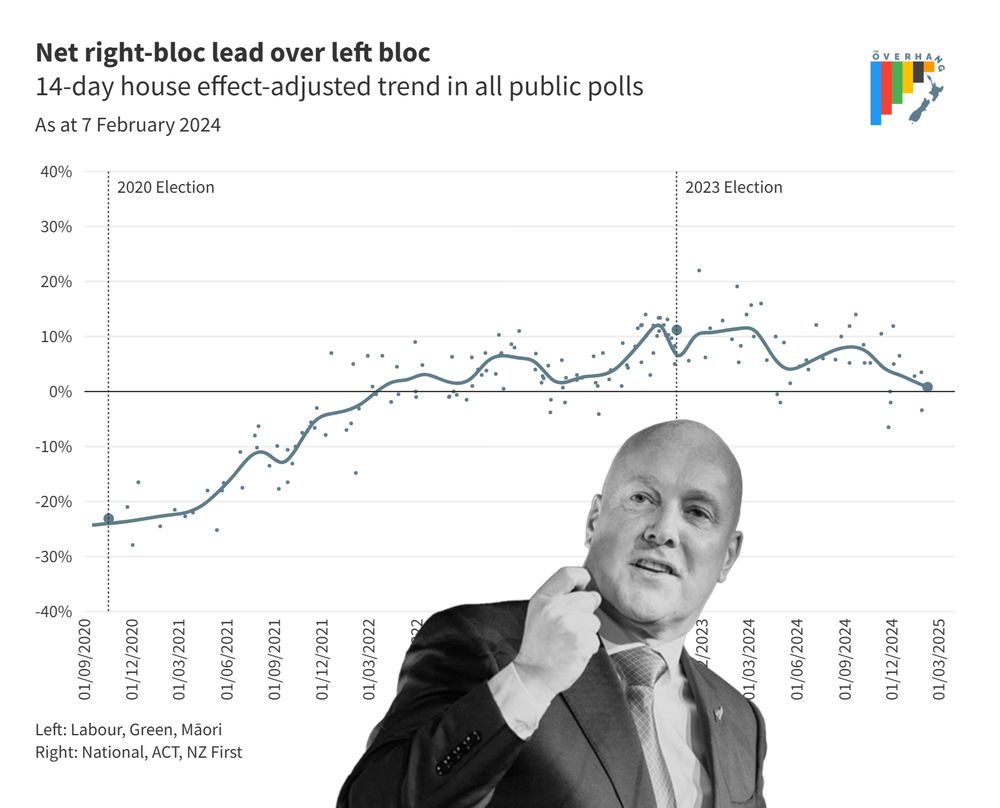
Isolating just first terms and the picture is a little more concerning.
Most new administrations tend to have an extended honeymoon, with support averaging ~6% at this point.
At 0.6% (on a raw basis not adjusting for house effects) is the second worst on record.
Most new administrations tend to have an extended honeymoon, with support averaging ~6% at this point.
At 0.6% (on a raw basis not adjusting for house effects) is the second worst on record.
February 10, 2025 at 10:35 AM
Isolating just first terms and the picture is a little more concerning.
Most new administrations tend to have an extended honeymoon, with support averaging ~6% at this point.
At 0.6% (on a raw basis not adjusting for house effects) is the second worst on record.
Most new administrations tend to have an extended honeymoon, with support averaging ~6% at this point.
At 0.6% (on a raw basis not adjusting for house effects) is the second worst on record.
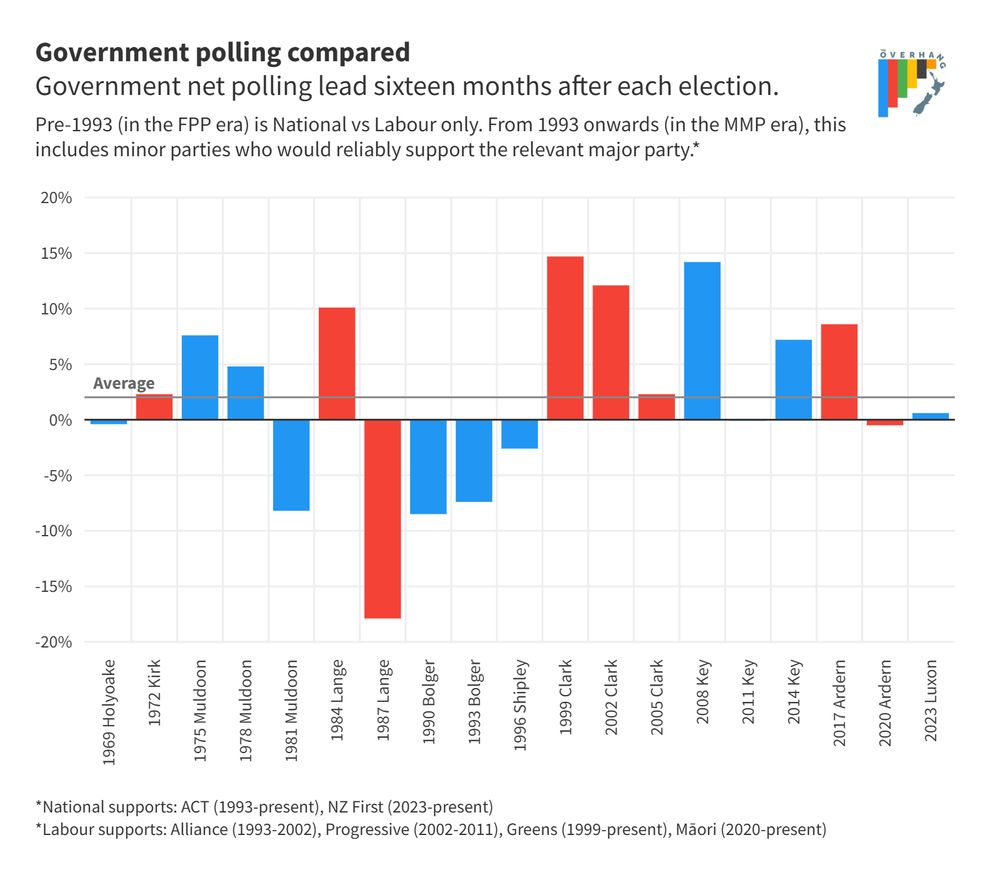
Zooming in on just where we are now (16 months in) we can get a reasonable comparison.
Next to an all-terms average of 2%, the current government's narrow lead doesn't look especially bad.
But support for the government tends to decay over its lifespan.
Next to an all-terms average of 2%, the current government's narrow lead doesn't look especially bad.
But support for the government tends to decay over its lifespan.
February 10, 2025 at 10:35 AM
Zooming in on just where we are now (16 months in) we can get a reasonable comparison.
Next to an all-terms average of 2%, the current government's narrow lead doesn't look especially bad.
But support for the government tends to decay over its lifespan.
Next to an all-terms average of 2%, the current government's narrow lead doesn't look especially bad.
But support for the government tends to decay over its lifespan.
This is on the face of it... not great.
But how does it compare historically, and how did past governments in a similar position fare? We have public polling data going back to the end of the Holyoake years.
The polling path of each govt since then, along with their electoral fortunes are below.
But how does it compare historically, and how did past governments in a similar position fare? We have public polling data going back to the end of the Holyoake years.
The polling path of each govt since then, along with their electoral fortunes are below.
February 10, 2025 at 10:35 AM
This is on the face of it... not great.
But how does it compare historically, and how did past governments in a similar position fare? We have public polling data going back to the end of the Holyoake years.
The polling path of each govt since then, along with their electoral fortunes are below.
But how does it compare historically, and how did past governments in a similar position fare? We have public polling data going back to the end of the Holyoake years.
The polling path of each govt since then, along with their electoral fortunes are below.
In terms of how we got here, Luxon et al started with a respectable 11% margin (above the historic norm of 8% for new govts) and held that lead for about a year.
Then over the course of 2024 that began to slip and now hovers just above a dead heat.
Then over the course of 2024 that began to slip and now hovers just above a dead heat.
February 10, 2025 at 10:35 AM
In terms of how we got here, Luxon et al started with a respectable 11% margin (above the historic norm of 8% for new govts) and held that lead for about a year.
Then over the course of 2024 that began to slip and now hovers just above a dead heat.
Then over the course of 2024 that began to slip and now hovers just above a dead heat.