


@metalinsurgent.bsky.social
Reposted

Blind loyalty to a President is treason.

December 24, 2025 at 5:06 PM
Blind loyalty to a President is treason.
Reposted

Reposted

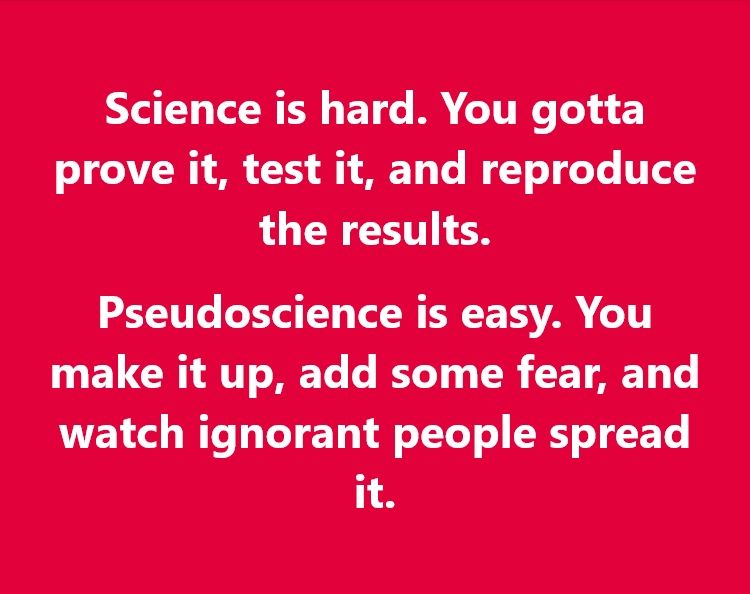
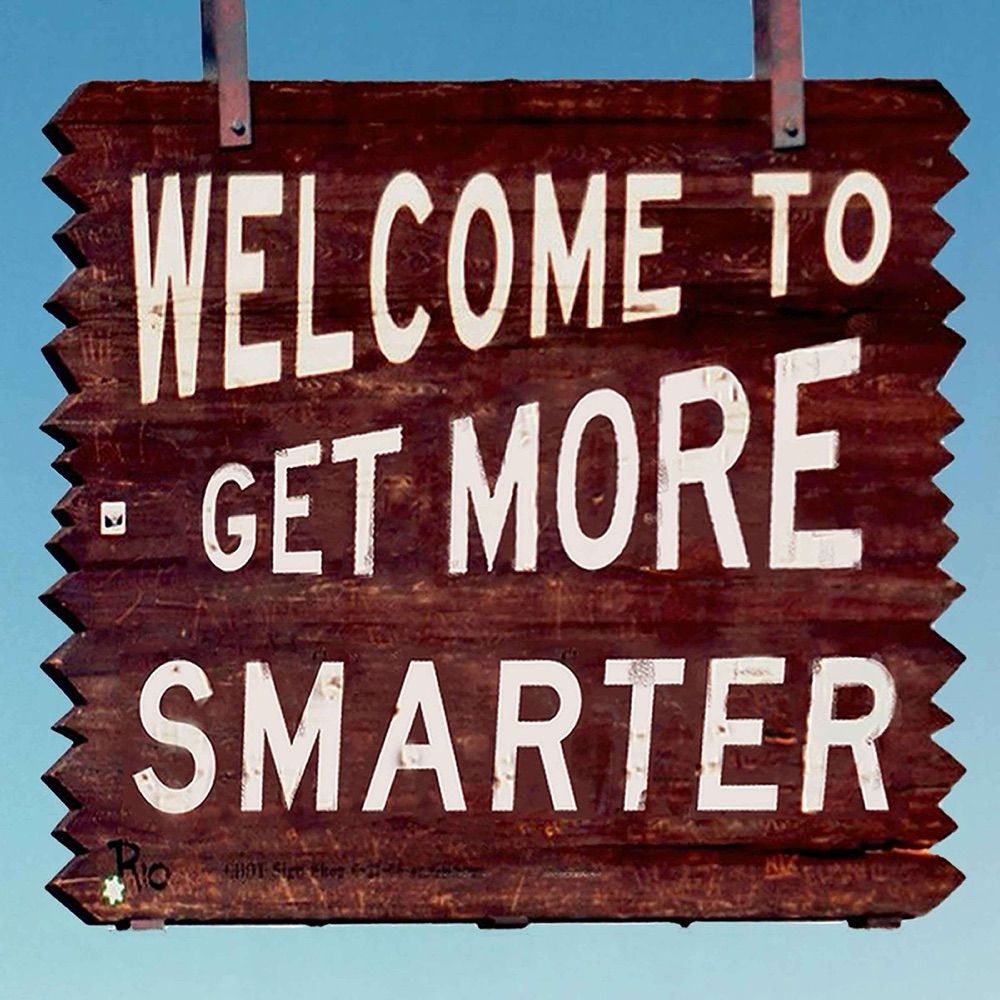
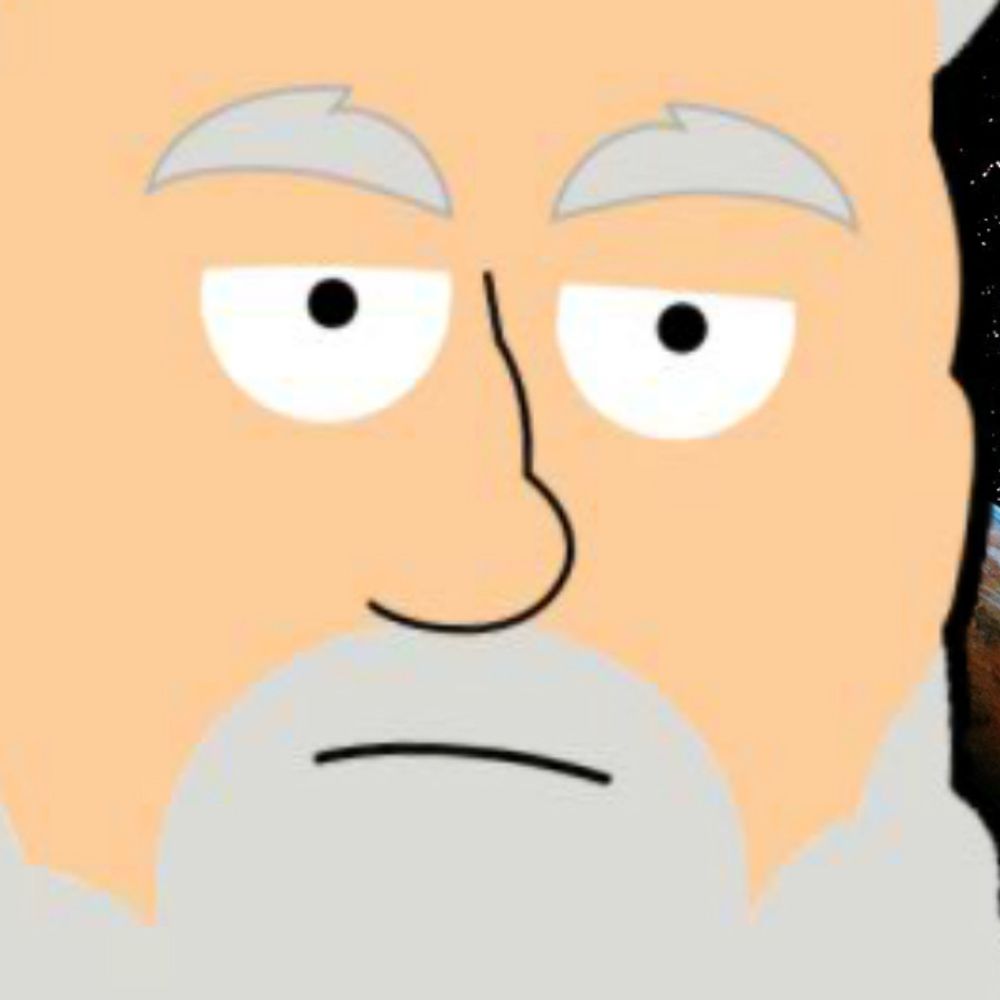
AI is… not ready yet


August 21, 2025 at 12:55 PM
AI is… not ready yet
Reposted

Reposted
This is how geologists collect lava samples from an active volcano.
Video credit: USGS
Video credit: USGS
July 13, 2025 at 12:38 AM
This is how geologists collect lava samples from an active volcano.
Video credit: USGS
Video credit: USGS
Reposted

June 21 is Show Your Stripes Day—a time to spark conversation about how our world is warming.
This video shows how @noaa.gov temperature data for the U.S. is turned into the iconic stripes visualizations you may see shared today and tomorrow.
@edhawkins.org
This video shows how @noaa.gov temperature data for the U.S. is turned into the iconic stripes visualizations you may see shared today and tomorrow.
@edhawkins.org
June 20, 2025 at 2:59 PM
June 21 is Show Your Stripes Day—a time to spark conversation about how our world is warming.
This video shows how @noaa.gov temperature data for the U.S. is turned into the iconic stripes visualizations you may see shared today and tomorrow.
@edhawkins.org
This video shows how @noaa.gov temperature data for the U.S. is turned into the iconic stripes visualizations you may see shared today and tomorrow.
@edhawkins.org
Reposted

Reposted


Reposted

Reposted

Reposted
March 8, 2025 at 2:45 AM
Reposted

Reposted
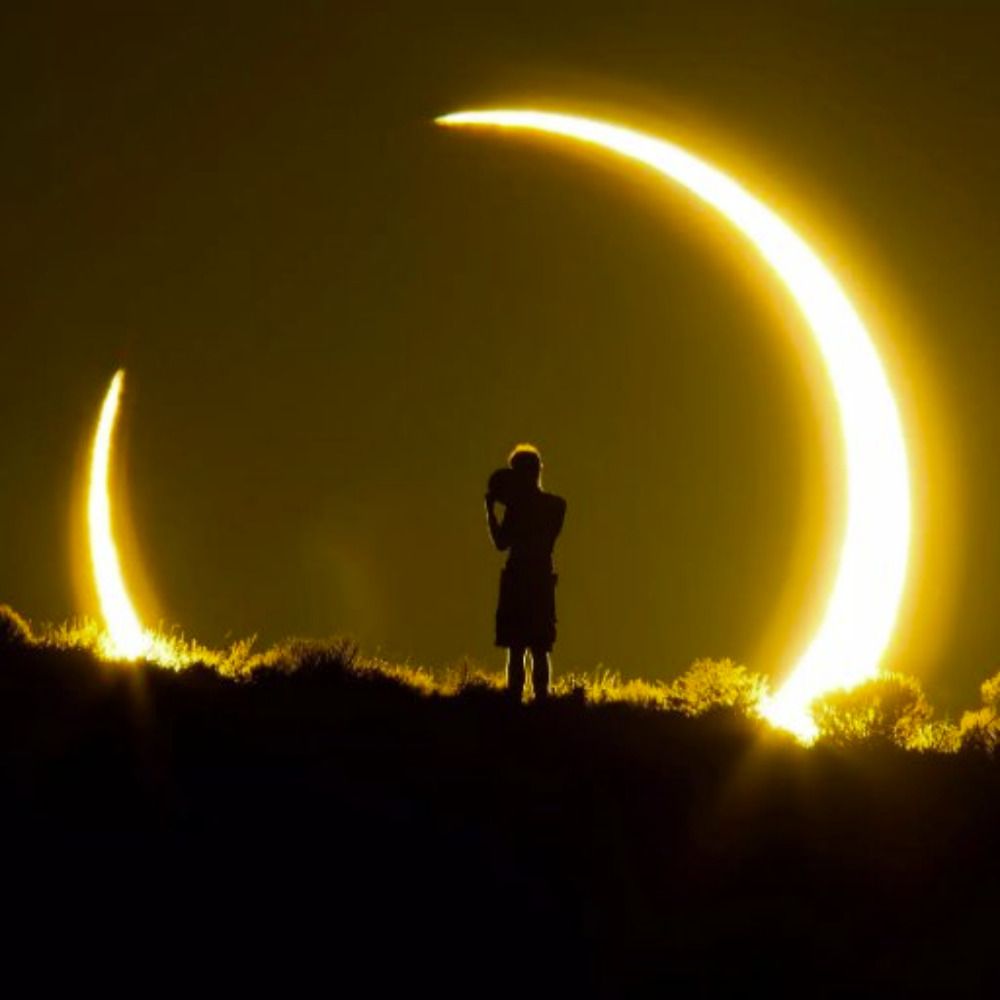
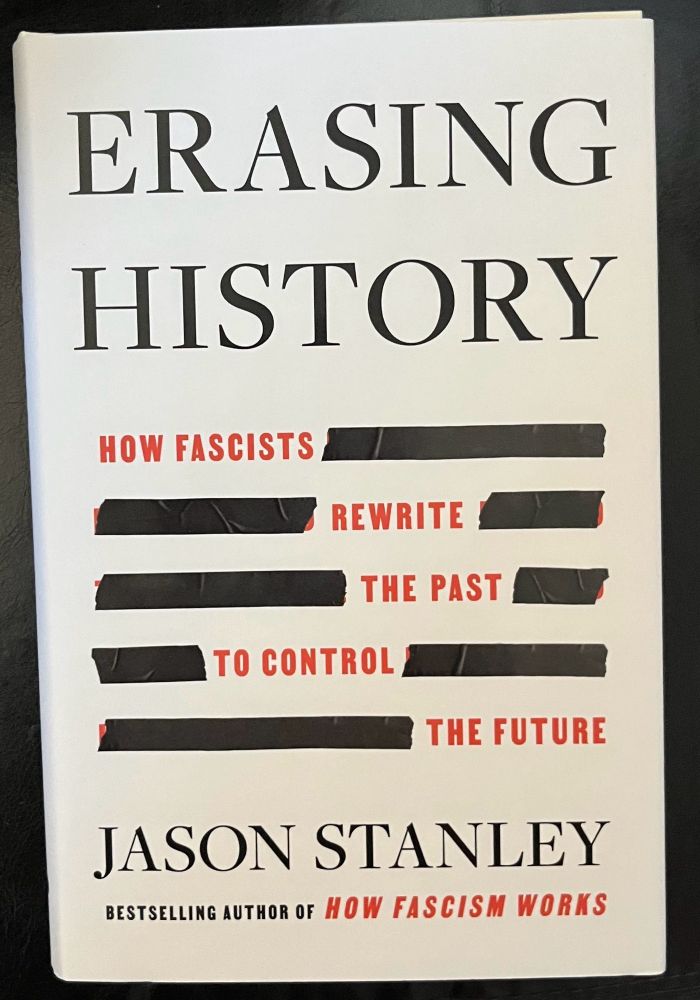
Remember, kids, we've seen it before and we'll see it again.

February 6, 2025 at 3:26 AM
Remember, kids, we've seen it before and we'll see it again.
Reposted
Reposted

Fox hunting is not a sport—it's a cruel and inhumane practice. Exploiting legal loopholes, hunters continue killing innocent foxes under the guise of "fun." 🦊💔
It's time to put an end to this outdated and barbaric tradition. 🐾 Share if you agree!
It's time to put an end to this outdated and barbaric tradition. 🐾 Share if you agree!
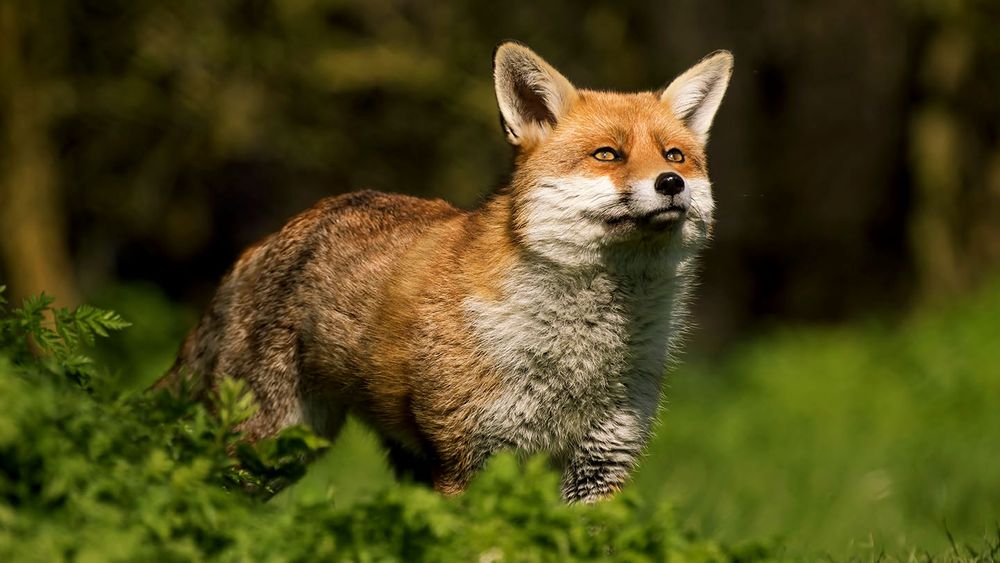
January 20, 2025 at 4:17 PM
Fox hunting is not a sport—it's a cruel and inhumane practice. Exploiting legal loopholes, hunters continue killing innocent foxes under the guise of "fun." 🦊💔
It's time to put an end to this outdated and barbaric tradition. 🐾 Share if you agree!
It's time to put an end to this outdated and barbaric tradition. 🐾 Share if you agree!
Reposted
physics of climate impacts 101:
- Stuff gets hot (worse heatwaves)
- Hot air holds more water vapor (heavier rainfall)
- Hot air is thirstier air (higher drought risk)
- Warm water is hurricane food (stronger storms)
- Hot water expands and hot ice melts (sea level rise)
- Stuff gets hot (worse heatwaves)
- Hot air holds more water vapor (heavier rainfall)
- Hot air is thirstier air (higher drought risk)
- Warm water is hurricane food (stronger storms)
- Hot water expands and hot ice melts (sea level rise)
January 14, 2025 at 9:48 PM
physics of climate impacts 101:
- Stuff gets hot (worse heatwaves)
- Hot air holds more water vapor (heavier rainfall)
- Hot air is thirstier air (higher drought risk)
- Warm water is hurricane food (stronger storms)
- Hot water expands and hot ice melts (sea level rise)
- Stuff gets hot (worse heatwaves)
- Hot air holds more water vapor (heavier rainfall)
- Hot air is thirstier air (higher drought risk)
- Warm water is hurricane food (stronger storms)
- Hot water expands and hot ice melts (sea level rise)
Reposted

Reposted
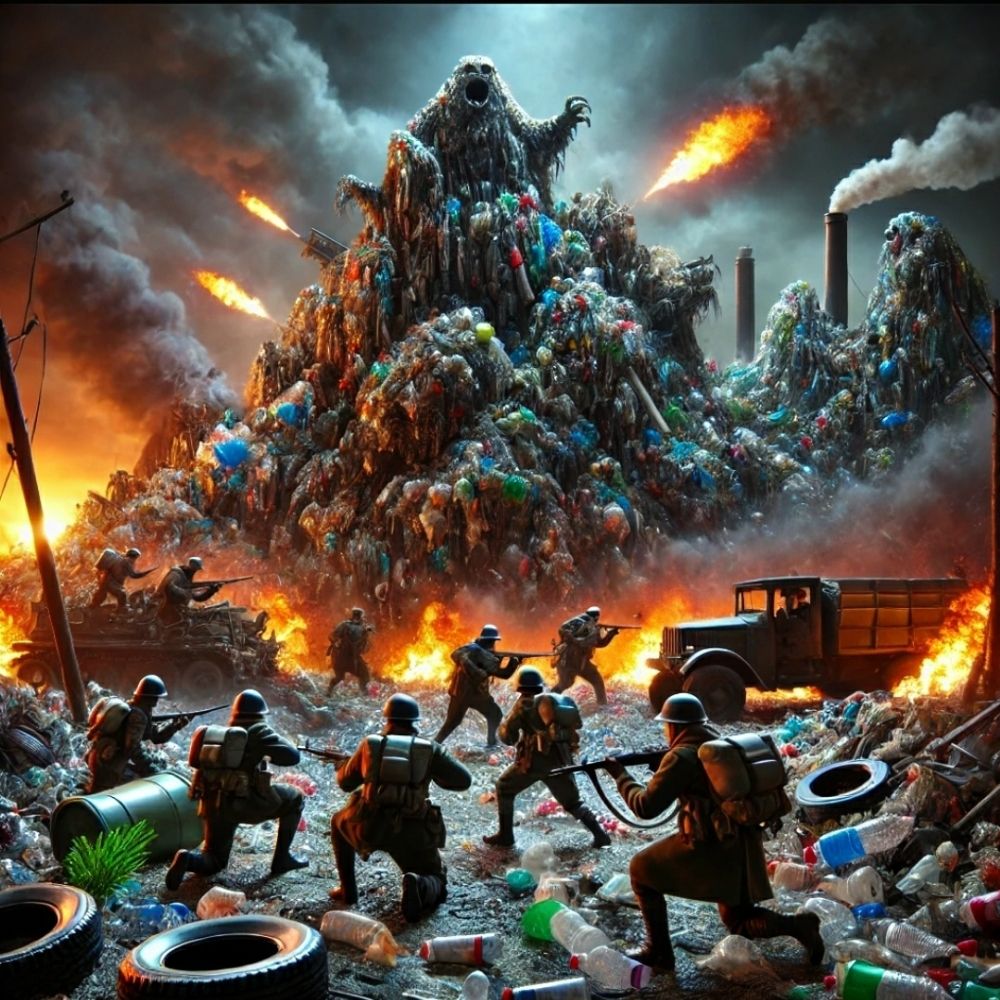
⚠️Microplastics found in clouds are disrupting weather patterns by forming ice at higher temperatures. This could amplify rainfall and snowfall, altering climate systems.
www.livescience.com/planet-earth...
www.livescience.com/planet-earth...

Microplastics may be entering the clouds and affecting the weather, scientists say
Clouds affect Earth's weather and climate in many ways. New research suggests that the presence of microplastic particles could alter these processes.
www.livescience.com
December 8, 2024 at 8:09 PM
⚠️Microplastics found in clouds are disrupting weather patterns by forming ice at higher temperatures. This could amplify rainfall and snowfall, altering climate systems.
www.livescience.com/planet-earth...
www.livescience.com/planet-earth...
Reposted

Goodreads is owned by Jeff Bezos. A better alternative is StoryGraph, a Black woman-owned platform. And before y’all start, you can transfer all your Goodreads data to Storygraph so you literally have no excuse.
November 16, 2024 at 11:38 PM
Goodreads is owned by Jeff Bezos. A better alternative is StoryGraph, a Black woman-owned platform. And before y’all start, you can transfer all your Goodreads data to Storygraph so you literally have no excuse.