


Krista Fischer
@kristafi.bsky.social
Biostatistics, causal inference, dogs, birds, culture, humour, politics and many other interests. Speaking-writing in Estonian and English.
The Lexis conference is already tomorrow (also a Zoom option available). math.ut.ee/en/WLconfere...

17 October: Conference “150 Years of Data Visualisation in Tartu: A Tribute to Wilhelm Lexis”
The conference on 17 October marks the 150th anniversary of the publication of a landmark work in statistics, demography, and data visualisation.
math.ut.ee
October 16, 2025 at 12:30 PM
The Lexis conference is already tomorrow (also a Zoom option available). math.ut.ee/en/WLconfere...
Do you know that Wilhelm Lexis published his "Introduction to the Theory of Population Statistics", containing the famous Lexis diagram, 150 years ago, while working at Tartu University? We are organizing a small conference to celebrate: math.ut.ee/en/WLconfere...

17 October: Conference “150 Years of Data Visualisation in Tartu: A Tribute to Wilhelm Lexis”
The conference on 17 October marks the 150th anniversary of the publication of a landmark work in statistics, demography, and data visualisation.
math.ut.ee
October 6, 2025 at 2:42 PM
Do you know that Wilhelm Lexis published his "Introduction to the Theory of Population Statistics", containing the famous Lexis diagram, 150 years ago, while working at Tartu University? We are organizing a small conference to celebrate: math.ut.ee/en/WLconfere...
Reposted by Krista Fischer

"The ideal subject of totalitarian rule is not the convinced Nazi or the dedicated communist, but people for whom the distinction between fact and fiction, true and false, no longer exists." - Hannah Arendt

"We were told thalidomide was a safe drug and it wasn't..."
Nigel Farage says he has 'no idea' if Donald Trump is right about paracetamol being linked to autism.
Nigel Farage says he has 'no idea' if Donald Trump is right about paracetamol being linked to autism.
September 24, 2025 at 8:04 AM
"The ideal subject of totalitarian rule is not the convinced Nazi or the dedicated communist, but people for whom the distinction between fact and fiction, true and false, no longer exists." - Hannah Arendt
A graph used by our minister of finance to support his claim that expensive food prices are caused (!) by too much retail space (Tallinn). I will use that example in my statistics classes on causal inference.

August 1, 2025 at 4:02 PM
A graph used by our minister of finance to support his claim that expensive food prices are caused (!) by too much retail space (Tallinn). I will use that example in my statistics classes on causal inference.
Reposted by Krista Fischer

#TodayinHistory #dataviz #Onthisday #OTD 📊
🎂Jul 17, 1837 Wilhelm Lexis born in Eschweilier, Germany 🇩🇪
1875: The Lexis diagram, showing relations among age (cohort), calendar time, and life spans of individuals simultaneously. Makes ALL key demographics visible
🎂Jul 17, 1837 Wilhelm Lexis born in Eschweilier, Germany 🇩🇪
1875: The Lexis diagram, showing relations among age (cohort), calendar time, and life spans of individuals simultaneously. Makes ALL key demographics visible


July 17, 2025 at 12:37 AM
#TodayinHistory #dataviz #Onthisday #OTD 📊
🎂Jul 17, 1837 Wilhelm Lexis born in Eschweilier, Germany 🇩🇪
1875: The Lexis diagram, showing relations among age (cohort), calendar time, and life spans of individuals simultaneously. Makes ALL key demographics visible
🎂Jul 17, 1837 Wilhelm Lexis born in Eschweilier, Germany 🇩🇪
1875: The Lexis diagram, showing relations among age (cohort), calendar time, and life spans of individuals simultaneously. Makes ALL key demographics visible
Reposted by Krista Fischer


June 19, 2025 at 1:55 AM
Eestikeelset põnevat lugemist tõenäosusteooriast kolleeg Jüri Lemberi sulest: ajakiri.ut.ee/elumuutvad-t... Elumuutvad tõenäosusteooriad | Universitas Tartuensis

Elumuutvad tõenäosusteooriad | Universitas Tartuensis
ajakiri.ut.ee
June 7, 2025 at 8:31 AM
Eestikeelset põnevat lugemist tõenäosusteooriast kolleeg Jüri Lemberi sulest: ajakiri.ut.ee/elumuutvad-t... Elumuutvad tõenäosusteooriad | Universitas Tartuensis
Reposted by Krista Fischer


Reposted by Krista Fischer

Thanks to everybody who chimed in!
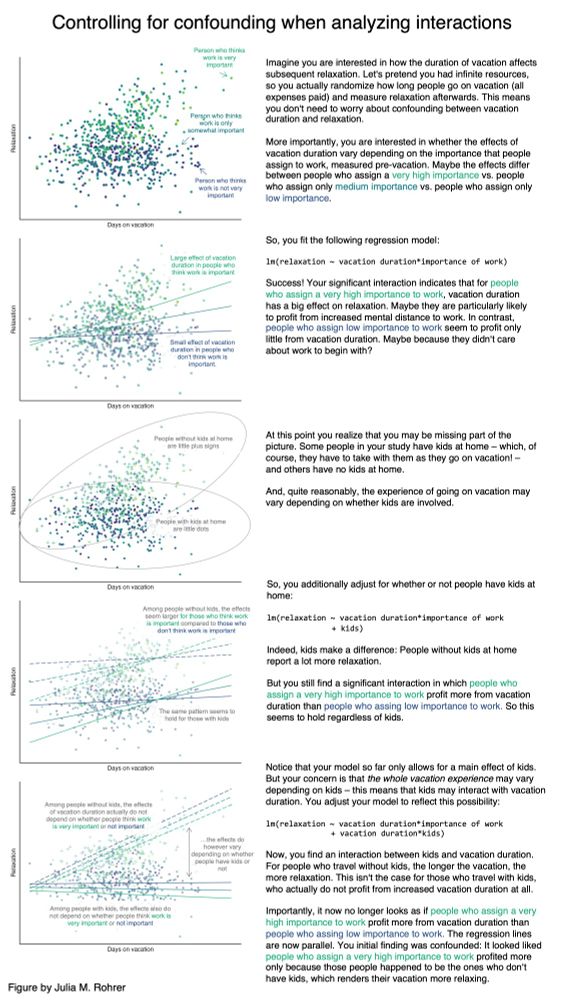
I arrived at the conclusion that (1) there's a lot of interesting stuff about interactions and (2) the figure I was looking for does not exist.
So, I made it myself! Here's a simple illustration of how to control for confounding in interactions:>
I arrived at the conclusion that (1) there's a lot of interesting stuff about interactions and (2) the figure I was looking for does not exist.
So, I made it myself! Here's a simple illustration of how to control for confounding in interactions:>
May 11, 2025 at 5:34 AM
Thanks to everybody who chimed in!
I arrived at the conclusion that (1) there's a lot of interesting stuff about interactions and (2) the figure I was looking for does not exist.
So, I made it myself! Here's a simple illustration of how to control for confounding in interactions:>
I arrived at the conclusion that (1) there's a lot of interesting stuff about interactions and (2) the figure I was looking for does not exist.
So, I made it myself! Here's a simple illustration of how to control for confounding in interactions:>
Ene-Margit Tiit oma tuntud headuses. www.err.ee/1609678676/e...
Ene-Margit Tiit: meespoliitikud küsisid juba sada aastat tagasi, miks me hällid tühjad on
Rahvastikuteadlane Ene-Margit Tiit nentis Vikerraadio "Reedeses intervjuus", et meespoliitikud on terve meie dokumenteeritud rahvastikustatistika ajaloo rääkinud, et naised peaksid rohkem sünnitama. T...
www.err.ee
May 3, 2025 at 7:32 AM
Ene-Margit Tiit oma tuntud headuses. www.err.ee/1609678676/e...
Reposted by Krista Fischer

Learned today: Base R's lengths() function gives you the length of every item in a list, e.g. lengths(my_list)
Via @ivelasq3.bsky.social
ivelasq.rbind.io/blog/not-so-...
#RStats #R
Via @ivelasq3.bsky.social
ivelasq.rbind.io/blog/not-so-...
#RStats #R

Six not-so-basic base R functions – %>% dreams
There are so many goodies in base R. Let’s explore some functions you may not know.
ivelasq.rbind.io
May 2, 2025 at 3:01 PM
Learned today: Base R's lengths() function gives you the length of every item in a list, e.g. lengths(my_list)
Via @ivelasq3.bsky.social
ivelasq.rbind.io/blog/not-so-...
#RStats #R
Via @ivelasq3.bsky.social
ivelasq.rbind.io/blog/not-so-...
#RStats #R
Reposted by Krista Fischer

“Believe it or not, electric bikes offer more exercise than pedal bikes on average. That fact might sound strange, but the science is clear.”
Why e-bikes can actually give more exercise than “acoustic” bikes. But no need to debate — both are brilliant in many ways when it comes to better cities.
Why e-bikes can actually give more exercise than “acoustic” bikes. But no need to debate — both are brilliant in many ways when it comes to better cities.

Why electric bikes actually give more exercise than pedal bikes
Believe it or not, electric bikes offer more exercise than pedal bikes on average. That fact might sound strange (and...
electrek.co
May 2, 2025 at 5:37 AM
“Believe it or not, electric bikes offer more exercise than pedal bikes on average. That fact might sound strange, but the science is clear.”
Why e-bikes can actually give more exercise than “acoustic” bikes. But no need to debate — both are brilliant in many ways when it comes to better cities.
Why e-bikes can actually give more exercise than “acoustic” bikes. But no need to debate — both are brilliant in many ways when it comes to better cities.
Reposted by Krista Fischer

The larger the dataset, the larger the false sense of confidence - if bias is baked in, size just makes a flawed measurement more convincing.
Xiao-Li Meng has called it the big data paradox: 'The bigger the data, the surer we fool ourselves.'
In other words, scale isn’t a substitute for scrutiny.
Xiao-Li Meng has called it the big data paradox: 'The bigger the data, the surer we fool ourselves.'
In other words, scale isn’t a substitute for scrutiny.

Statistical paradises and paradoxes in big data (I): Law of large populations, big data paradox, and the 2016 US presidential election
Statisticians are increasingly posed with thought-provoking and even paradoxical questions, challenging our qualifications for entering the statistical paradises created by Big Data. By developing measures for data quality, this article suggests a framework to address such a question: “Which one should I trust more: a 1% survey with 60% response rate or a self-reported administrative dataset covering 80% of the population?” A 5-element Euler-formula-like identity shows that for any dataset of size $n$, probabilistic or not, the difference between the sample average $\overline{X}_{n}$ and the population average $\overline{X}_{N}$ is the product of three terms: (1) a data quality measure, $\rho_{{R,X}}$, the correlation between $X_{j}$ and the response/recording indicator $R_{j}$; (2) a data quantity measure, $\sqrt{(N-n)/n}$, where $N$ is the population size; and (3) a problem difficulty measure, $\sigma_{X}$, the standard deviation of $X$. This decomposition provides multiple insights: (I) Probabilistic sampling ensures high data quality by controlling $\rho_{{R,X}}$ at the level of $N^{-1/2}$; (II) When we lose this control, the impact of $N$ is no longer canceled by $\rho_{{R,X}}$, leading to a Law of Large Populations (LLP), that is, our estimation error, relative to the benchmarking rate $1/\sqrt{n}$, increases with $\sqrt{N}$; and (III) the “bigness” of such Big Data (for population inferences) should be measured by the relative size $f=n/N$, not the absolute size $n$; (IV) When combining data sources for population inferences, those relatively tiny but higher quality ones should be given far more weights than suggested by their sizes. Estimates obtained from the Cooperative Congressional Election Study (CCES) of the 2016 US presidential election suggest a $\rho_{{R,X}}\approx-0.005$ for self-reporting to vote for Donald Trump. Because of LLP, this seemingly minuscule data defect correlation implies that the simple sample proportion of the self-reported voting preference for Trump from $1\%$ of the US eligible voters, that is, $n\approx2\mbox{,}300\mbox{,}000$, has the same mean squared error as the corresponding sample proportion from a genuine simple random sample of size $n\approx400$, a $99.98\%$ reduction of sample size (and hence our confidence). The CCES data demonstrate LLP vividly: on average, the larger the state’s voter populations, the further away the actual Trump vote shares from the usual $95\%$ confidence intervals based on the sample proportions. This should remind us that, without taking data quality into account, population inferences with Big Data are subject to a Big Data Paradox: the more the data, the surer we fool ourselves.
projecteuclid.org
April 25, 2025 at 5:34 AM
The larger the dataset, the larger the false sense of confidence - if bias is baked in, size just makes a flawed measurement more convincing.
Xiao-Li Meng has called it the big data paradox: 'The bigger the data, the surer we fool ourselves.'
In other words, scale isn’t a substitute for scrutiny.
Xiao-Li Meng has called it the big data paradox: 'The bigger the data, the surer we fool ourselves.'
In other words, scale isn’t a substitute for scrutiny.
Reposted by Krista Fischer

1/ Olena Zelenska said what so many of us feel but can’t put into words.
We are all under those ruins. Bleeding, grieving, screaming.
And the world still asks us to make peace?
With the ones who did this?
#UkrainianView
We are all under those ruins. Bleeding, grieving, screaming.
And the world still asks us to make peace?
With the ones who did this?
#UkrainianView


April 25, 2025 at 12:36 AM
1/ Olena Zelenska said what so many of us feel but can’t put into words.
We are all under those ruins. Bleeding, grieving, screaming.
And the world still asks us to make peace?
With the ones who did this?
#UkrainianView
We are all under those ruins. Bleeding, grieving, screaming.
And the world still asks us to make peace?
With the ones who did this?
#UkrainianView
Principles statistical analysis in epidemiology are important, if you want to understand the risk and risk factors of diseases (even in the AI-era!). We will have an excellent course with experienced faculty - early June in Tartu: bendixcarstensen.com/SPE/ #RStats #StatsSky
SPE Tartu 2025
bendixcarstensen.com
March 29, 2025 at 10:37 AM
Principles statistical analysis in epidemiology are important, if you want to understand the risk and risk factors of diseases (even in the AI-era!). We will have an excellent course with experienced faculty - early June in Tartu: bendixcarstensen.com/SPE/ #RStats #StatsSky
Reposted by Krista Fischer

Happy to share our recent article on metabolomics and incident hypertension in the Estonian Biobank. @kristafi.bsky.social @estbiobank.bsky.social @urmovosa.bsky.social
rdcu.be/edbUZ
rdcu.be/edbUZ
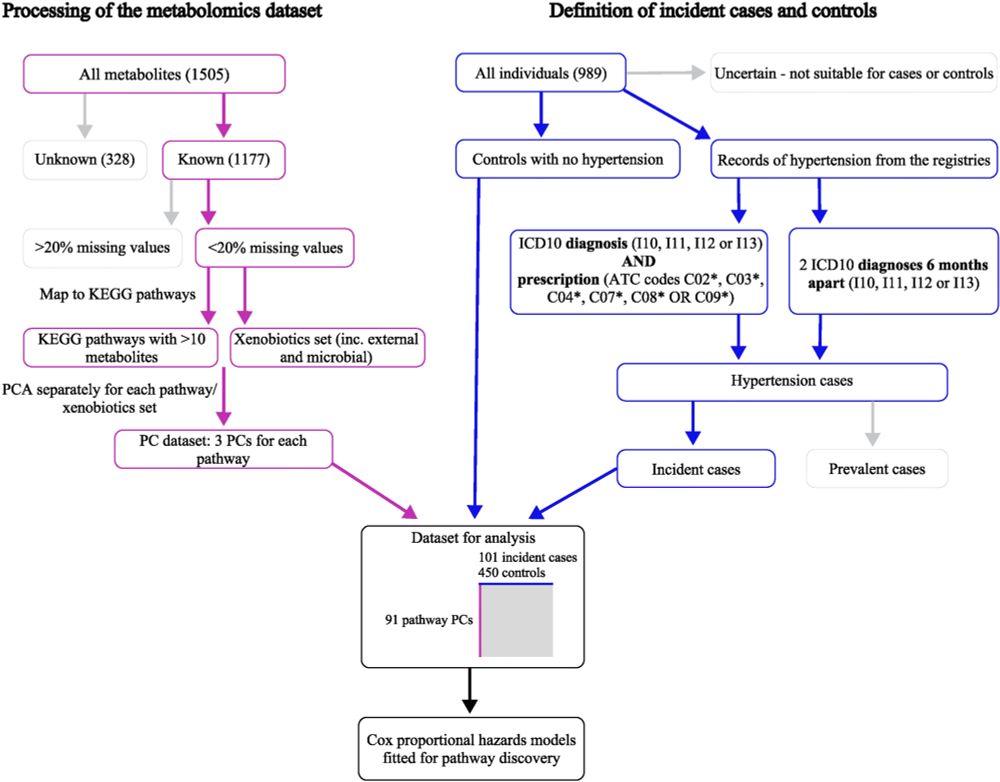
Pathway level metabolomics analysis identifies carbon metabolism as a key factor of incident hypertension in the Estonian Biobank
Scientific Reports - Pathway level metabolomics analysis identifies carbon metabolism as a key factor of incident hypertension in the Estonian Biobank
rdcu.be
March 20, 2025 at 6:59 AM
Happy to share our recent article on metabolomics and incident hypertension in the Estonian Biobank. @kristafi.bsky.social @estbiobank.bsky.social @urmovosa.bsky.social
rdcu.be/edbUZ
rdcu.be/edbUZ
Our popular SPE-course is coming again! Boost your epidemiology & stats skills in R! Join "Statistical Practice in Epidemiology using R" at the University of Tartu, Estonia, June 2–6, 2025. More info: bendixcarstensen.com/SPE/
SPE Tartu 2025
bendixcarstensen.com
March 19, 2025 at 8:26 AM
Our popular SPE-course is coming again! Boost your epidemiology & stats skills in R! Join "Statistical Practice in Epidemiology using R" at the University of Tartu, Estonia, June 2–6, 2025. More info: bendixcarstensen.com/SPE/
Reposted by Krista Fischer

"...therapy dogs can reduce child-reported anxiety and parental perception of child anxiety in the pediatric emergency department."
Therapy Dogs for Anxiety jamanetwork.com/journals/jam... cc @bunsenbernerbmd
Small study & personal bias, but love our animal helpers! #Woof.
Therapy Dogs for Anxiety jamanetwork.com/journals/jam... cc @bunsenbernerbmd
Small study & personal bias, but love our animal helpers! #Woof.

Therapy Dogs for Anxiety in Children in the Emergency Department
This randomized clinical trial assesses whether interaction with a therapy dog reduces anxiety among children in a pediatric emergency department.
jamanetwork.com
March 14, 2025 at 8:20 PM
"...therapy dogs can reduce child-reported anxiety and parental perception of child anxiety in the pediatric emergency department."
Therapy Dogs for Anxiety jamanetwork.com/journals/jam... cc @bunsenbernerbmd
Small study & personal bias, but love our animal helpers! #Woof.
Therapy Dogs for Anxiety jamanetwork.com/journals/jam... cc @bunsenbernerbmd
Small study & personal bias, but love our animal helpers! #Woof.
Reposted by Krista Fischer
The person-years of life lost from the pandemic (here for Europe) with premature mortality reflects an underestimate of the toll of Covid @plos.org
journals.plos.org/plosmedicine...
journals.plos.org/plosmedicine...


March 11, 2025 at 6:51 PM
The person-years of life lost from the pandemic (here for Europe) with premature mortality reflects an underestimate of the toll of Covid @plos.org
journals.plos.org/plosmedicine...
journals.plos.org/plosmedicine...
Reposted by Krista Fischer

It is pancake day. I make 3 pancakes: 1)both sides burnt, 2)one side burnt, 3)no sides burnt. I serve a pancake burnt side up. What's prob the other side is also burnt?
Most ppl intuit 1/2. Wrong. The right answer emerges when we stop using intuition. Lecture: www.youtube.com/watch?v=mt9W...
Most ppl intuit 1/2. Wrong. The right answer emerges when we stop using intuition. Lecture: www.youtube.com/watch?v=mt9W...

March 4, 2025 at 9:31 AM
It is pancake day. I make 3 pancakes: 1)both sides burnt, 2)one side burnt, 3)no sides burnt. I serve a pancake burnt side up. What's prob the other side is also burnt?
Most ppl intuit 1/2. Wrong. The right answer emerges when we stop using intuition. Lecture: www.youtube.com/watch?v=mt9W...
Most ppl intuit 1/2. Wrong. The right answer emerges when we stop using intuition. Lecture: www.youtube.com/watch?v=mt9W...
Reposted by Krista Fischer


Reposted by Krista Fischer

Here are some cool animations I made a couple years ago for teaching DAG-based causal inference
Confounding!
Confounding!
February 20, 2025 at 9:40 PM
Here are some cool animations I made a couple years ago for teaching DAG-based causal inference
Confounding!
Confounding!
Reposted by Krista Fischer

The DOGE firings have nothing to do with “efficiency” or “cutting waste.” They’re a direct push to weaken federal agencies perceived as liberal. This was evident from the start, and now the data confirms it: targeted agencies overwhelmingly those seen as more left-leaning. 🧵⬇️
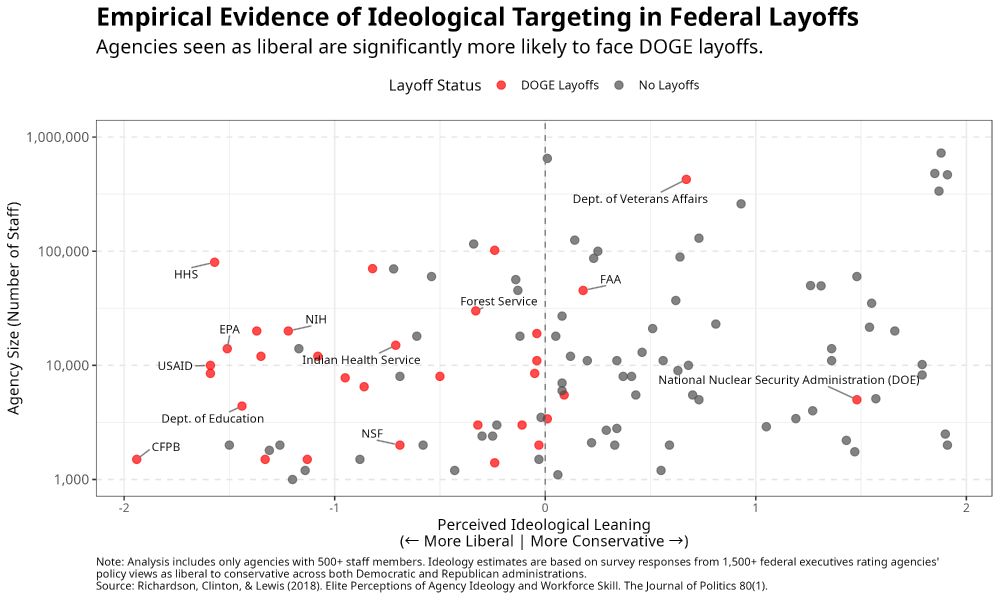
February 20, 2025 at 2:18 AM
The DOGE firings have nothing to do with “efficiency” or “cutting waste.” They’re a direct push to weaken federal agencies perceived as liberal. This was evident from the start, and now the data confirms it: targeted agencies overwhelmingly those seen as more left-leaning. 🧵⬇️