


Jarmo Kikstra
@kikstra.bsky.social
Research scholar at IIASA. Imperial College London. Lead Author IPCC AR7 WG3. Climate, energy, economics, decent living standards, and justice.
A dancing rainbow!
November 1, 2025 at 10:23 AM
A dancing rainbow!
P.S. if I split out 'progressive/left' and call D66 and Volt 'progressive centre' then we find this picture

October 31, 2025 at 9:19 AM
P.S. if I split out 'progressive/left' and call D66 and Volt 'progressive centre' then we find this picture
Minor update in morning estimate

October 30, 2025 at 9:49 AM
Minor update in morning estimate
I'm assuming Ipsos just shares the data directly with NOS, not anything else. The NOS website reads "© NOS. Bron: IPSOS, in opdracht van NOS en RTL"


October 29, 2025 at 8:49 PM
I'm assuming Ipsos just shares the data directly with NOS, not anything else. The NOS website reads "© NOS. Bron: IPSOS, in opdracht van NOS en RTL"
Ah fair question - no I just based it on the news reporting.
Do you have a link?
Do you have a link?
October 29, 2025 at 8:41 PM
Ah fair question - no I just based it on the news reporting.
Do you have a link?
Do you have a link?
No changes in the 21:30 exitpoll update.
October 29, 2025 at 8:33 PM
No changes in the 21:30 exitpoll update.
In addition to @openclimatedata.net on AR5; section 2.1.2 tried to summarise this for all ARs: gmd.copernicus.org/articles/15/...
After writing it, I also wanted to do this. So if you embark on it I'm keen to help. I did already collect even older emissions data (RCP, AR4, SRES, even IS92!)
After writing it, I also wanted to do this. So if you embark on it I'm keen to help. I did already collect even older emissions data (RCP, AR4, SRES, even IS92!)
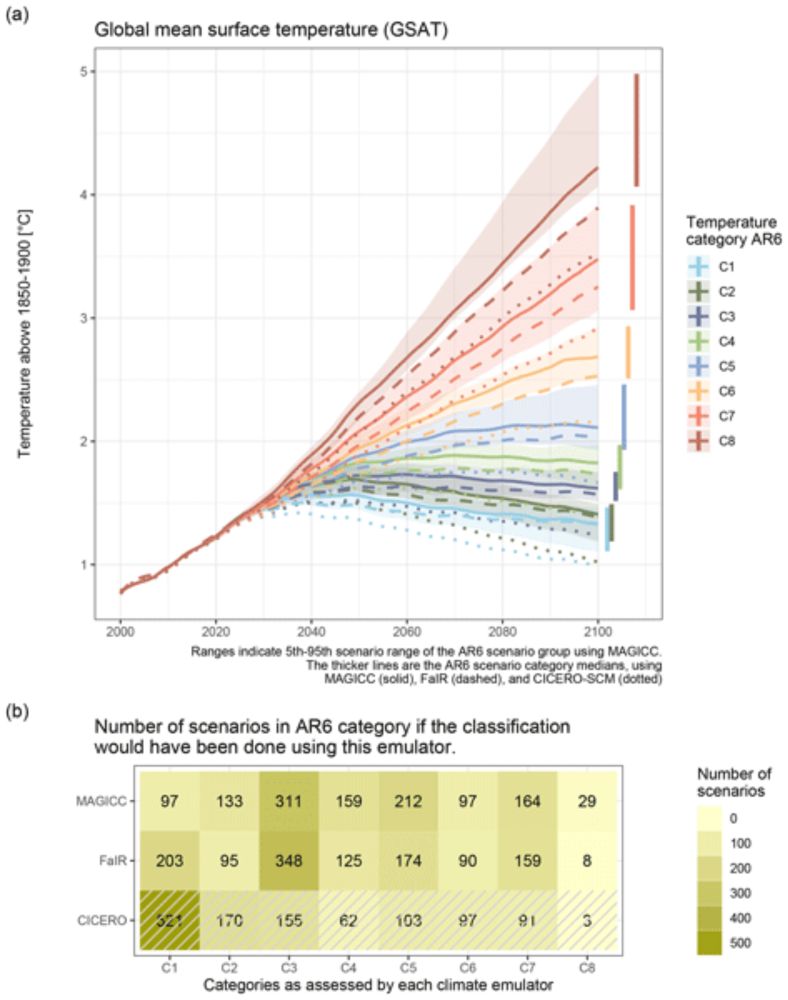
The IPCC Sixth Assessment Report WGIII climate assessment of mitigation pathways: from emissions to global temperatures
Abstract. While the Intergovernmental Panel on
Climate Change (IPCC) physical science reports usually assess a handful of future scenarios, the Working Group III contribution on climate mitigation to ...
gmd.copernicus.org
October 28, 2025 at 5:38 PM
In addition to @openclimatedata.net on AR5; section 2.1.2 tried to summarise this for all ARs: gmd.copernicus.org/articles/15/...
After writing it, I also wanted to do this. So if you embark on it I'm keen to help. I did already collect even older emissions data (RCP, AR4, SRES, even IS92!)
After writing it, I also wanted to do this. So if you embark on it I'm keen to help. I did already collect even older emissions data (RCP, AR4, SRES, even IS92!)
So, feel free to connect/reach out with anything you feel may be helpful research and suggestions!
Attached a screenshot with the topics we will cover in our chapter.
All chapter outlines: www.ipcc.ch/site/assets/...
Attached a screenshot with the topics we will cover in our chapter.
All chapter outlines: www.ipcc.ch/site/assets/...

August 15, 2025 at 3:23 PM
So, feel free to connect/reach out with anything you feel may be helpful research and suggestions!
Attached a screenshot with the topics we will cover in our chapter.
All chapter outlines: www.ipcc.ch/site/assets/...
Attached a screenshot with the topics we will cover in our chapter.
All chapter outlines: www.ipcc.ch/site/assets/...
In light of the International Court of Justice’s reaffirmation of the importance of IPCC reports, I believe its very important to do our best to improve on past reports, as a scientific community, providing solid scientific evidence for what's very urgent: good, well-informed, climate action.
August 15, 2025 at 3:23 PM
In light of the International Court of Justice’s reaffirmation of the importance of IPCC reports, I believe its very important to do our best to improve on past reports, as a scientific community, providing solid scientific evidence for what's very urgent: good, well-informed, climate action.
- also here showing 'human-induced' forcing (only anthropogenic), whereas the paper generally presents data including also natural forcing (regular solar cycles). These solar cycle peaks can affect the total forcing or temp peaks a small bit too
July 14, 2025 at 3:26 PM
- also here showing 'human-induced' forcing (only anthropogenic), whereas the paper generally presents data including also natural forcing (regular solar cycles). These solar cycle peaks can affect the total forcing or temp peaks a small bit too
A few subtle differences:
- Fig 3 is temperature, not Effective Radiative Forcing
- the plot Ken is showing picks a few 'illustrative pathways', to highlight higher (two left) and very low (two right) climate outcomes. The paper always looks at larger _groups_ of scenarios
- Fig 3 is temperature, not Effective Radiative Forcing
- the plot Ken is showing picks a few 'illustrative pathways', to highlight higher (two left) and very low (two right) climate outcomes. The paper always looks at larger _groups_ of scenarios
July 14, 2025 at 3:24 PM
A few subtle differences:
- Fig 3 is temperature, not Effective Radiative Forcing
- the plot Ken is showing picks a few 'illustrative pathways', to highlight higher (two left) and very low (two right) climate outcomes. The paper always looks at larger _groups_ of scenarios
- Fig 3 is temperature, not Effective Radiative Forcing
- the plot Ken is showing picks a few 'illustrative pathways', to highlight higher (two left) and very low (two right) climate outcomes. The paper always looks at larger _groups_ of scenarios
Thanks Ken :).
I thought this was a time to keep the y-axis constant across panels to highlight exactly that and accept that half of the facets are just whitespace -- show those contributors to warming don't matter nearly as much as CO2.
I thought this was a time to keep the y-axis constant across panels to highlight exactly that and accept that half of the facets are just whitespace -- show those contributors to warming don't matter nearly as much as CO2.
July 6, 2025 at 8:37 AM
Thanks Ken :).
I thought this was a time to keep the y-axis constant across panels to highlight exactly that and accept that half of the facets are just whitespace -- show those contributors to warming don't matter nearly as much as CO2.
I thought this was a time to keep the y-axis constant across panels to highlight exactly that and accept that half of the facets are just whitespace -- show those contributors to warming don't matter nearly as much as CO2.
Yes, these scenarios also include (lots of) decarbonization
May 15, 2025 at 1:54 PM
Yes, these scenarios also include (lots of) decarbonization
That's definitely crucial. The scenarios themselves (created with integrated assessment models) in this paper suggest start from the current infrastructures and project pathways of structural change away from that.
May 15, 2025 at 5:35 AM
That's definitely crucial. The scenarios themselves (created with integrated assessment models) in this paper suggest start from the current infrastructures and project pathways of structural change away from that.