


Joe DeCarolis
@jfdecarolis.bsky.social
Focused on applying state-of-the-art data systems, models, and analysis to inform decision making on energy. Professor at NC State University; served as the 10th Administrator of the U.S. Energy Information Administration. Personal account.
Wind is hard to model in capacity expansion models because its performance is highly dependent on its spatiotemporal representation. NEMS, like many other models, has a relatively stylized representation of wind resources.
May 5, 2025 at 5:57 PM
Wind is hard to model in capacity expansion models because its performance is highly dependent on its spatiotemporal representation. NEMS, like many other models, has a relatively stylized representation of wind resources.
Last year we also released an open source python dashboard that enables comparisons across AEO editions: github.com/EIAgov/dash-...
(Looks like it hasn't been updated with AEO2025 data yet.)
(Looks like it hasn't been updated with AEO2025 data yet.)

GitHub - EIAgov/dash-benchmark
Contribute to EIAgov/dash-benchmark development by creating an account on GitHub.
github.com
April 18, 2025 at 12:17 AM
Last year we also released an open source python dashboard that enables comparisons across AEO editions: github.com/EIAgov/dash-...
(Looks like it hasn't been updated with AEO2025 data yet.)
(Looks like it hasn't been updated with AEO2025 data yet.)
All credit goes to EIA staff. (I departed EIA on Jan. 20.)
The EIA Retrospective Report, released every other year, calculates statistics across previous AEO editions: www.eia.gov/outlooks/aeo...
The EIA Retrospective Report, released every other year, calculates statistics across previous AEO editions: www.eia.gov/outlooks/aeo...
April 18, 2025 at 12:14 AM
All credit goes to EIA staff. (I departed EIA on Jan. 20.)
The EIA Retrospective Report, released every other year, calculates statistics across previous AEO editions: www.eia.gov/outlooks/aeo...
The EIA Retrospective Report, released every other year, calculates statistics across previous AEO editions: www.eia.gov/outlooks/aeo...
That's all for now.
Again, I appreciate the dedication of EIA staff to produce the AEO under challenging circumstances.
And remember EIA's transparency. Don't like a result? Run NEMS with your own assumptions: github.com/EIAgov/NEMS
Again, I appreciate the dedication of EIA staff to produce the AEO under challenging circumstances.
And remember EIA's transparency. Don't like a result? Run NEMS with your own assumptions: github.com/EIAgov/NEMS

GitHub - EIAgov/NEMS
Contribute to EIAgov/NEMS development by creating an account on GitHub.
github.com
April 17, 2025 at 6:15 PM
That's all for now.
Again, I appreciate the dedication of EIA staff to produce the AEO under challenging circumstances.
And remember EIA's transparency. Don't like a result? Run NEMS with your own assumptions: github.com/EIAgov/NEMS
Again, I appreciate the dedication of EIA staff to produce the AEO under challenging circumstances.
And remember EIA's transparency. Don't like a result? Run NEMS with your own assumptions: github.com/EIAgov/NEMS
If you’re curious about the Trump Administration’s reaction to these independently produced results: www.energy.gov/articles/doe...

DOE Statement on EIA Annual Energy Outlook
The Department of Energy (DOE) today released the following statement from DOE Spokesperson Andrea Woods on the U.S. Energy Information Administration (EIA) Annual Energy Outlook 2025
www.energy.gov
April 17, 2025 at 6:15 PM
If you’re curious about the Trump Administration’s reaction to these independently produced results: www.energy.gov/articles/doe...
That’s a brief overview of some key results. Remember, modeling assumptions were frozen in December 2024. The effects of Trump’s executive orders and tariff policy, among other factors, could have a significant impact on these projections.
April 17, 2025 at 6:15 PM
That’s a brief overview of some key results. Remember, modeling assumptions were frozen in December 2024. The effects of Trump’s executive orders and tariff policy, among other factors, could have a significant impact on these projections.
EV sales also hit a hard upper limit around 55% of new sales. I suspect this has to do with the relative economics between the different vehicle classes as well as details in the consumer choice model. In future AEO editions, EIA should explore assumptions that could lead to higher EV deployments.
April 17, 2025 at 6:15 PM
EV sales also hit a hard upper limit around 55% of new sales. I suspect this has to do with the relative economics between the different vehicle classes as well as details in the consumer choice model. In future AEO editions, EIA should explore assumptions that could lead to higher EV deployments.
Finally, here’s a look at electric vehicle sales. Excluding several recent transportation-related regulations has a big impact on electric vehicle (EV) deployment.

April 17, 2025 at 6:15 PM
Finally, here’s a look at electric vehicle sales. Excluding several recent transportation-related regulations has a big impact on electric vehicle (EV) deployment.
You can see from the figure above that electrified transport has a significant impact on electricity demand – note the difference between the Reference case and Alternative Transportation case.
April 17, 2025 at 6:15 PM
You can see from the figure above that electrified transport has a significant impact on electricity demand – note the difference between the Reference case and Alternative Transportation case.
Overall, total electricity generation increases nearly 50% from 2024-2050. This increase is due to the electrification of end-uses, like transportation, as well as increases in existing sources of electricity demand, like data centers.

April 17, 2025 at 6:15 PM
Overall, total electricity generation increases nearly 50% from 2024-2050. This increase is due to the electrification of end-uses, like transportation, as well as increases in existing sources of electricity demand, like data centers.
And finally, here’s generation from natural gas, which declines over time in most cases as renewables take up an increasing share of generation.

April 17, 2025 at 6:15 PM
And finally, here’s generation from natural gas, which declines over time in most cases as renewables take up an increasing share of generation.
Here’s nuclear generation. Consistent with past AEO editions, nuclear energy remains relatively flat but with some variation. For example, the Low Oil and Gas Supply case leads to more expensive gas, which incentivizes new nuclear capacity in later years.

April 17, 2025 at 6:15 PM
Here’s nuclear generation. Consistent with past AEO editions, nuclear energy remains relatively flat but with some variation. For example, the Low Oil and Gas Supply case leads to more expensive gas, which incentivizes new nuclear capacity in later years.
Here’s coal. You can see the effect of the EPA 111d regulations on coal generation – it forces nearly full coal retirement by 2040. Note: “Alternative Electricity” removes those new regulations.

April 17, 2025 at 6:15 PM
Here’s coal. You can see the effect of the EPA 111d regulations on coal generation – it forces nearly full coal retirement by 2040. Note: “Alternative Electricity” removes those new regulations.
Let’s step through the full set of projections for each major source of electricity generation.
Here’s renewables. (Unfortunately, wind and solar are lumped together in the tables.) Note the marked increases in renewable generation and slowdown in later years when the IRA tax credits expire.
Here’s renewables. (Unfortunately, wind and solar are lumped together in the tables.) Note the marked increases in renewable generation and slowdown in later years when the IRA tax credits expire.

April 17, 2025 at 6:15 PM
Let’s step through the full set of projections for each major source of electricity generation.
Here’s renewables. (Unfortunately, wind and solar are lumped together in the tables.) Note the marked increases in renewable generation and slowdown in later years when the IRA tax credits expire.
Here’s renewables. (Unfortunately, wind and solar are lumped together in the tables.) Note the marked increases in renewable generation and slowdown in later years when the IRA tax credits expire.
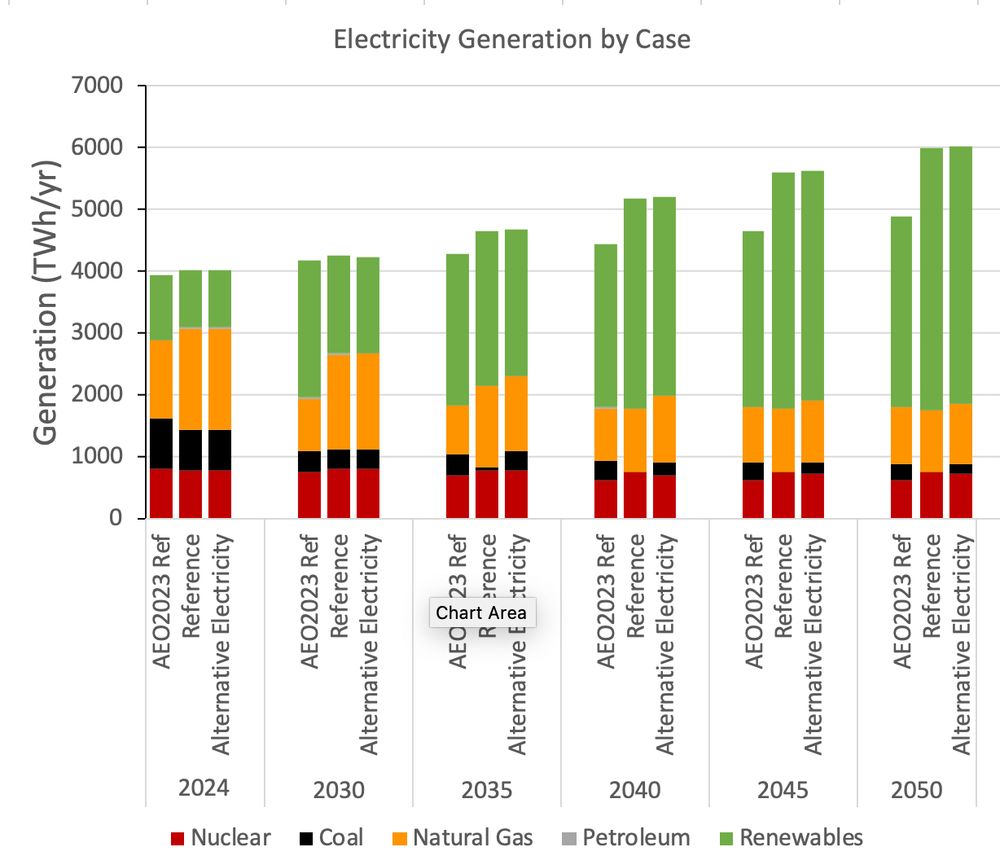
Here’s a view into the electric sector, with the AEO2023 Reference case, current Reference case, and Alternative Electricity case. Note the consistently high renewables generation, between 60-70% across these three cases.
April 17, 2025 at 6:15 PM
Here’s a view into the electric sector, with the AEO2023 Reference case, current Reference case, and Alternative Electricity case. Note the consistently high renewables generation, between 60-70% across these three cases.
So as renewable penetration increases and end uses are electrified, all else equal, it decreases the need for thermal-based primary energy sources.
April 17, 2025 at 6:15 PM
So as renewable penetration increases and end uses are electrified, all else equal, it decreases the need for thermal-based primary energy sources.
EIA changed its primary energy accounting for noncombustible renewables: www.eia.gov/totalenergy/...
In AEO2025, 1 unit of solar or wind electricity = 1 unit of primary energy. So 1 unit of solar or wind displacing 1 unit of fossil electricity reduces fossil primary energy by 2-3 units (2nd Law).
In AEO2025, 1 unit of solar or wind electricity = 1 unit of primary energy. So 1 unit of solar or wind displacing 1 unit of fossil electricity reduces fossil primary energy by 2-3 units (2nd Law).
U.S. Energy Information Administration - EIA - Independent Statistics and AnalysisU.S. Energy Information Administration (EIA) - Pub
www.eia.gov
April 17, 2025 at 6:15 PM
EIA changed its primary energy accounting for noncombustible renewables: www.eia.gov/totalenergy/...
In AEO2025, 1 unit of solar or wind electricity = 1 unit of primary energy. So 1 unit of solar or wind displacing 1 unit of fossil electricity reduces fossil primary energy by 2-3 units (2nd Law).
In AEO2025, 1 unit of solar or wind electricity = 1 unit of primary energy. So 1 unit of solar or wind displacing 1 unit of fossil electricity reduces fossil primary energy by 2-3 units (2nd Law).
Here's U.S. primary energy consumption. You can see substantial reductions from AEO2023 and through 2040. What’s going on?
Renewables, mostly solar and wind, are an increasing share of the electricity mix. End-use electrification is also increasing. What does that have to do with primary energy?
Renewables, mostly solar and wind, are an increasing share of the electricity mix. End-use electrification is also increasing. What does that have to do with primary energy?

April 17, 2025 at 6:15 PM
Here's U.S. primary energy consumption. You can see substantial reductions from AEO2023 and through 2040. What’s going on?
Renewables, mostly solar and wind, are an increasing share of the electricity mix. End-use electrification is also increasing. What does that have to do with primary energy?
Renewables, mostly solar and wind, are an increasing share of the electricity mix. End-use electrification is also increasing. What does that have to do with primary energy?