


Joe DeCarolis
@jfdecarolis.bsky.social
Focused on applying state-of-the-art data systems, models, and analysis to inform decision making on energy. Professor at NC State University; served as the 10th Administrator of the U.S. Energy Information Administration. Personal account.
Finally, here’s a look at electric vehicle sales. Excluding several recent transportation-related regulations has a big impact on electric vehicle (EV) deployment.

April 17, 2025 at 6:15 PM
Finally, here’s a look at electric vehicle sales. Excluding several recent transportation-related regulations has a big impact on electric vehicle (EV) deployment.
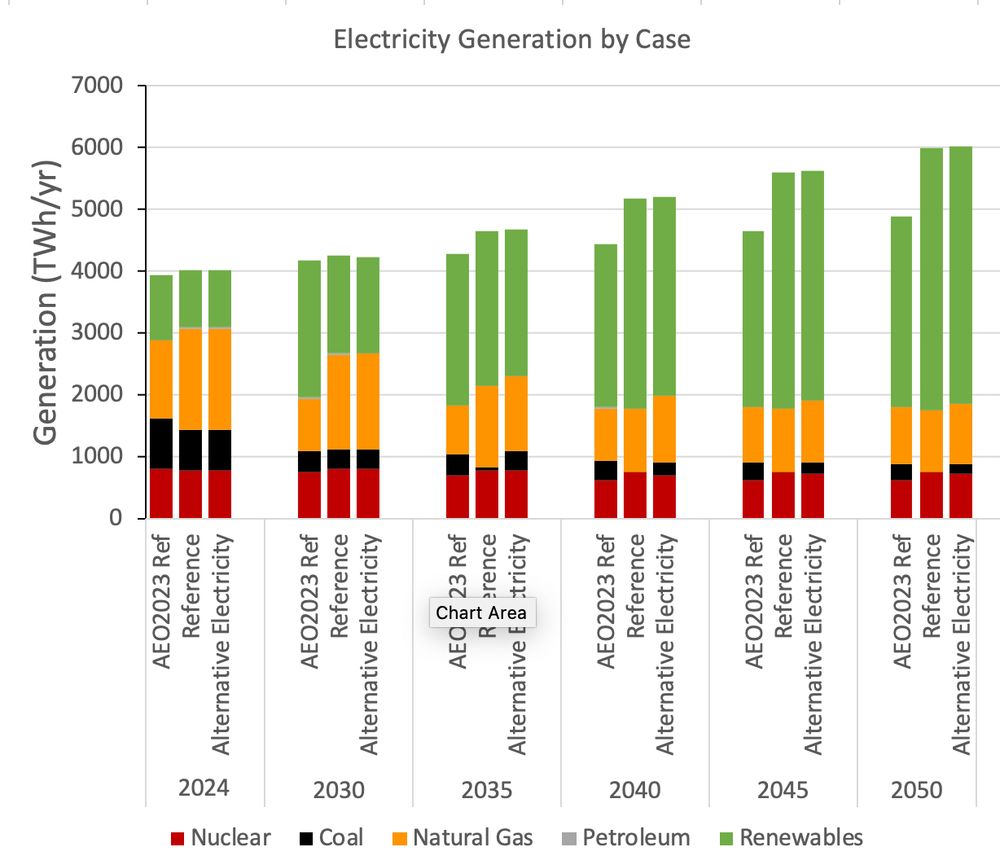
Overall, total electricity generation increases nearly 50% from 2024-2050. This increase is due to the electrification of end-uses, like transportation, as well as increases in existing sources of electricity demand, like data centers.

April 17, 2025 at 6:15 PM
Overall, total electricity generation increases nearly 50% from 2024-2050. This increase is due to the electrification of end-uses, like transportation, as well as increases in existing sources of electricity demand, like data centers.
And finally, here’s generation from natural gas, which declines over time in most cases as renewables take up an increasing share of generation.

April 17, 2025 at 6:15 PM
And finally, here’s generation from natural gas, which declines over time in most cases as renewables take up an increasing share of generation.
Here’s nuclear generation. Consistent with past AEO editions, nuclear energy remains relatively flat but with some variation. For example, the Low Oil and Gas Supply case leads to more expensive gas, which incentivizes new nuclear capacity in later years.

April 17, 2025 at 6:15 PM
Here’s nuclear generation. Consistent with past AEO editions, nuclear energy remains relatively flat but with some variation. For example, the Low Oil and Gas Supply case leads to more expensive gas, which incentivizes new nuclear capacity in later years.
Here’s coal. You can see the effect of the EPA 111d regulations on coal generation – it forces nearly full coal retirement by 2040. Note: “Alternative Electricity” removes those new regulations.

April 17, 2025 at 6:15 PM
Here’s coal. You can see the effect of the EPA 111d regulations on coal generation – it forces nearly full coal retirement by 2040. Note: “Alternative Electricity” removes those new regulations.
Let’s step through the full set of projections for each major source of electricity generation.
Here’s renewables. (Unfortunately, wind and solar are lumped together in the tables.) Note the marked increases in renewable generation and slowdown in later years when the IRA tax credits expire.
Here’s renewables. (Unfortunately, wind and solar are lumped together in the tables.) Note the marked increases in renewable generation and slowdown in later years when the IRA tax credits expire.

April 17, 2025 at 6:15 PM
Let’s step through the full set of projections for each major source of electricity generation.
Here’s renewables. (Unfortunately, wind and solar are lumped together in the tables.) Note the marked increases in renewable generation and slowdown in later years when the IRA tax credits expire.
Here’s renewables. (Unfortunately, wind and solar are lumped together in the tables.) Note the marked increases in renewable generation and slowdown in later years when the IRA tax credits expire.
Here’s a view into the electric sector, with the AEO2023 Reference case, current Reference case, and Alternative Electricity case. Note the consistently high renewables generation, between 60-70% across these three cases.
April 17, 2025 at 6:15 PM
Here’s a view into the electric sector, with the AEO2023 Reference case, current Reference case, and Alternative Electricity case. Note the consistently high renewables generation, between 60-70% across these three cases.
Here's U.S. primary energy consumption. You can see substantial reductions from AEO2023 and through 2040. What’s going on?
Renewables, mostly solar and wind, are an increasing share of the electricity mix. End-use electrification is also increasing. What does that have to do with primary energy?
Renewables, mostly solar and wind, are an increasing share of the electricity mix. End-use electrification is also increasing. What does that have to do with primary energy?

April 17, 2025 at 6:15 PM
Here's U.S. primary energy consumption. You can see substantial reductions from AEO2023 and through 2040. What’s going on?
Renewables, mostly solar and wind, are an increasing share of the electricity mix. End-use electrification is also increasing. What does that have to do with primary energy?
Renewables, mostly solar and wind, are an increasing share of the electricity mix. End-use electrification is also increasing. What does that have to do with primary energy?
OK, now let’s dig into the results, starting with energy-related CO2 emissions.

April 17, 2025 at 6:15 PM
OK, now let’s dig into the results, starting with energy-related CO2 emissions.
So what are we doing about it at EIA?
In the short-term, using our existing models, we’re examining a wider range of future scenarios and applying cones of uncertainty to better characterize the range of possible future outcomes.
In the short-term, using our existing models, we’re examining a wider range of future scenarios and applying cones of uncertainty to better characterize the range of possible future outcomes.


November 25, 2024 at 8:39 PM
So what are we doing about it at EIA?
In the short-term, using our existing models, we’re examining a wider range of future scenarios and applying cones of uncertainty to better characterize the range of possible future outcomes.
In the short-term, using our existing models, we’re examining a wider range of future scenarios and applying cones of uncertainty to better characterize the range of possible future outcomes.
These types of surprises are not unique to EIA. Developing energy projections is hard. We’re all subject to cognitive heuristics (i.e., mental shortcuts). We tend to anchor on recent experience and data and do not think expansively enough about the future.

November 25, 2024 at 8:39 PM
These types of surprises are not unique to EIA. Developing energy projections is hard. We’re all subject to cognitive heuristics (i.e., mental shortcuts). We tend to anchor on recent experience and data and do not think expansively enough about the future.
Surprise #3: Declining CO2 emissions
Total CO2 emissions reflects the net effect of cheap natural gas and renewables deployment, which led to the accelerated retirement of coal.
Here's total energy-related CO2 emissions in million metric tons using AEO editions 2005-2023:
Total CO2 emissions reflects the net effect of cheap natural gas and renewables deployment, which led to the accelerated retirement of coal.
Here's total energy-related CO2 emissions in million metric tons using AEO editions 2005-2023:
November 25, 2024 at 8:39 PM
Surprise #3: Declining CO2 emissions
Total CO2 emissions reflects the net effect of cheap natural gas and renewables deployment, which led to the accelerated retirement of coal.
Here's total energy-related CO2 emissions in million metric tons using AEO editions 2005-2023:
Total CO2 emissions reflects the net effect of cheap natural gas and renewables deployment, which led to the accelerated retirement of coal.
Here's total energy-related CO2 emissions in million metric tons using AEO editions 2005-2023:
Here’s projected total solar PV generation in terawatt-hours (TWh) using AEO editions 2005-2023:
November 25, 2024 at 8:39 PM
Here’s projected total solar PV generation in terawatt-hours (TWh) using AEO editions 2005-2023:
Here’s projected wind generation in terawatt-hours (TWh) using AEO editions 2005-2023:
November 25, 2024 at 8:39 PM
Here’s projected wind generation in terawatt-hours (TWh) using AEO editions 2005-2023:
Also, for wind, the production tax credit (PTC) lapsed multiple times over the last couple of decades, and EIA’s strict assumption of current laws and regulations means that we often missed renewals of the PTC that affected the economics of wind.

November 25, 2024 at 8:39 PM
Also, for wind, the production tax credit (PTC) lapsed multiple times over the last couple of decades, and EIA’s strict assumption of current laws and regulations means that we often missed renewals of the PTC that affected the economics of wind.
Surprise #2: Rapid cost declines in wind and solar PV
EIA projected capital costs for wind and solar were too high, as indicated here.
EIA projected capital costs for wind and solar were too high, as indicated here.

November 25, 2024 at 8:39 PM
Surprise #2: Rapid cost declines in wind and solar PV
EIA projected capital costs for wind and solar were too high, as indicated here.
EIA projected capital costs for wind and solar were too high, as indicated here.
Here’s projected U.S. crude oil production in million barrels per day using AEO editions 2005-2023:
November 25, 2024 at 8:39 PM
Here’s projected U.S. crude oil production in million barrels per day using AEO editions 2005-2023:
Here’s projected U.S. dry natural gas production in trillion cubic feet using AEO editions 2005-2023:
(all modeled cases; black line is actual)
(all modeled cases; black line is actual)
November 25, 2024 at 8:39 PM
Here’s projected U.S. dry natural gas production in trillion cubic feet using AEO editions 2005-2023:
(all modeled cases; black line is actual)
(all modeled cases; black line is actual)
Thus long-term energy models should not be used to forecast. Rather, they should be used to produce insights conditioned on an assessment of future uncertainty.

November 25, 2024 at 8:39 PM
Thus long-term energy models should not be used to forecast. Rather, they should be used to produce insights conditioned on an assessment of future uncertainty.
The rationale for developing a new open source model is outlined in this working paper: www.eia.gov/beta/working...
TL;DR To address emerging energy issues, we need a next generation model that is modular, flexible, transparent, and robust.
TL;DR To address emerging energy issues, we need a next generation model that is modular, flexible, transparent, and robust.

October 31, 2024 at 7:10 PM
The rationale for developing a new open source model is outlined in this working paper: www.eia.gov/beta/working...
TL;DR To address emerging energy issues, we need a next generation model that is modular, flexible, transparent, and robust.
TL;DR To address emerging energy issues, we need a next generation model that is modular, flexible, transparent, and robust.
The rationale for developing this new open source framework is outlined in this working paper. www.eia.gov/beta/working...
October 31, 2024 at 7:08 PM
The rationale for developing this new open source framework is outlined in this working paper. www.eia.gov/beta/working...
The Sankey is a new and improved version of the classic EIA "spaghetti diagram"

October 29, 2024 at 5:19 PM
The Sankey is a new and improved version of the classic EIA "spaghetti diagram"
Behold, EIA developed a new Sankey diagram to represent the U.S. energy system! 🔌💡 www.eia.gov/totalenergy/...
🧵👇
🧵👇

October 29, 2024 at 5:17 PM
Behold, EIA developed a new Sankey diagram to represent the U.S. energy system! 🔌💡 www.eia.gov/totalenergy/...
🧵👇
🧵👇
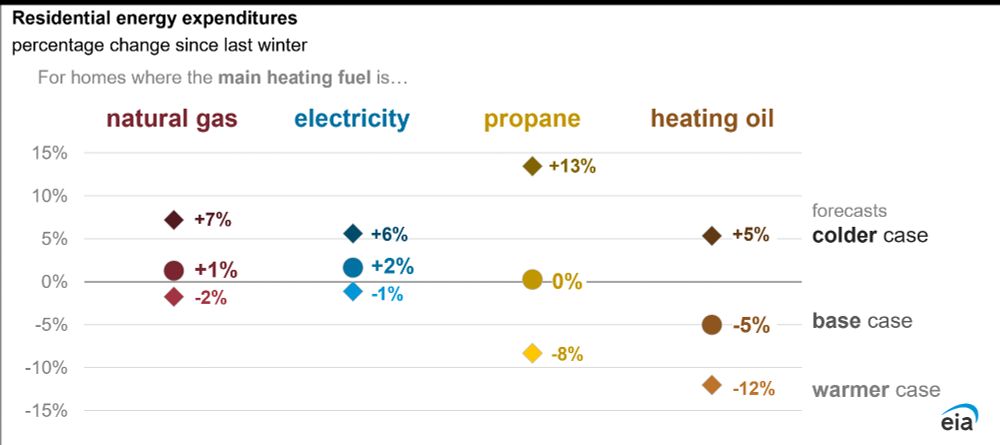
This week, EIA released its Winter Fuels Outlook, which estimates household energy expenditures for the upcoming winter.
tl;dr: Expenditures are expected to be about the same as last winter. Lower prices compensate for a slightly colder winter. 🔌💡
See more here:
www.eia.gov/outlooks/ste...
tl;dr: Expenditures are expected to be about the same as last winter. Lower prices compensate for a slightly colder winter. 🔌💡
See more here:
www.eia.gov/outlooks/ste...
October 11, 2024 at 7:48 PM
This week, EIA released its Winter Fuels Outlook, which estimates household energy expenditures for the upcoming winter.
tl;dr: Expenditures are expected to be about the same as last winter. Lower prices compensate for a slightly colder winter. 🔌💡
See more here:
www.eia.gov/outlooks/ste...
tl;dr: Expenditures are expected to be about the same as last winter. Lower prices compensate for a slightly colder winter. 🔌💡
See more here:
www.eia.gov/outlooks/ste...
In an effort to increase transparency, we have developed a python-based benchmarking tool to compare our AEO projections against real world outcomes. It includes all past cases and allows you to visualize the pathways.

September 13, 2024 at 4:45 PM
In an effort to increase transparency, we have developed a python-based benchmarking tool to compare our AEO projections against real world outcomes. It includes all past cases and allows you to visualize the pathways.