


Juan Carlos Ramírez
@jcarlosramirez.bsky.social
Reposted by Juan Carlos Ramírez

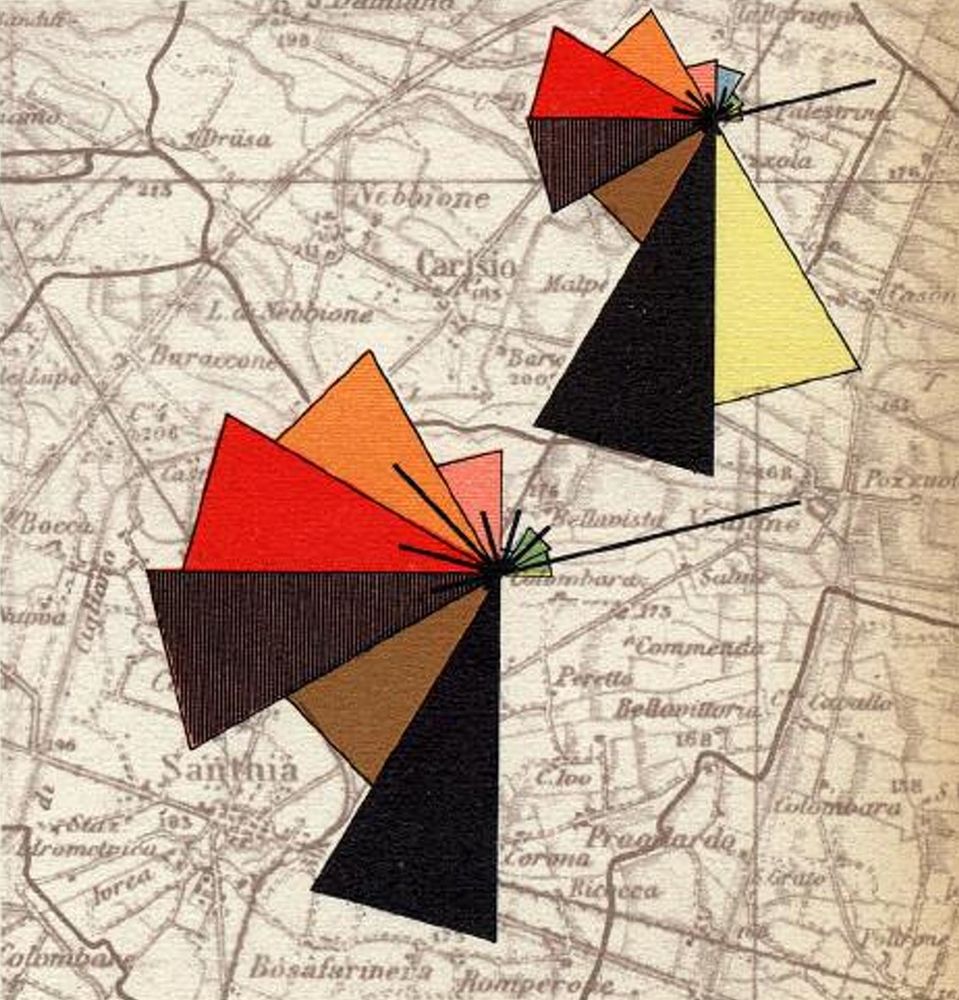
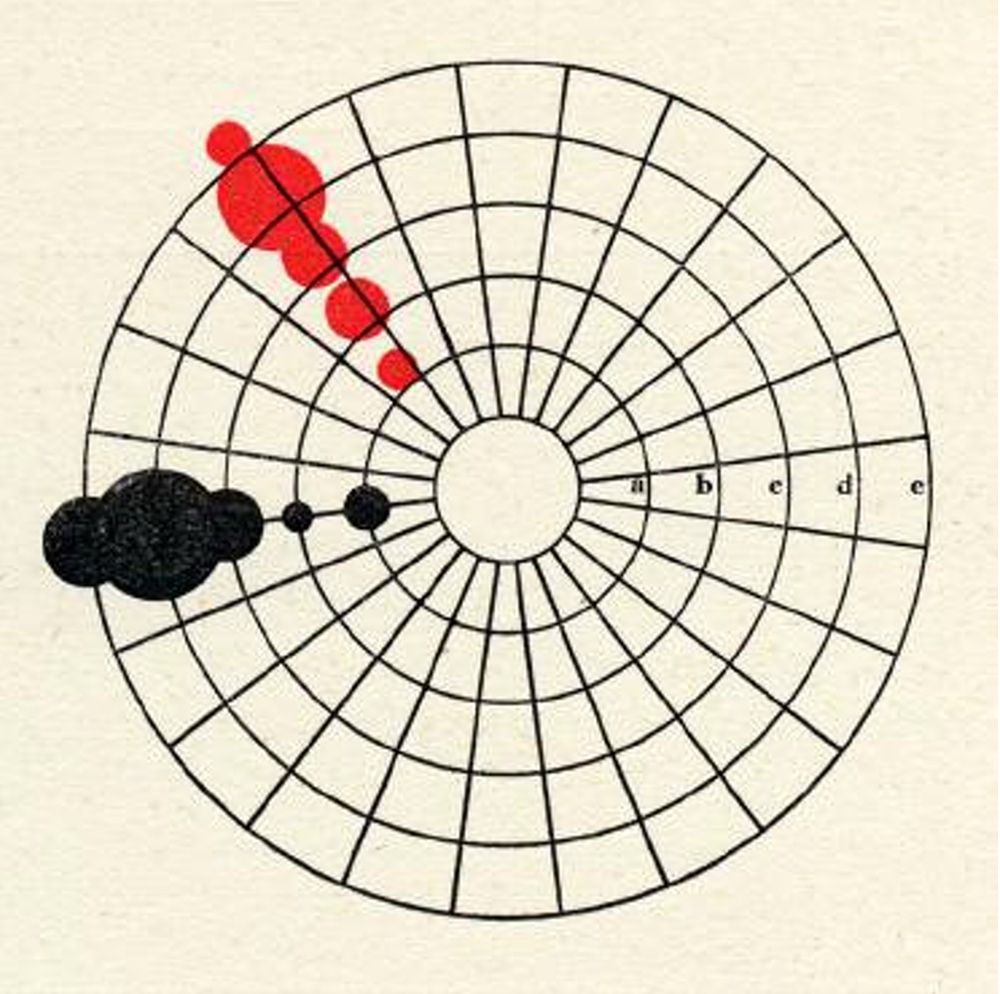
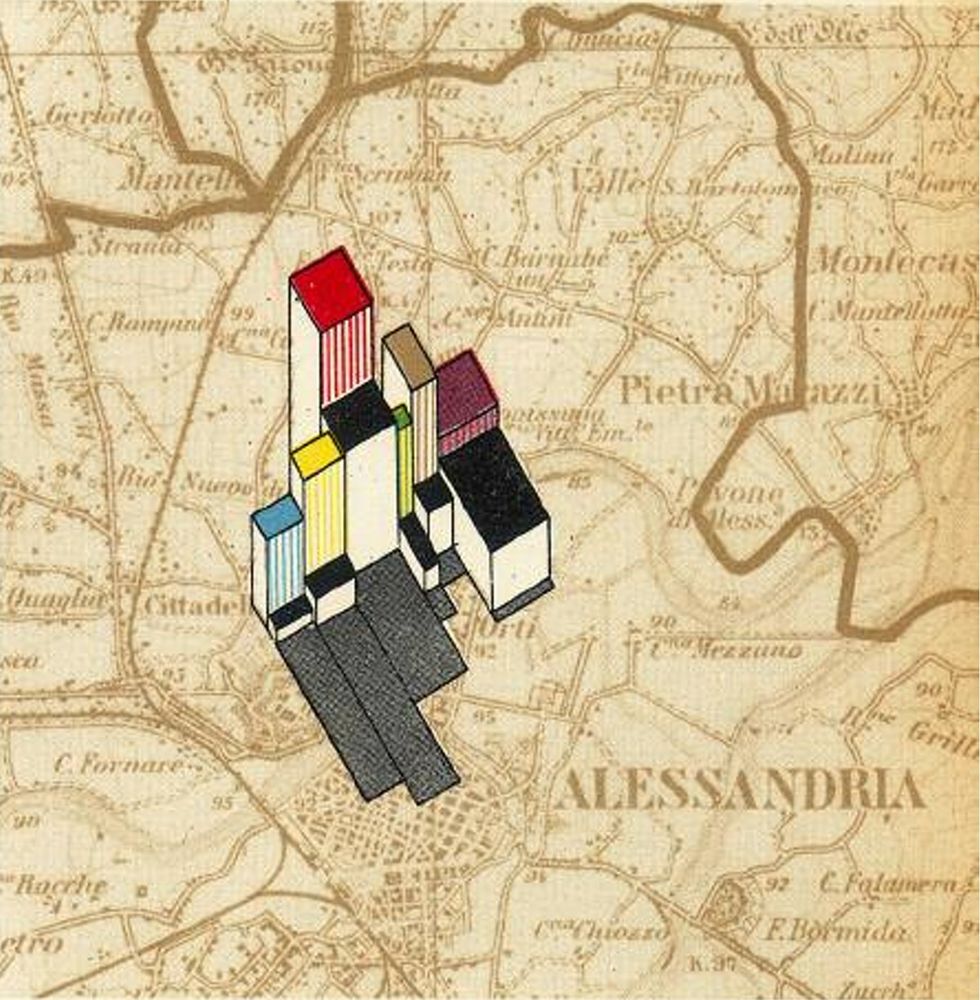
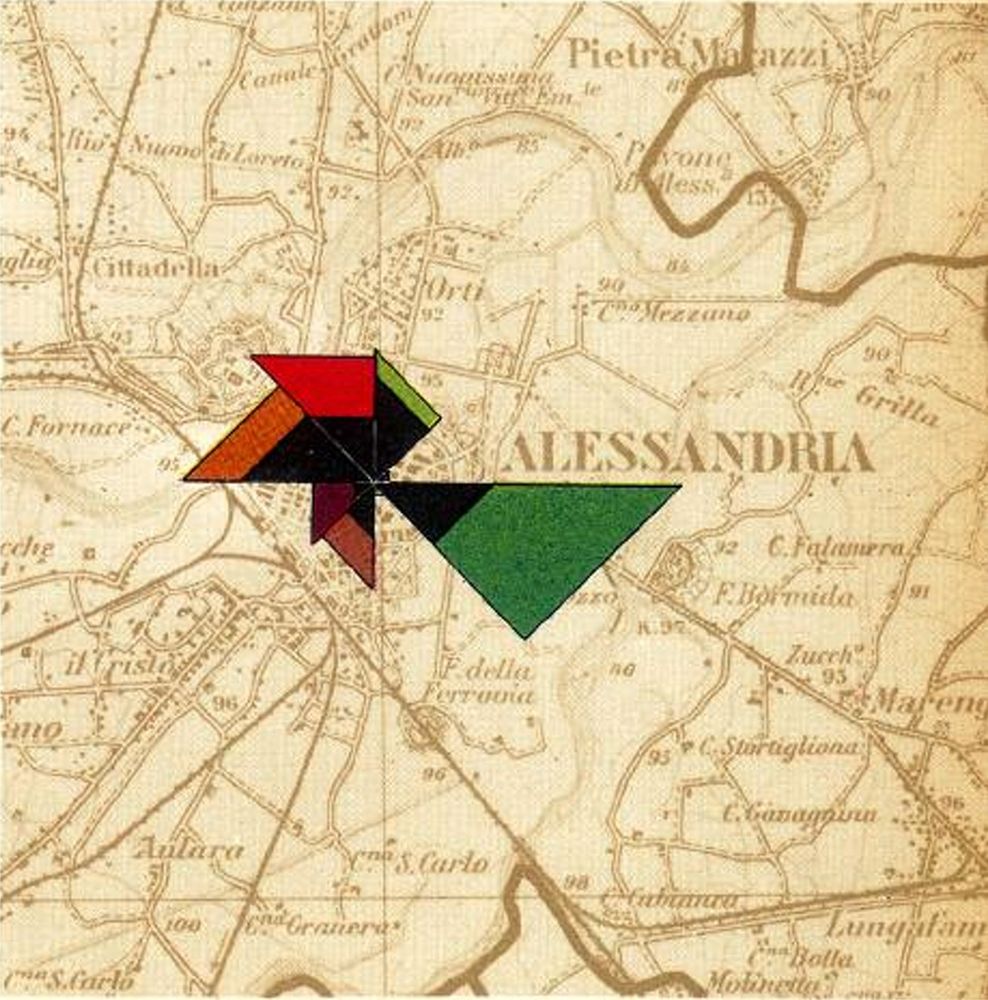
Dataviz and cartograms from Italian urbanist and architect, Giovanni Astengo's (1915-1990) "handbook" (1953). link: circe.iuav.it/astengo/dati...
May 8, 2025 at 7:55 PM
Dataviz and cartograms from Italian urbanist and architect, Giovanni Astengo's (1915-1990) "handbook" (1953). link: circe.iuav.it/astengo/dati...
Reposted by Juan Carlos Ramírez

📊 Data update: We've just updated the data in many of our charts on immigration/emigration!
This is data on migrant stocks sourced from the UN Department of Economic and Social Affairs (UN DESA). Previously we only had data up to 2020 — now we have through 2024.
This is data on migrant stocks sourced from the UN Department of Economic and Social Affairs (UN DESA). Previously we only had data up to 2020 — now we have through 2024.

April 7, 2025 at 1:57 PM
📊 Data update: We've just updated the data in many of our charts on immigration/emigration!
This is data on migrant stocks sourced from the UN Department of Economic and Social Affairs (UN DESA). Previously we only had data up to 2020 — now we have through 2024.
This is data on migrant stocks sourced from the UN Department of Economic and Social Affairs (UN DESA). Previously we only had data up to 2020 — now we have through 2024.
Reposted by Juan Carlos Ramírez

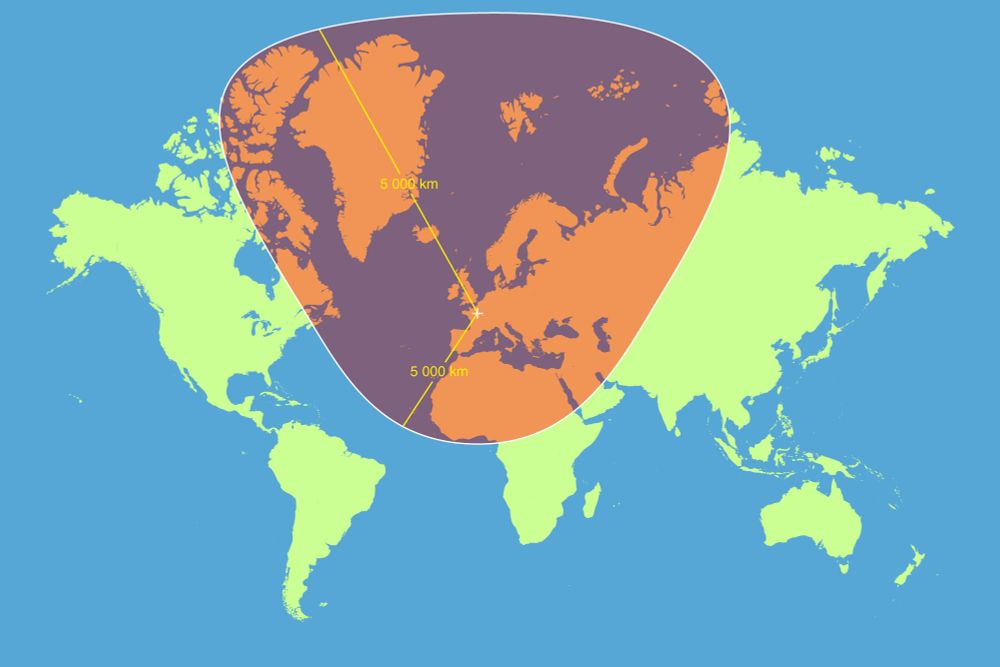
Another reasons to tut at the Mercator Map projection - how a circle with a radius of 5,000km, centred on Paris, looks according the Mercator map
April 7, 2025 at 2:55 PM
Another reasons to tut at the Mercator Map projection - how a circle with a radius of 5,000km, centred on Paris, looks according the Mercator map
Reposted by Juan Carlos Ramírez

Hace 5 años que dejé de investigar las narrativas #transmedia para dedicarme a la evolución de los medios. A veces me piden intervenciones sobre las NT que, en general, rechazo. Ahora pueden consultar este GPT entrenado para responder a preguntas sobre NT buff.ly/qOar5qN

March 1, 2025 at 6:42 PM
Hace 5 años que dejé de investigar las narrativas #transmedia para dedicarme a la evolución de los medios. A veces me piden intervenciones sobre las NT que, en general, rechazo. Ahora pueden consultar este GPT entrenado para responder a preguntas sobre NT buff.ly/qOar5qN
Reposted by Juan Carlos Ramírez
Investigar las polarizaciones entre fugas, asimetrías y migraciones de X a Bluesky. Un texto polifónico con contribuciones de @congosto.bsky.social, Natalia Aruguete y @snurb.info 🙏https://hipermediaciones.com/2025/02/12/investigar-las-polarizaciones-entre-fugas-asimetrias-y-migraciones/

Investigar las polarizaciones entre fugas, asimetrías y migraciones.
Ideas sueltas Desde hace unas semanas me persiguen un par de ideas. Trataré de explicarlas brevemente antes de ceder la palabra. En la última década han proliferado los estudios sobre la polarizaci…
hipermediaciones.com
February 12, 2025 at 8:21 AM
Investigar las polarizaciones entre fugas, asimetrías y migraciones de X a Bluesky. Un texto polifónico con contribuciones de @congosto.bsky.social, Natalia Aruguete y @snurb.info 🙏https://hipermediaciones.com/2025/02/12/investigar-las-polarizaciones-entre-fugas-asimetrias-y-migraciones/
Reposted by Juan Carlos Ramírez

Animation can be a gimmicky distraction in data visualization. But when used with care, animation can improve user experiences and help viewers track patterns across charts and metrics. We share five ways you can use animation for more effective data viz: https://buff.ly/3ZDT3tp

December 5, 2024 at 5:21 PM
Animation can be a gimmicky distraction in data visualization. But when used with care, animation can improve user experiences and help viewers track patterns across charts and metrics. We share five ways you can use animation for more effective data viz: https://buff.ly/3ZDT3tp
Reposted by Juan Carlos Ramírez

Dying to get to Europe !
100% JavaScript generated map with geoviz, dbscan and observable.
observablehq.com/@neocartocnr...
100% JavaScript generated map with geoviz, dbscan and observable.
observablehq.com/@neocartocnr...

December 2, 2024 at 11:08 AM
Dying to get to Europe !
100% JavaScript generated map with geoviz, dbscan and observable.
observablehq.com/@neocartocnr...
100% JavaScript generated map with geoviz, dbscan and observable.
observablehq.com/@neocartocnr...
Reposted by Juan Carlos Ramírez

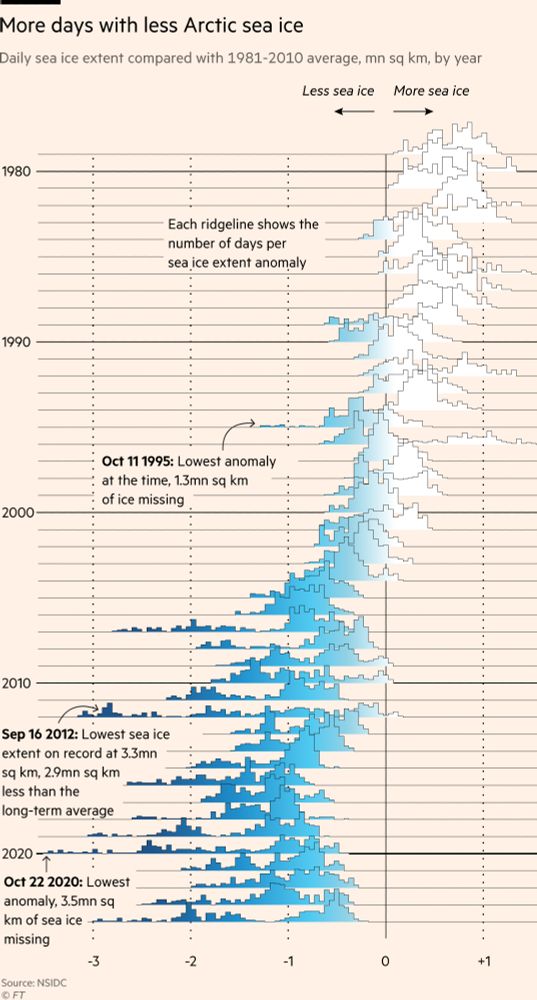
The Arctic Ocean could see its first ice-free day by 2030, new research shows
"The fact that the Arctic sea ice cover has changed so significantly that [its loss in] 2030 is even a remote possibility shows how much change there has already been in the Arctic environment”
on.ft.com/3DgyKJK
"The fact that the Arctic sea ice cover has changed so significantly that [its loss in] 2030 is even a remote possibility shows how much change there has already been in the Arctic environment”
on.ft.com/3DgyKJK
December 7, 2024 at 4:13 PM
The Arctic Ocean could see its first ice-free day by 2030, new research shows
"The fact that the Arctic sea ice cover has changed so significantly that [its loss in] 2030 is even a remote possibility shows how much change there has already been in the Arctic environment”
on.ft.com/3DgyKJK
"The fact that the Arctic sea ice cover has changed so significantly that [its loss in] 2030 is even a remote possibility shows how much change there has already been in the Arctic environment”
on.ft.com/3DgyKJK
Reposted by Juan Carlos Ramírez

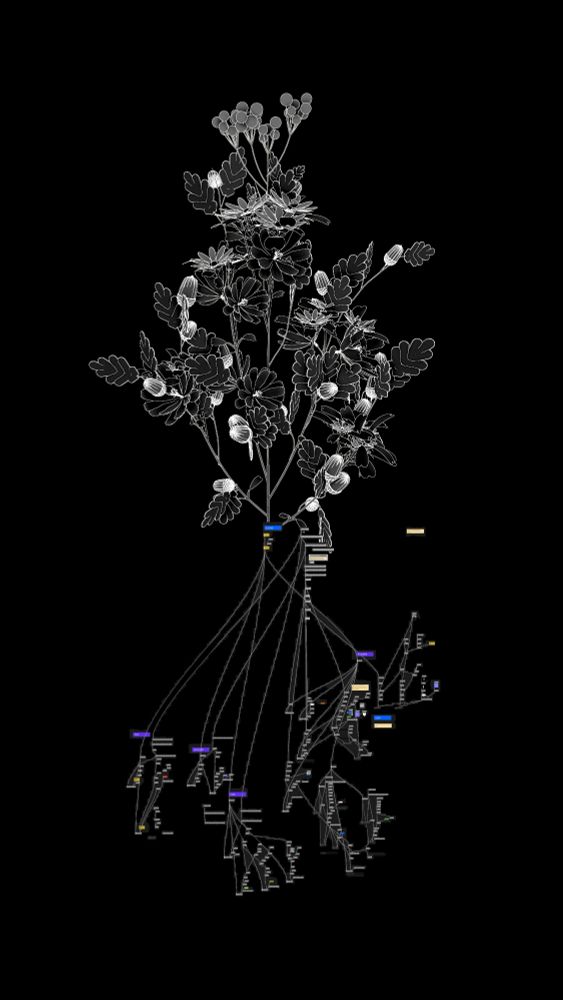
Graph as root of a procedural system.


December 6, 2024 at 2:05 PM
Graph as root of a procedural system.
Reposted by Juan Carlos Ramírez

One of the most challenging projects I've worked on since joining Reuters. Despite warnings from the world’s hunger watchdog of an impending catastrophe in Sudan, famine struck anyway. www.reuters.com/graphics/FAM...
December 5, 2024 at 12:11 PM
One of the most challenging projects I've worked on since joining Reuters. Despite warnings from the world’s hunger watchdog of an impending catastrophe in Sudan, famine struck anyway. www.reuters.com/graphics/FAM...
Reposted by Juan Carlos Ramírez
🔥 ¿Cómo el incendio de un apartamento se convirtió en una tragedia que envolvió un edificio entero en Valencia y mató a 10 personas?
Lo que pasó en Valencia también ocurrió en la Torre Grenfell, en Londres, en el que murieron 72 personas. Aquí el por qué. 👇
www.reuters.com/graphics/BUI...
Lo que pasó en Valencia también ocurrió en la Torre Grenfell, en Londres, en el que murieron 72 personas. Aquí el por qué. 👇
www.reuters.com/graphics/BUI...

Edificios envueltos en gasolina solida
A pesar de las muertes de Grenfell y El Campanar, en muchos países la normativa no obliga a retirar los polímeros inflamables de las fachadas
www.reuters.com
December 3, 2024 at 11:08 PM
🔥 ¿Cómo el incendio de un apartamento se convirtió en una tragedia que envolvió un edificio entero en Valencia y mató a 10 personas?
Lo que pasó en Valencia también ocurrió en la Torre Grenfell, en Londres, en el que murieron 72 personas. Aquí el por qué. 👇
www.reuters.com/graphics/BUI...
Lo que pasó en Valencia también ocurrió en la Torre Grenfell, en Londres, en el que murieron 72 personas. Aquí el por qué. 👇
www.reuters.com/graphics/BUI...
Reposted by Juan Carlos Ramírez

Hoy publicamos de nuevo la versión papel del aniversario del FC Barcelona.
Hilo con los gráficos realizados por Vanesa Mauri y el equipo de infografía de Mundo Deportivo
Hilo con los gráficos realizados por Vanesa Mauri y el equipo de infografía de Mundo Deportivo

December 4, 2024 at 11:31 AM
Hoy publicamos de nuevo la versión papel del aniversario del FC Barcelona.
Hilo con los gráficos realizados por Vanesa Mauri y el equipo de infografía de Mundo Deportivo
Hilo con los gráficos realizados por Vanesa Mauri y el equipo de infografía de Mundo Deportivo
Reposted by Juan Carlos Ramírez
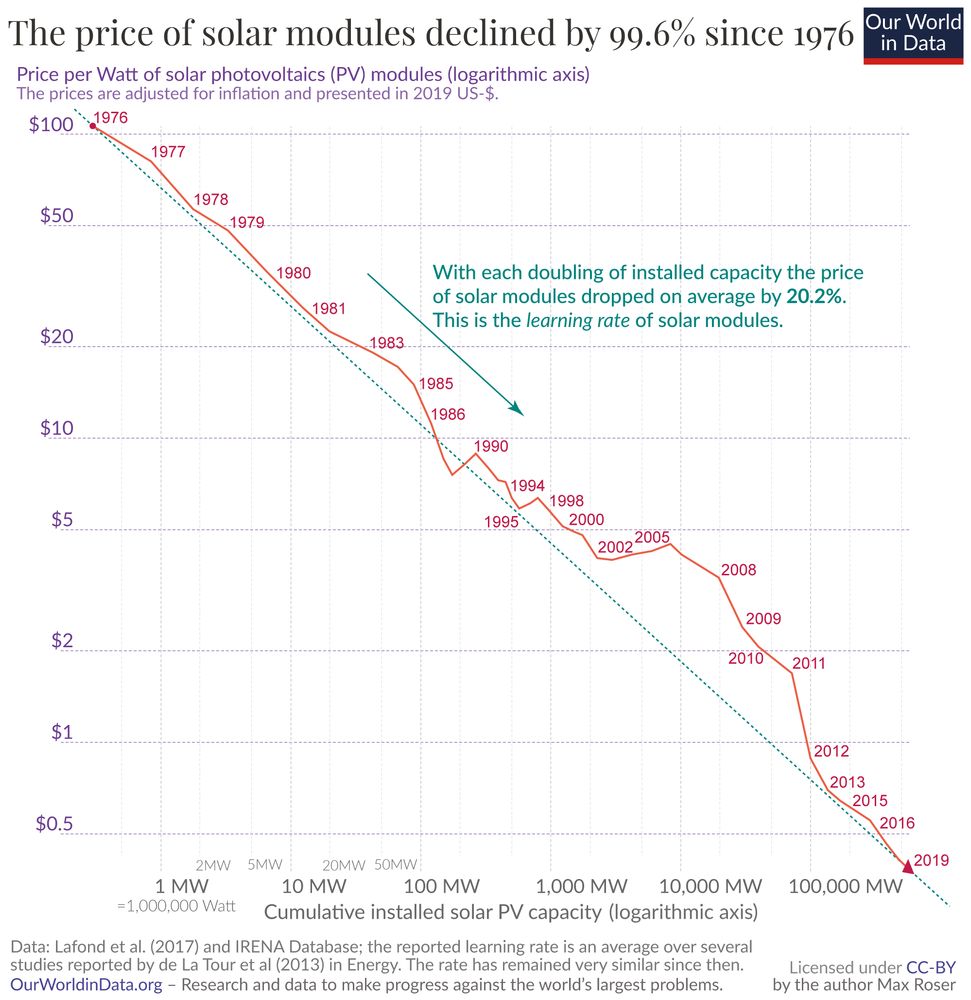
In most places in the world, power from new renewables is now cheaper than power from new fossil fuels.
Why did renewables become so cheap so fast?
The answer: learning curves.
Why did renewables become so cheap so fast?
The answer: learning curves.
December 4, 2024 at 12:32 PM
In most places in the world, power from new renewables is now cheaper than power from new fossil fuels.
Why did renewables become so cheap so fast?
The answer: learning curves.
Why did renewables become so cheap so fast?
The answer: learning curves.
Reposted by Juan Carlos Ramírez

Poco a poco vamos creando herramientas con mis panas @congosto.bsky.social y @barripdmx.bsky.social (qué haría yo sin ellos.. a veces pienso que me han adoptado por la cuota de discapacitados)
Ahora en serio, hacemos cosas como visiones de nuestras comunidades en #Bluesky
Esta es la de mis seguidos
Ahora en serio, hacemos cosas como visiones de nuestras comunidades en #Bluesky
Esta es la de mis seguidos

December 4, 2024 at 12:32 PM
Poco a poco vamos creando herramientas con mis panas @congosto.bsky.social y @barripdmx.bsky.social (qué haría yo sin ellos.. a veces pienso que me han adoptado por la cuota de discapacitados)
Ahora en serio, hacemos cosas como visiones de nuestras comunidades en #Bluesky
Esta es la de mis seguidos
Ahora en serio, hacemos cosas como visiones de nuestras comunidades en #Bluesky
Esta es la de mis seguidos
Reposted by Juan Carlos Ramírez

Where do our rivers flow to? Frequency of flow direction of main European rivers. You can see interesting things caused by geological factors. #geography #dataviz

December 3, 2024 at 8:19 AM
Where do our rivers flow to? Frequency of flow direction of main European rivers. You can see interesting things caused by geological factors. #geography #dataviz
Reposted by Juan Carlos Ramírez

We asked people in 8 countries whether they thought different types of platforms were biased.
As the chart shows, their responses varied widely by country. In Brazil, Spain, South Korea, and the US, more people think platforms are biased than not
reutersinstitute.politics.ox.ac.uk/what-do-peop...
As the chart shows, their responses varied widely by country. In Brazil, Spain, South Korea, and the US, more people think platforms are biased than not
reutersinstitute.politics.ox.ac.uk/what-do-peop...

December 4, 2024 at 2:07 PM
We asked people in 8 countries whether they thought different types of platforms were biased.
As the chart shows, their responses varied widely by country. In Brazil, Spain, South Korea, and the US, more people think platforms are biased than not
reutersinstitute.politics.ox.ac.uk/what-do-peop...
As the chart shows, their responses varied widely by country. In Brazil, Spain, South Korea, and the US, more people think platforms are biased than not
reutersinstitute.politics.ox.ac.uk/what-do-peop...
Reposted by Juan Carlos Ramírez

It's the final week of the #30DayMapChallenge! 🗾🗺️📍 Explore the latest Data Vis Dispatch to discover our favorites, along with many more maps and other visualizations.
👉 https://blog.datawrapper.de/data-vis-dispatch-december-3-2024/
👉 https://blog.datawrapper.de/data-vis-dispatch-december-3-2024/


December 3, 2024 at 4:50 PM
It's the final week of the #30DayMapChallenge! 🗾🗺️📍 Explore the latest Data Vis Dispatch to discover our favorites, along with many more maps and other visualizations.
👉 https://blog.datawrapper.de/data-vis-dispatch-december-3-2024/
👉 https://blog.datawrapper.de/data-vis-dispatch-december-3-2024/
Reposted by Juan Carlos Ramírez

NEW: A look at what connects Trump's new staff picks => www.nytimes.com/interactive/...

December 3, 2024 at 2:07 PM
NEW: A look at what connects Trump's new staff picks => www.nytimes.com/interactive/...
Reposted by Juan Carlos Ramírez
Major AI Large Language Models (LLMs) ranked by capabilities (MMLU)
interactive https://informationisbeautiful.net/visualizations/the-rise-of-generative-ai-large-language-models-llms-like-chatgpt/
interactive https://informationisbeautiful.net/visualizations/the-rise-of-generative-ai-large-language-models-llms-like-chatgpt/

November 6, 2024 at 3:55 PM
Major AI Large Language Models (LLMs) ranked by capabilities (MMLU)
interactive https://informationisbeautiful.net/visualizations/the-rise-of-generative-ai-large-language-models-llms-like-chatgpt/
interactive https://informationisbeautiful.net/visualizations/the-rise-of-generative-ai-large-language-models-llms-like-chatgpt/
Reposted by Juan Carlos Ramírez
The world's greatest novels, according to 15+ book polls, awards, prizes & lists. How many have you read?
interactive https://bit.ly/IIB-Novels
poster https://bit.ly/Novels-Poster
interactive https://bit.ly/IIB-Novels
poster https://bit.ly/Novels-Poster

November 13, 2024 at 5:55 PM
The world's greatest novels, according to 15+ book polls, awards, prizes & lists. How many have you read?
interactive https://bit.ly/IIB-Novels
poster https://bit.ly/Novels-Poster
interactive https://bit.ly/IIB-Novels
poster https://bit.ly/Novels-Poster
Reposted by Juan Carlos Ramírez
Every film, everywhere, all at once. An oeuvrexplorer for @A24 - one of our fave movie studios
https://informationisbeautiful.net/visualizations/a24-movie-browser/
https://informationisbeautiful.net/visualizations/a24-movie-browser/

November 21, 2024 at 11:55 PM
Every film, everywhere, all at once. An oeuvrexplorer for @A24 - one of our fave movie studios
https://informationisbeautiful.net/visualizations/a24-movie-browser/
https://informationisbeautiful.net/visualizations/a24-movie-browser/
Reposted by Juan Carlos Ramírez

In this talk, Dea Bankova will share how to gradually develop your data viz coding skills through personal projects that are both challenging and manageable. Register: www.eventbrite.com/e/qa-with-an... 📊

November 21, 2024 at 6:53 PM
In this talk, Dea Bankova will share how to gradually develop your data viz coding skills through personal projects that are both challenging and manageable. Register: www.eventbrite.com/e/qa-with-an... 📊
Reposted by Juan Carlos Ramírez

Outstanding data viz of China's auto sales in Asia. Speaking locally: very evident in Singapore how much market share BYD in particular is gaining www.bloomberg.com/graphics/202... #energysky

November 27, 2024 at 1:27 AM
Outstanding data viz of China's auto sales in Asia. Speaking locally: very evident in Singapore how much market share BYD in particular is gaining www.bloomberg.com/graphics/202... #energysky
Reposted by Juan Carlos Ramírez

Due to demand more places have been opened up for tomorrow's live 'Explore Explain' webinar session discussing the state of data viz.
Kicks off at 9am (GMT) and is open to anyone to join live, with the recordings published soon as podcast/video episodes.
www.eventbrite.co.uk/e/explore-ex...
Kicks off at 9am (GMT) and is open to anyone to join live, with the recordings published soon as podcast/video episodes.
www.eventbrite.co.uk/e/explore-ex...

Explore Explain Live!
Welcome to the first-ever Explore Explain Live! Join Andy Kirk as he explores the state of data visualisation with the help of 5 ace guests
www.eventbrite.co.uk
December 3, 2024 at 8:14 AM
Due to demand more places have been opened up for tomorrow's live 'Explore Explain' webinar session discussing the state of data viz.
Kicks off at 9am (GMT) and is open to anyone to join live, with the recordings published soon as podcast/video episodes.
www.eventbrite.co.uk/e/explore-ex...
Kicks off at 9am (GMT) and is open to anyone to join live, with the recordings published soon as podcast/video episodes.
www.eventbrite.co.uk/e/explore-ex...
Reposted by Juan Carlos Ramírez

i'm a dataviz designer at the @euiss.bsky.social (an EU agency dealing with foreign, security and defense policy). imet some of you at either Outlier, Info+ or 2CO in recent years.
i made this atlas of relations between the European Union and the African Union 👇
www.iss.europa.eu/content/afri...
i made this atlas of relations between the European Union and the African Union 👇
www.iss.europa.eu/content/afri...
December 3, 2024 at 10:31 AM
i'm a dataviz designer at the @euiss.bsky.social (an EU agency dealing with foreign, security and defense policy). imet some of you at either Outlier, Info+ or 2CO in recent years.
i made this atlas of relations between the European Union and the African Union 👇
www.iss.europa.eu/content/afri...
i made this atlas of relations between the European Union and the African Union 👇
www.iss.europa.eu/content/afri...