


Jan Kabatek 🇺🇦
@jankabatek.com
Applied economist at the University of Melbourne.
www.jankabatek.com
www.jankabatek.com
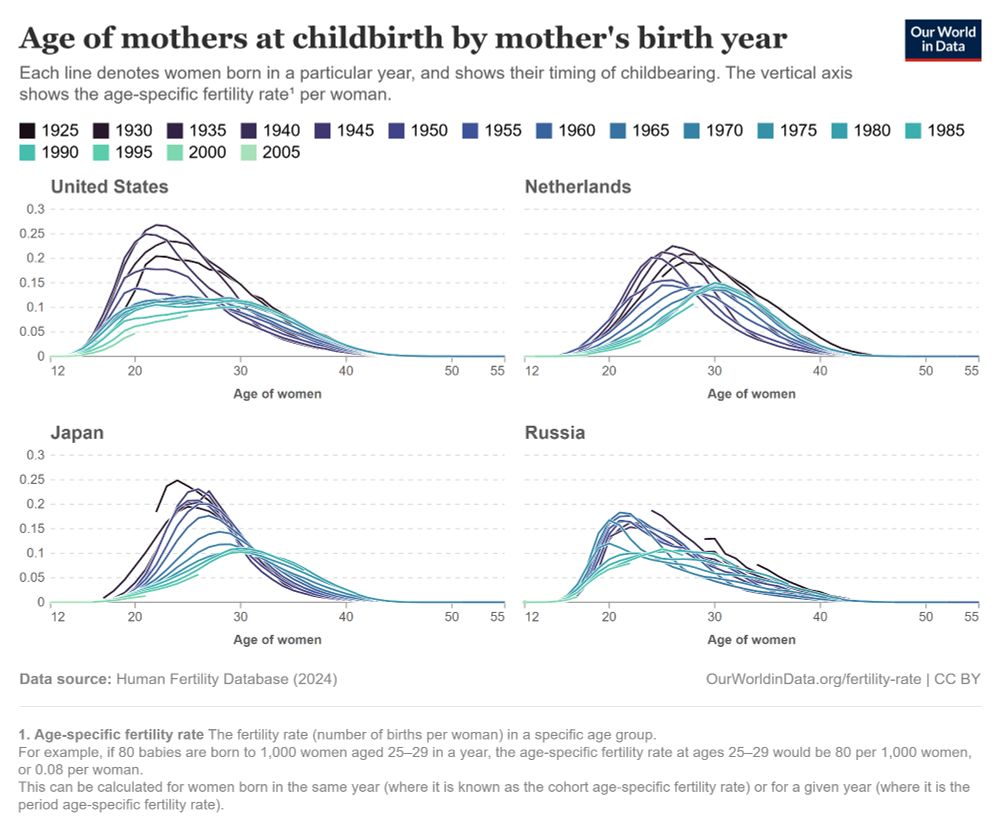
A really neat article on fertility:
ourworldindata.org/total-fertil...
Charts out the fertility dynamics and explains the complicated relationships between different statistical measures, such as TFR and CCFR.
ourworldindata.org/total-fertil...
Charts out the fertility dynamics and explains the complicated relationships between different statistical measures, such as TFR and CCFR.
October 2, 2025 at 2:15 AM
A really neat article on fertility:
ourworldindata.org/total-fertil...
Charts out the fertility dynamics and explains the complicated relationships between different statistical measures, such as TFR and CCFR.
ourworldindata.org/total-fertil...
Charts out the fertility dynamics and explains the complicated relationships between different statistical measures, such as TFR and CCFR.
This indicator is extremely useful. One can easily track the latent drivers of poverty, and evaluate which ones are becoming more important over time 📈

September 8, 2025 at 12:23 AM
This indicator is extremely useful. One can easily track the latent drivers of poverty, and evaluate which ones are becoming more important over time 📈
And that's a wrap of the 2025 Labour Econometrics Workshop 😊
We've seen great presentations, inspiring keynotes, and all the flavours of Melbourne weather 🌈
Thank you everyone for making this year extra special! ❤️
We've seen great presentations, inspiring keynotes, and all the flavours of Melbourne weather 🌈
Thank you everyone for making this year extra special! ❤️


August 18, 2025 at 2:37 AM
And that's a wrap of the 2025 Labour Econometrics Workshop 😊
We've seen great presentations, inspiring keynotes, and all the flavours of Melbourne weather 🌈
Thank you everyone for making this year extra special! ❤️
We've seen great presentations, inspiring keynotes, and all the flavours of Melbourne weather 🌈
Thank you everyone for making this year extra special! ❤️
Furthermore, we have experienced a 15% spike in divorce rates in 2021.
This was also likely fueled by the lockdowns. The spike came in 2021 (not in 2020), because Australia mandates 12-month separation period prior to divorce.
This was also likely fueled by the lockdowns. The spike came in 2021 (not in 2020), because Australia mandates 12-month separation period prior to divorce.

August 5, 2025 at 12:34 AM
Furthermore, we have experienced a 15% spike in divorce rates in 2021.
This was also likely fueled by the lockdowns. The spike came in 2021 (not in 2020), because Australia mandates 12-month separation period prior to divorce.
This was also likely fueled by the lockdowns. The spike came in 2021 (not in 2020), because Australia mandates 12-month separation period prior to divorce.
During Covid, Australian marriage rate went down by 35%. This reflected:
1) many couples with marriage intentions waiting out the lockdowns
2) decline in relationship formation during lockdowns
1) many couples with marriage intentions waiting out the lockdowns
2) decline in relationship formation during lockdowns

August 5, 2025 at 12:34 AM
During Covid, Australian marriage rate went down by 35%. This reflected:
1) many couples with marriage intentions waiting out the lockdowns
2) decline in relationship formation during lockdowns
1) many couples with marriage intentions waiting out the lockdowns
2) decline in relationship formation during lockdowns
FWIW, Joop et al's work is accredited in the author's reanalysis
link.springer.com/article/10.1...
link.springer.com/article/10.1...


July 1, 2025 at 9:18 AM
FWIW, Joop et al's work is accredited in the author's reanalysis
link.springer.com/article/10.1...
link.springer.com/article/10.1...

. 𝒓𝒆́𝒈 𝒚 𝒔𝒖𝒓 𝒙, 𝒓𝒐𝒃𝒖𝒔𝒕𝒆
April 9, 2025 at 7:46 AM
. 𝒓𝒆́𝒈 𝒚 𝒔𝒖𝒓 𝒙, 𝒓𝒐𝒃𝒖𝒔𝒕𝒆
à propos of nothing, here's a little #Stata script that sets up a standardized folder structure for new research projects (inspired by @asjadnaqvi.bsky.social)
💾 LINK: jankabatek.com/stata/folder...
💾 LINK: jankabatek.com/stata/folder...


January 16, 2025 at 6:51 AM
à propos of nothing, here's a little #Stata script that sets up a standardized folder structure for new research projects (inspired by @asjadnaqvi.bsky.social)
💾 LINK: jankabatek.com/stata/folder...
💾 LINK: jankabatek.com/stata/folder...
I did not go up to 20M, but this should give you an idea... (normal reg obviously runs out of memory)
I have not looked into the guts of these methods, but I am fairly confident that they use the same FWL matrix transformations, which do not get much more intensive as the number of FEs grows
I have not looked into the guts of these methods, but I am fairly confident that they use the same FWL matrix transformations, which do not get much more intensive as the number of FEs grows

December 4, 2024 at 4:07 AM
I did not go up to 20M, but this should give you an idea... (normal reg obviously runs out of memory)
I have not looked into the guts of these methods, but I am fairly confident that they use the same FWL matrix transformations, which do not get much more intensive as the number of FEs grows
I have not looked into the guts of these methods, but I am fairly confident that they use the same FWL matrix transformations, which do not get much more intensive as the number of FEs grows
The GTOOLS picture was rendered weird... here is the right one:

December 3, 2024 at 7:23 AM
The GTOOLS picture was rendered weird... here is the right one:
The GTOOLS picture was rendered weird... here is the right one:
December 3, 2024 at 7:22 AM
The GTOOLS picture was rendered weird... here is the right one:
✔️ So consider using my command 𝐞𝐱𝐩𝐚𝐧𝐝𝐫𝐚𝐧𝐤, which is 20-30x faster and free of redundancies:
. net install expandrank, from("https://jankabatek.com/stata/expandrank/") replace
. sysuse cancer, clear
. drop _*
. expandrank studytime, name(time_disc) fast
. net install expandrank, from("https://jankabatek.com/stata/expandrank/") replace
. sysuse cancer, clear
. drop _*
. expandrank studytime, name(time_disc) fast

December 3, 2024 at 7:18 AM
✔️ So consider using my command 𝐞𝐱𝐩𝐚𝐧𝐝𝐫𝐚𝐧𝐤, which is 20-30x faster and free of redundancies:
. net install expandrank, from("https://jankabatek.com/stata/expandrank/") replace
. sysuse cancer, clear
. drop _*
. expandrank studytime, name(time_disc) fast
. net install expandrank, from("https://jankabatek.com/stata/expandrank/") replace
. sysuse cancer, clear
. drop _*
. expandrank studytime, name(time_disc) fast
Note that the relative performance depends *𝐜𝐫𝐢𝐭𝐢𝐜𝐚𝐥𝐥𝐲* on the size of your dataset (see the pictures below).
👉 𝐫𝐞𝐠𝐡𝐝𝐟𝐞𝐣𝐥 performs particularly well in big datasets (10M+), but badly in small ones.
(FWIW, I don't know why the factorized regressions are subject to that structural break 📉)
👉 𝐫𝐞𝐠𝐡𝐝𝐟𝐞𝐣𝐥 performs particularly well in big datasets (10M+), but badly in small ones.
(FWIW, I don't know why the factorized regressions are subject to that structural break 📉)


December 3, 2024 at 7:18 AM
Note that the relative performance depends *𝐜𝐫𝐢𝐭𝐢𝐜𝐚𝐥𝐥𝐲* on the size of your dataset (see the pictures below).
👉 𝐫𝐞𝐠𝐡𝐝𝐟𝐞𝐣𝐥 performs particularly well in big datasets (10M+), but badly in small ones.
(FWIW, I don't know why the factorized regressions are subject to that structural break 📉)
👉 𝐫𝐞𝐠𝐡𝐝𝐟𝐞𝐣𝐥 performs particularly well in big datasets (10M+), but badly in small ones.
(FWIW, I don't know why the factorized regressions are subject to that structural break 📉)
👇 The chart below illustrates the relative performance of the aforementioned regression approaches in a scenario with 1M observations and a variable number of fixed effects.
🖥️ My hardware specs: i7-8700 (8 cores), 16GB RAM, no GPU processing, OS Win11
🖥️ My hardware specs: i7-8700 (8 cores), 16GB RAM, no GPU processing, OS Win11

December 3, 2024 at 7:18 AM
👇 The chart below illustrates the relative performance of the aforementioned regression approaches in a scenario with 1M observations and a variable number of fixed effects.
🖥️ My hardware specs: i7-8700 (8 cores), 16GB RAM, no GPU processing, OS Win11
🖥️ My hardware specs: i7-8700 (8 cores), 16GB RAM, no GPU processing, OS Win11
1 ) 𝐆𝐓𝐎𝐎𝐋𝐒 for the win!
First and foremost, embrace the 𝐆𝐓𝐎𝐎𝐋𝐒 suite by @mcaceresb.bsky.social
. ssc install gtools
Mauricio created many blazing-fast alternatives to Stata's native commands. If you're not using them, you're missing out!
Also, he is on the market 💪
First and foremost, embrace the 𝐆𝐓𝐎𝐎𝐋𝐒 suite by @mcaceresb.bsky.social
. ssc install gtools
Mauricio created many blazing-fast alternatives to Stata's native commands. If you're not using them, you're missing out!
Also, he is on the market 💪

December 3, 2024 at 7:18 AM
The reference was to this figure... though now I realise that "p" used here probably means something else than p-values...?

November 29, 2024 at 12:44 PM
The reference was to this figure... though now I realise that "p" used here probably means something else than p-values...?
Celebrating our successful ARC Discovery bid 🥳
Huge thank you goes to Vincent Mancini for being the driving force behind this exciting project!
Huge thank you goes to Vincent Mancini for being the driving force behind this exciting project!


November 26, 2024 at 2:59 AM
Celebrating our successful ARC Discovery bid 🥳
Huge thank you goes to Vincent Mancini for being the driving force behind this exciting project!
Huge thank you goes to Vincent Mancini for being the driving force behind this exciting project!
Conditional colouring (introduced only in Stata 18 ❗) can be used to distinguish significant and insignificant coefficient estimates in 𝗰𝗼𝗲𝗳𝗽𝗹𝗼𝘁 👍
. sysuse auto, clear
. reg trunk i.rep78
. gen COL=0 in 1/5
. replace COL=1 in 2
. replace COL=1 in 5
. coefplot, recast(bar) colorvar(COL) citop
. sysuse auto, clear
. reg trunk i.rep78
. gen COL=0 in 1/5
. replace COL=1 in 2
. replace COL=1 in 5
. coefplot, recast(bar) colorvar(COL) citop

November 20, 2024 at 12:54 AM
Conditional colouring (introduced only in Stata 18 ❗) can be used to distinguish significant and insignificant coefficient estimates in 𝗰𝗼𝗲𝗳𝗽𝗹𝗼𝘁 👍
. sysuse auto, clear
. reg trunk i.rep78
. gen COL=0 in 1/5
. replace COL=1 in 2
. replace COL=1 in 5
. coefplot, recast(bar) colorvar(COL) citop
. sysuse auto, clear
. reg trunk i.rep78
. gen COL=0 in 1/5
. replace COL=1 in 2
. replace COL=1 in 5
. coefplot, recast(bar) colorvar(COL) citop
Or just show the full picture... 🤷♂️

November 15, 2024 at 11:21 AM
Or just show the full picture... 🤷♂️
Add the vertical axis line with the -//- symbol (denoting cropped scaling) for extra style points... 👍

November 15, 2024 at 11:21 AM
Add the vertical axis line with the -//- symbol (denoting cropped scaling) for extra style points... 👍
To appreciate this, let's crop the lower range of the y-axis a bit more.
The grid no longer splits the chart into equal segments, and the position of the lowest gridline cues the reader to the fact that the x-axis is unlikely to coincide with zero.
The visual becomes immediately less deceptive ✔️
The grid no longer splits the chart into equal segments, and the position of the lowest gridline cues the reader to the fact that the x-axis is unlikely to coincide with zero.
The visual becomes immediately less deceptive ✔️

November 15, 2024 at 11:21 AM
To appreciate this, let's crop the lower range of the y-axis a bit more.
The grid no longer splits the chart into equal segments, and the position of the lowest gridline cues the reader to the fact that the x-axis is unlikely to coincide with zero.
The visual becomes immediately less deceptive ✔️
The grid no longer splits the chart into equal segments, and the position of the lowest gridline cues the reader to the fact that the x-axis is unlikely to coincide with zero.
The visual becomes immediately less deceptive ✔️
Amusing as it is, I don't like this chart.
Here's why 👇
Here's why 👇

November 15, 2024 at 11:21 AM
Amusing as it is, I don't like this chart.
Here's why 👇
Here's why 👇
Extremely happy to learn that my Honours student Max Yong has secured the John Monash Scholarship to pursue his postgraduate degree at Harvard Kennedy School
🥳
johnmonash.com/contact/find...
🥳
johnmonash.com/contact/find...

October 30, 2024 at 4:16 AM
Extremely happy to learn that my Honours student Max Yong has secured the John Monash Scholarship to pursue his postgraduate degree at Harvard Kennedy School
🥳
johnmonash.com/contact/find...
🥳
johnmonash.com/contact/find...