


T-R-I
@inside-tri.bsky.social
We turn complexity into clarity. Here’s what that looks like, day by day. Our agency diary, in public. Trusted by 50+ clients. New York/Paris. www.t-r-i.net
🚀 Brand Launch
Tachyon Impact Solutions: To Catch a Thief.
Unique and patented technology behind verifying and authenticating any physical object
🔗 tachyonimpactsolutions.com
Brand + web design by
@inside-tri.bsky.social
#LouvreRobbery #LouvreHeist #CambriolageLouvre #ArtCrime
Tachyon Impact Solutions: To Catch a Thief.
Unique and patented technology behind verifying and authenticating any physical object
🔗 tachyonimpactsolutions.com
Brand + web design by
@inside-tri.bsky.social
#LouvreRobbery #LouvreHeist #CambriolageLouvre #ArtCrime

October 20, 2025 at 8:35 PM
🚀 Brand Launch
Tachyon Impact Solutions: To Catch a Thief.
Unique and patented technology behind verifying and authenticating any physical object
🔗 tachyonimpactsolutions.com
Brand + web design by
@inside-tri.bsky.social
#LouvreRobbery #LouvreHeist #CambriolageLouvre #ArtCrime
Tachyon Impact Solutions: To Catch a Thief.
Unique and patented technology behind verifying and authenticating any physical object
🔗 tachyonimpactsolutions.com
Brand + web design by
@inside-tri.bsky.social
#LouvreRobbery #LouvreHeist #CambriolageLouvre #ArtCrime
AI Meets Office Workflows: Claude’s New Document Powers 🧵:
September 10, 2025 at 8:22 PM
AI Meets Office Workflows: Claude’s New Document Powers 🧵:
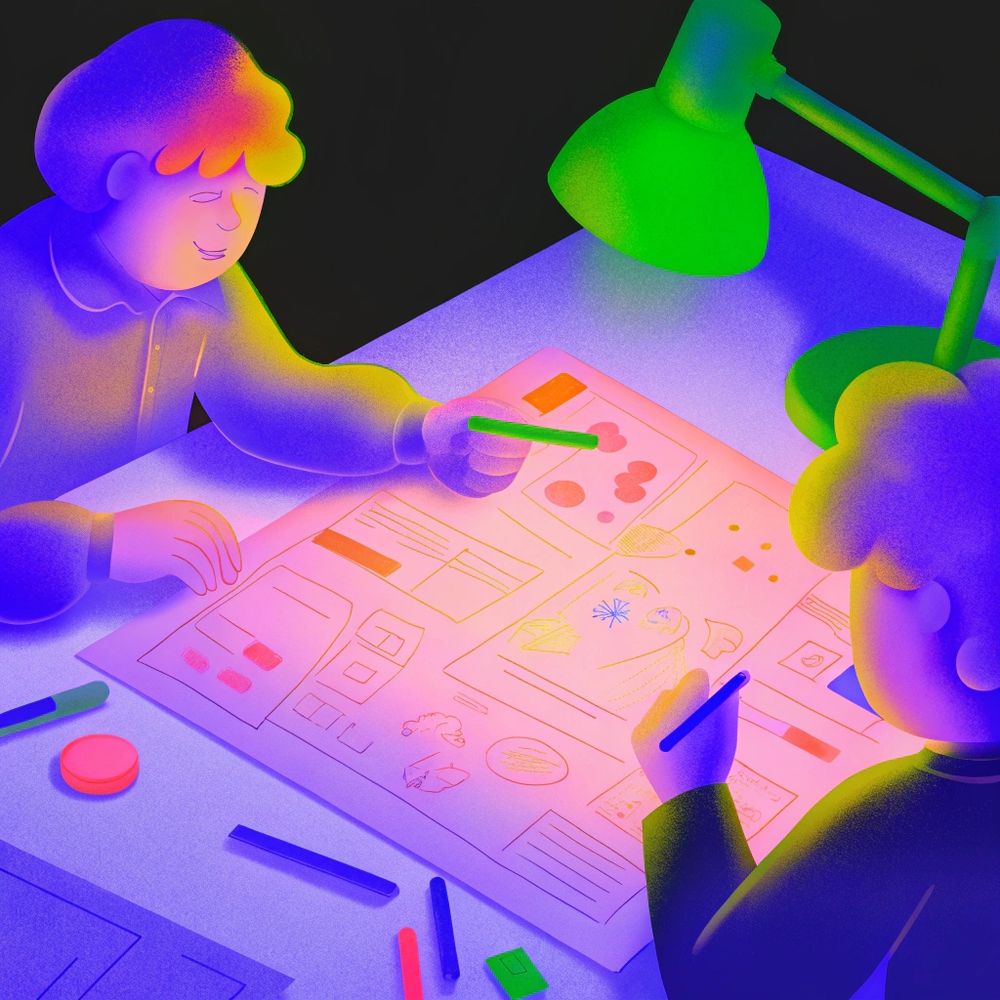
Clarity isn’t decoration. It’s strategy. Every strong presentation starts by making complexity usable.

September 3, 2025 at 8:35 PM
Clarity isn’t decoration. It’s strategy. Every strong presentation starts by making complexity usable.
Your deck shouldn’t feel like homework.
It should feel like an opportunity.
We design visuals that make complex ideas simple and impossible to ignore.
It should feel like an opportunity.
We design visuals that make complex ideas simple and impossible to ignore.
August 21, 2025 at 11:22 PM
Your deck shouldn’t feel like homework.
It should feel like an opportunity.
We design visuals that make complex ideas simple and impossible to ignore.
It should feel like an opportunity.
We design visuals that make complex ideas simple and impossible to ignore.
5️⃣ Embrace purpose-led branding
Aligning your story with social or environmental values can deepen audience connection and even transform promotional costs into profits. Successful examples: Marvel’s unified branding and BMW’s featured vehicles in Black Widow.
Aligning your story with social or environmental values can deepen audience connection and even transform promotional costs into profits. Successful examples: Marvel’s unified branding and BMW’s featured vehicles in Black Widow.

July 28, 2025 at 6:53 PM
5️⃣ Embrace purpose-led branding
Aligning your story with social or environmental values can deepen audience connection and even transform promotional costs into profits. Successful examples: Marvel’s unified branding and BMW’s featured vehicles in Black Widow.
Aligning your story with social or environmental values can deepen audience connection and even transform promotional costs into profits. Successful examples: Marvel’s unified branding and BMW’s featured vehicles in Black Widow.
4️⃣ Activate co-branding partnerships
Films boost visibility by aligning with consumer products. For 2024’s Wicked, Crocs released themed clogs, Stanley created special tumblers, and R.E.M. Beauty launched makeup - all timed with the film's release.
Films boost visibility by aligning with consumer products. For 2024’s Wicked, Crocs released themed clogs, Stanley created special tumblers, and R.E.M. Beauty launched makeup - all timed with the film's release.

July 28, 2025 at 6:53 PM
4️⃣ Activate co-branding partnerships
Films boost visibility by aligning with consumer products. For 2024’s Wicked, Crocs released themed clogs, Stanley created special tumblers, and R.E.M. Beauty launched makeup - all timed with the film's release.
Films boost visibility by aligning with consumer products. For 2024’s Wicked, Crocs released themed clogs, Stanley created special tumblers, and R.E.M. Beauty launched makeup - all timed with the film's release.
3️⃣ Integrate branded entertainment and placements
Effective branded entertainment entertains first. Lego Masters, co-produced with LEGO Group, blends competition with product showcasing. Show products in use, not just as background props.
Effective branded entertainment entertains first. Lego Masters, co-produced with LEGO Group, blends competition with product showcasing. Show products in use, not just as background props.

July 28, 2025 at 6:53 PM
3️⃣ Integrate branded entertainment and placements
Effective branded entertainment entertains first. Lego Masters, co-produced with LEGO Group, blends competition with product showcasing. Show products in use, not just as background props.
Effective branded entertainment entertains first. Lego Masters, co-produced with LEGO Group, blends competition with product showcasing. Show products in use, not just as background props.
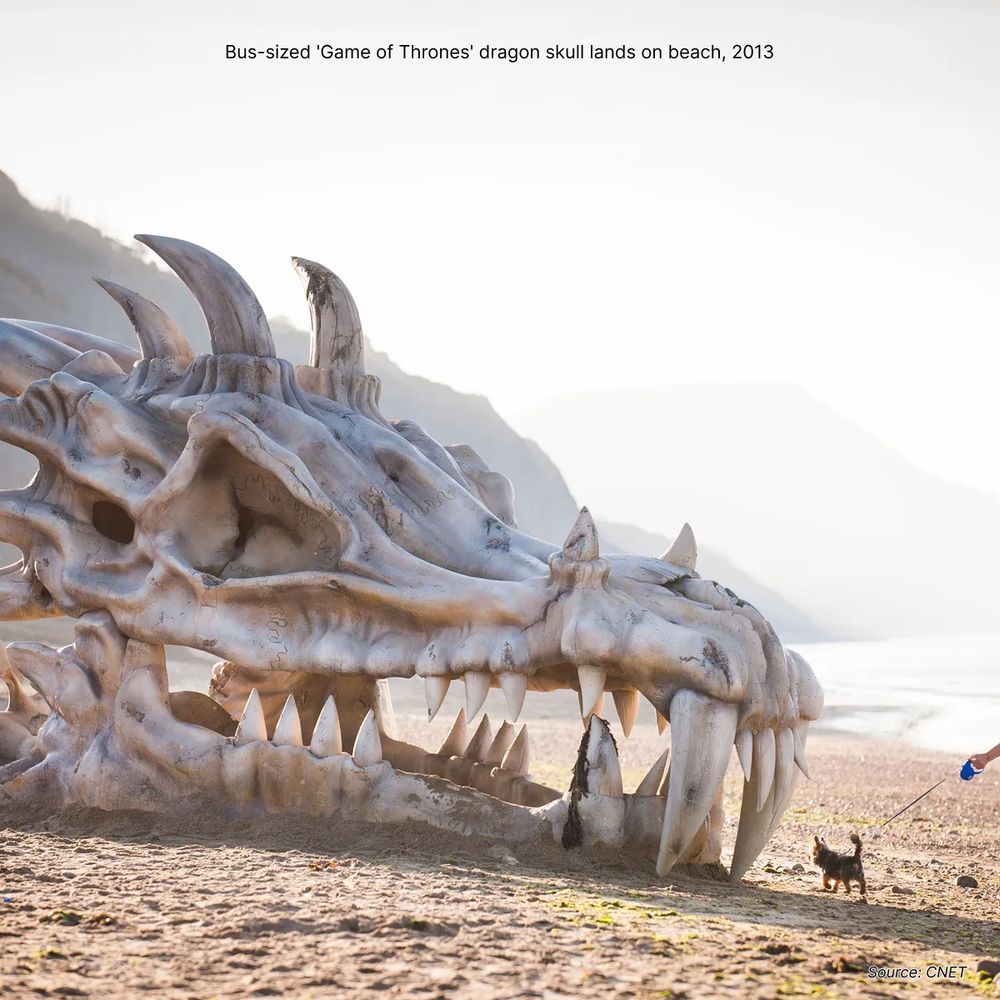
2️⃣ Leverage cross-platform #digital campaigns
Today’s audience lives online. Combine microsites, social media, and pre-roll ads. Example: Game of Thrones’ giant "dragon skull" stunt or Lionsgate’s Capitol TV videos driving massive online engagement.
Today’s audience lives online. Combine microsites, social media, and pre-roll ads. Example: Game of Thrones’ giant "dragon skull" stunt or Lionsgate’s Capitol TV videos driving massive online engagement.
July 28, 2025 at 6:53 PM
2️⃣ Leverage cross-platform #digital campaigns
Today’s audience lives online. Combine microsites, social media, and pre-roll ads. Example: Game of Thrones’ giant "dragon skull" stunt or Lionsgate’s Capitol TV videos driving massive online engagement.
Today’s audience lives online. Combine microsites, social media, and pre-roll ads. Example: Game of Thrones’ giant "dragon skull" stunt or Lionsgate’s Capitol TV videos driving massive online engagement.
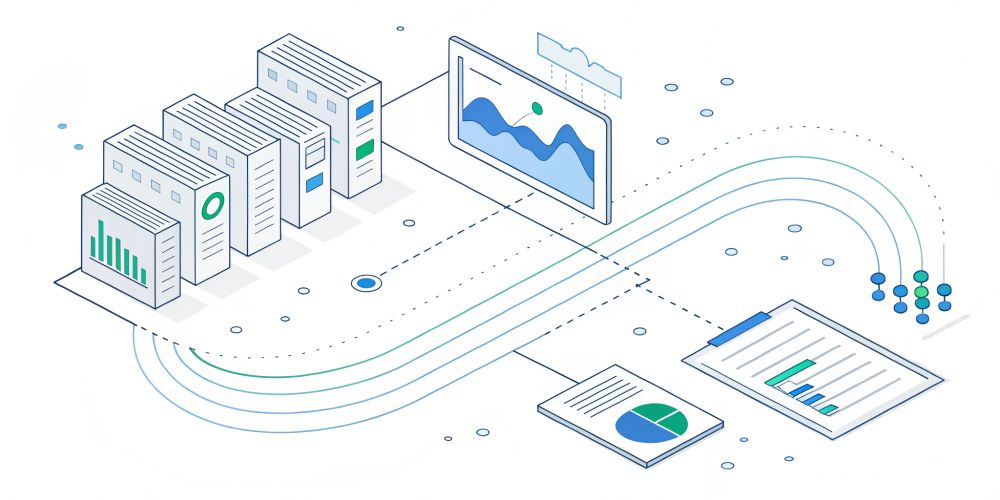
We blended dark-mode analytics slides with light-mode infographics - keeping the narrative tight and visually impactful. Motion layers ensured every stat landed with a “wow.”
#DesignThinking #DesignExcellence #DesignOfTheDay
#DesignThinking #DesignExcellence #DesignOfTheDay

July 14, 2025 at 2:54 PM
We blended dark-mode analytics slides with light-mode infographics - keeping the narrative tight and visually impactful. Motion layers ensured every stat landed with a “wow.”
#DesignThinking #DesignExcellence #DesignOfTheDay
#DesignThinking #DesignExcellence #DesignOfTheDay
2️⃣ Infographics & UX
– Clean, color-coded program statuses
– Intuitive navigation: campus → portfolio → program details
3️⃣ Motion Design
– Micro-animations to emphasize key numbers
– Seamless brand integration
#design #motiongraphics #visualization
– Clean, color-coded program statuses
– Intuitive navigation: campus → portfolio → program details
3️⃣ Motion Design
– Micro-animations to emphasize key numbers
– Seamless brand integration
#design #motiongraphics #visualization

July 14, 2025 at 2:51 PM
2️⃣ Infographics & UX
– Clean, color-coded program statuses
– Intuitive navigation: campus → portfolio → program details
3️⃣ Motion Design
– Micro-animations to emphasize key numbers
– Seamless brand integration
#design #motiongraphics #visualization
– Clean, color-coded program statuses
– Intuitive navigation: campus → portfolio → program details
3️⃣ Motion Design
– Micro-animations to emphasize key numbers
– Seamless brand integration
#design #motiongraphics #visualization
Key inputs:
• Raw data on programs & enrollment
• Brand guidelines & website assets
• Existing marketing collateral
Why it matters? A dynamic, data-driven narrative helps stakeholders see the “big picture” and buy in on the vision.
#DataVisualization #HigherEd #Fundraising #EdTech #DashboardDesign
• Raw data on programs & enrollment
• Brand guidelines & website assets
• Existing marketing collateral
Why it matters? A dynamic, data-driven narrative helps stakeholders see the “big picture” and buy in on the vision.
#DataVisualization #HigherEd #Fundraising #EdTech #DashboardDesign


July 10, 2025 at 8:17 PM
Key inputs:
• Raw data on programs & enrollment
• Brand guidelines & website assets
• Existing marketing collateral
Why it matters? A dynamic, data-driven narrative helps stakeholders see the “big picture” and buy in on the vision.
#DataVisualization #HigherEd #Fundraising #EdTech #DashboardDesign
• Raw data on programs & enrollment
• Brand guidelines & website assets
• Existing marketing collateral
Why it matters? A dynamic, data-driven narrative helps stakeholders see the “big picture” and buy in on the vision.
#DataVisualization #HigherEd #Fundraising #EdTech #DashboardDesign
Embrace heritage, license wisely, and let the logo do the talking.
We got inspired and explored the idea, TRI style.
Got Kodak?
#branding #visualart #design #designthinking
We got inspired and explored the idea, TRI style.
Got Kodak?
#branding #visualart #design #designthinking


July 10, 2025 at 12:05 AM
Embrace heritage, license wisely, and let the logo do the talking.
We got inspired and explored the idea, TRI style.
Got Kodak?
#branding #visualart #design #designthinking
We got inspired and explored the idea, TRI style.
Got Kodak?
#branding #visualart #design #designthinking
William Faulkner’s Absalom, Absalom! contains a 1,288-word sentence - a reminder that storytelling can stretch structure without losing meaning.
Sometimes impact isn’t about brevity.
It’s about rhythm, momentum, and voice.
#Writing #Storytelling #Narrative #TRIwork #infographics #BookNerds
Sometimes impact isn’t about brevity.
It’s about rhythm, momentum, and voice.
#Writing #Storytelling #Narrative #TRIwork #infographics #BookNerds

July 1, 2025 at 7:12 PM
William Faulkner’s Absalom, Absalom! contains a 1,288-word sentence - a reminder that storytelling can stretch structure without losing meaning.
Sometimes impact isn’t about brevity.
It’s about rhythm, momentum, and voice.
#Writing #Storytelling #Narrative #TRIwork #infographics #BookNerds
Sometimes impact isn’t about brevity.
It’s about rhythm, momentum, and voice.
#Writing #Storytelling #Narrative #TRIwork #infographics #BookNerds
We developed this infographic on self-publishing trends:
📈 30–34% of e-book sales
🏆 Indie titles now award-eligible
💰 1,600 authors earn $25K+ vs 1,200 traditionally
🎯 Avg book sells 250 copies
✍️ 50% of indie authors release 10+ books
#SelfPublishing #BookMarketing #PublishingTrends #IndieAuthors
📈 30–34% of e-book sales
🏆 Indie titles now award-eligible
💰 1,600 authors earn $25K+ vs 1,200 traditionally
🎯 Avg book sells 250 copies
✍️ 50% of indie authors release 10+ books
#SelfPublishing #BookMarketing #PublishingTrends #IndieAuthors

June 30, 2025 at 5:09 PM
We developed this infographic on self-publishing trends:
📈 30–34% of e-book sales
🏆 Indie titles now award-eligible
💰 1,600 authors earn $25K+ vs 1,200 traditionally
🎯 Avg book sells 250 copies
✍️ 50% of indie authors release 10+ books
#SelfPublishing #BookMarketing #PublishingTrends #IndieAuthors
📈 30–34% of e-book sales
🏆 Indie titles now award-eligible
💰 1,600 authors earn $25K+ vs 1,200 traditionally
🎯 Avg book sells 250 copies
✍️ 50% of indie authors release 10+ books
#SelfPublishing #BookMarketing #PublishingTrends #IndieAuthors
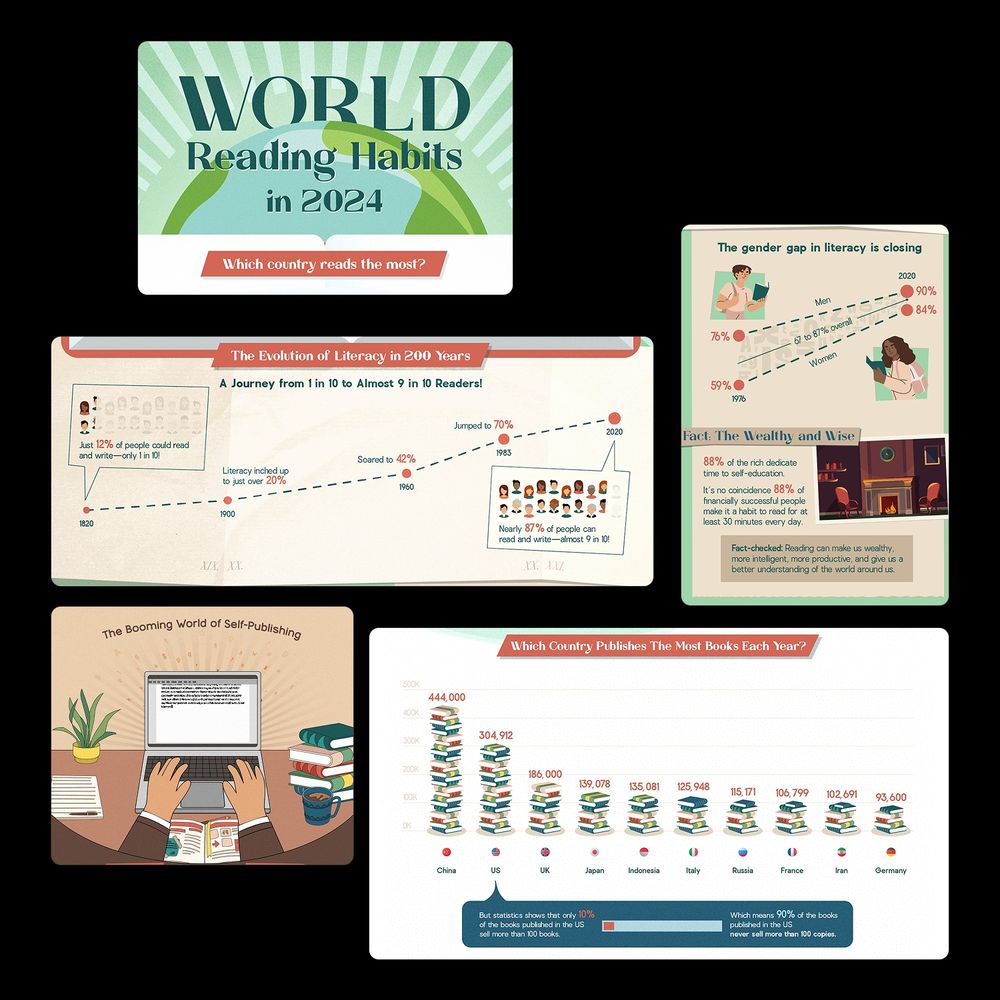
China publishes 444k books a year. The US? 305k.
But 90% of US books never sell more than 100 copies.
In a world flooded with content, it's not about more - it's about meaning.
📚
#publishing #books #dataviz #storytelling #infographic #TRIwork #booknerds
But 90% of US books never sell more than 100 copies.
In a world flooded with content, it's not about more - it's about meaning.
📚
#publishing #books #dataviz #storytelling #infographic #TRIwork #booknerds

June 26, 2025 at 10:46 PM
China publishes 444k books a year. The US? 305k.
But 90% of US books never sell more than 100 copies.
In a world flooded with content, it's not about more - it's about meaning.
📚
#publishing #books #dataviz #storytelling #infographic #TRIwork #booknerds
But 90% of US books never sell more than 100 copies.
In a world flooded with content, it's not about more - it's about meaning.
📚
#publishing #books #dataviz #storytelling #infographic #TRIwork #booknerds
🌍 How much time do people around the world spend reading?
We visualized the answer.
At TRI, we recently designed a series of infographics exploring global reading habits in 2024 - from weekly reading time and literacy rates to how reading boosts cognitive development #dataviz #booknerds #publishing
We visualized the answer.
At TRI, we recently designed a series of infographics exploring global reading habits in 2024 - from weekly reading time and literacy rates to how reading boosts cognitive development #dataviz #booknerds #publishing
June 26, 2025 at 12:56 AM
🌍 How much time do people around the world spend reading?
We visualized the answer.
At TRI, we recently designed a series of infographics exploring global reading habits in 2024 - from weekly reading time and literacy rates to how reading boosts cognitive development #dataviz #booknerds #publishing
We visualized the answer.
At TRI, we recently designed a series of infographics exploring global reading habits in 2024 - from weekly reading time and literacy rates to how reading boosts cognitive development #dataviz #booknerds #publishing
We’ve been working on a capability deck for a while now (okay, weeks). The first one’s always the hardest—after that, you’ve got a foundation. A starting point. Aka: the old deck. How many versions do you think we’ll go through? It's never just v1 #agencylife #buildinginpublic

May 23, 2025 at 5:36 PM
We’ve been working on a capability deck for a while now (okay, weeks). The first one’s always the hardest—after that, you’ve got a foundation. A starting point. Aka: the old deck. How many versions do you think we’ll go through? It's never just v1 #agencylife #buildinginpublic