


.
@ellzhem.bsky.social
Reposted by .

The first chart here are SARS-CoV-2 wastewater levels from 2022 to present prior to baseline normalization
The second chart is the same thing but just for 2024
The third is a (predicted) chart for 2025 assuming wastewater levels in 2025 are similar to 2024
Much less scary, eh?
That's the intent
The second chart is the same thing but just for 2024
The third is a (predicted) chart for 2025 assuming wastewater levels in 2025 are similar to 2024
Much less scary, eh?
That's the intent


January 18, 2025 at 3:05 PM
The first chart here are SARS-CoV-2 wastewater levels from 2022 to present prior to baseline normalization
The second chart is the same thing but just for 2024
The third is a (predicted) chart for 2025 assuming wastewater levels in 2025 are similar to 2024
Much less scary, eh?
That's the intent
The second chart is the same thing but just for 2024
The third is a (predicted) chart for 2025 assuming wastewater levels in 2025 are similar to 2024
Much less scary, eh?
That's the intent
Reposted by .

Special shoutout to Eno, my favorite neuro-divergent icon from the game, going from left-field references that'd make me pause and laugh before translating her lines for friends to hyper-specific knowledge of the Stanford Prison Experiments a Japanese middle schooler probably wouldn't normally know


December 30, 2024 at 7:05 PM
Special shoutout to Eno, my favorite neuro-divergent icon from the game, going from left-field references that'd make me pause and laugh before translating her lines for friends to hyper-specific knowledge of the Stanford Prison Experiments a Japanese middle schooler probably wouldn't normally know
Reposted by .

⚠️ One of the most important revelations I've ever had on social networks, please read and share if appropriate. Alt text included. I've been blessed to have had a big platform for a long time. I get to see these things.
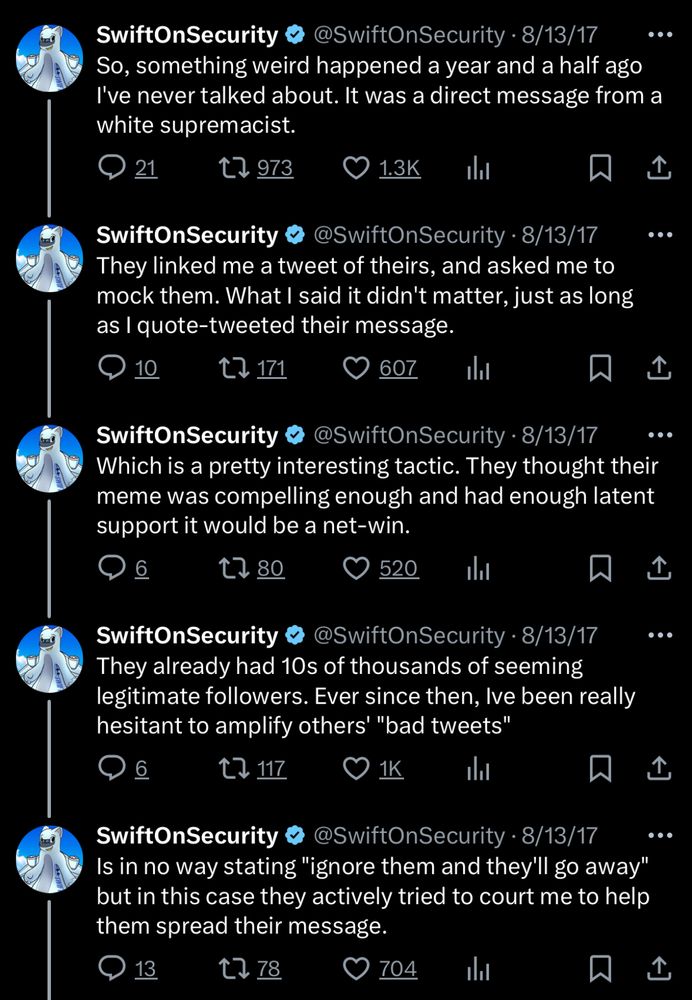
November 19, 2024 at 4:54 AM
⚠️ One of the most important revelations I've ever had on social networks, please read and share if appropriate. Alt text included. I've been blessed to have had a big platform for a long time. I get to see these things.
