


Parker Ross
@econparker.bsky.social
Global Chief Economist @ Arch Capital Group | ex JPM AIG HUD | Husband to Jamie; Dad to Landon, Greyson & Logan | No investment advice & views are my own 🦬🇺🇸🇮🇱
https://www.linkedin.com/in/econ-parker/
https://www.linkedin.com/in/econ-parker/
I’ve been a bit quiet on here recently as my family ramped up preparations for our third son.
Thrilled to announce baby Logan has arrived!
Mom and baby are healthy and happy, and the big bros are over the moon!
Thrilled to announce baby Logan has arrived!
Mom and baby are healthy and happy, and the big bros are over the moon!


November 10, 2025 at 8:02 PM
I’ve been a bit quiet on here recently as my family ramped up preparations for our third son.
Thrilled to announce baby Logan has arrived!
Mom and baby are healthy and happy, and the big bros are over the moon!
Thrilled to announce baby Logan has arrived!
Mom and baby are healthy and happy, and the big bros are over the moon!
Here’s the kicker: the imported share of tech capex has jumped to nearly 50% - the highest on record.
So even my earlier GDP contribution charts understate the true size of the AI investment boom.
So even my earlier GDP contribution charts understate the true size of the AI investment boom.

September 26, 2025 at 2:39 PM
Here’s the kicker: the imported share of tech capex has jumped to nearly 50% - the highest on record.
So even my earlier GDP contribution charts understate the true size of the AI investment boom.
So even my earlier GDP contribution charts understate the true size of the AI investment boom.
Together, they show the full scale of the AI (and other tech-related) build-out.

September 26, 2025 at 2:39 PM
Together, they show the full scale of the AI (and other tech-related) build-out.
Now compare imports with BEA’s domestic investment data.
Both domestic and imported tech capex have surged in tandem.
Both domestic and imported tech capex have surged in tandem.

September 26, 2025 at 2:39 PM
Now compare imports with BEA’s domestic investment data.
Both domestic and imported tech capex have surged in tandem.
Both domestic and imported tech capex have surged in tandem.
Look under the hood:
Computer & networking gear imports are surging,
While semiconductor imports have actually slumped.
That’s because high-end AI GPUs often get classified under “computers,” not chips...
So the AI boom can show up more prominently in segments outside of semiconductors.
Computer & networking gear imports are surging,
While semiconductor imports have actually slumped.
That’s because high-end AI GPUs often get classified under “computers,” not chips...
So the AI boom can show up more prominently in segments outside of semiconductors.

September 26, 2025 at 2:39 PM
Look under the hood:
Computer & networking gear imports are surging,
While semiconductor imports have actually slumped.
That’s because high-end AI GPUs often get classified under “computers,” not chips...
So the AI boom can show up more prominently in segments outside of semiconductors.
Computer & networking gear imports are surging,
While semiconductor imports have actually slumped.
That’s because high-end AI GPUs often get classified under “computers,” not chips...
So the AI boom can show up more prominently in segments outside of semiconductors.
As I showed yesterday, business investment in software & tech is adding more to GDP growth than ever before.
But here’s the catch: that capex contribution only captures the domestic slice of the boom.
Imports of Tech capex - up 90% in 2 years - tell the rest of the story.
More in 🧵
#EconThreads
But here’s the catch: that capex contribution only captures the domestic slice of the boom.
Imports of Tech capex - up 90% in 2 years - tell the rest of the story.
More in 🧵
#EconThreads

September 26, 2025 at 2:39 PM
As I showed yesterday, business investment in software & tech is adding more to GDP growth than ever before.
But here’s the catch: that capex contribution only captures the domestic slice of the boom.
Imports of Tech capex - up 90% in 2 years - tell the rest of the story.
More in 🧵
#EconThreads
But here’s the catch: that capex contribution only captures the domestic slice of the boom.
Imports of Tech capex - up 90% in 2 years - tell the rest of the story.
More in 🧵
#EconThreads
Software + Tech Bubble 2.0?
In terms of contribution to GDP, we've never seen a surge in tech & software investment of this scale.
For some perspective, here's the contribution to real GDP growth from businesses investing in software and technology since 1960.
#EconSky
In terms of contribution to GDP, we've never seen a surge in tech & software investment of this scale.
For some perspective, here's the contribution to real GDP growth from businesses investing in software and technology since 1960.
#EconSky

September 25, 2025 at 3:08 PM
Software + Tech Bubble 2.0?
In terms of contribution to GDP, we've never seen a surge in tech & software investment of this scale.
For some perspective, here's the contribution to real GDP growth from businesses investing in software and technology since 1960.
#EconSky
In terms of contribution to GDP, we've never seen a surge in tech & software investment of this scale.
For some perspective, here's the contribution to real GDP growth from businesses investing in software and technology since 1960.
#EconSky
Combining the two, it's clear the economy's recent resilience is coming from the recent ramp-up in business investment in software and technology, which contributed an average of more than 1%-pt to real GDP growth in Q1 and Q2.

September 25, 2025 at 2:39 PM
Combining the two, it's clear the economy's recent resilience is coming from the recent ramp-up in business investment in software and technology, which contributed an average of more than 1%-pt to real GDP growth in Q1 and Q2.
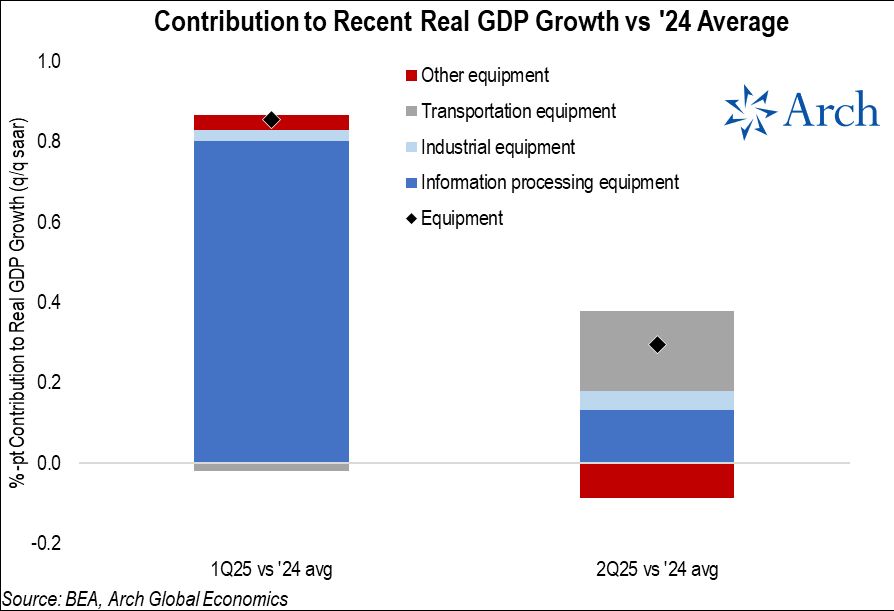
Similar story on the equipment side.
It hasn't been a massive surge in bulldozers and industrial equipment, but rather information processing equipment (again hello AI).
It hasn't been a massive surge in bulldozers and industrial equipment, but rather information processing equipment (again hello AI).
September 25, 2025 at 2:39 PM
Similar story on the equipment side.
It hasn't been a massive surge in bulldozers and industrial equipment, but rather information processing equipment (again hello AI).
It hasn't been a massive surge in bulldozers and industrial equipment, but rather information processing equipment (again hello AI).
Within Intellectual Property Products, it's again unsurprisingly mostly been about software investment (hello AI).

September 25, 2025 at 2:39 PM
Within Intellectual Property Products, it's again unsurprisingly mostly been about software investment (hello AI).
What is driving business investment in recent quarters?
Mostly Intellectual Property Products and Equipment.
Structures have unsurprisingly been a drag (similar to residential investment).
Mostly Intellectual Property Products and Equipment.
Structures have unsurprisingly been a drag (similar to residential investment).

September 25, 2025 at 2:39 PM
What is driving business investment in recent quarters?
Mostly Intellectual Property Products and Equipment.
Structures have unsurprisingly been a drag (similar to residential investment).
Mostly Intellectual Property Products and Equipment.
Structures have unsurprisingly been a drag (similar to residential investment).
Again, breaking it down vs the '24 average and stripping out the volatile components (net exports, inventories) and government, we see real final sales to domestic purchasers was roughly in-line with the 2024.

September 25, 2025 at 2:39 PM
Again, breaking it down vs the '24 average and stripping out the volatile components (net exports, inventories) and government, we see real final sales to domestic purchasers was roughly in-line with the 2024.
Zooming in on the first half, here's how much each category deviated from the '24 average...
Again, we see the big swing in inventories and net exports.
Again, we see the big swing in inventories and net exports.

September 25, 2025 at 2:39 PM
Zooming in on the first half, here's how much each category deviated from the '24 average...
Again, we see the big swing in inventories and net exports.
Again, we see the big swing in inventories and net exports.
Stripping out those two volatile categories (i.e. inventories & net exports) gives you a good view on the core underlying drivers of the economy: Final Sales to Private Domestic Purchasers.
Again, now we see there was a modest dip in Q1, with Q2 back to the prior trend pace.
Again, now we see there was a modest dip in Q1, with Q2 back to the prior trend pace.

September 25, 2025 at 2:39 PM
Stripping out those two volatile categories (i.e. inventories & net exports) gives you a good view on the core underlying drivers of the economy: Final Sales to Private Domestic Purchasers.
Again, now we see there was a modest dip in Q1, with Q2 back to the prior trend pace.
Again, now we see there was a modest dip in Q1, with Q2 back to the prior trend pace.
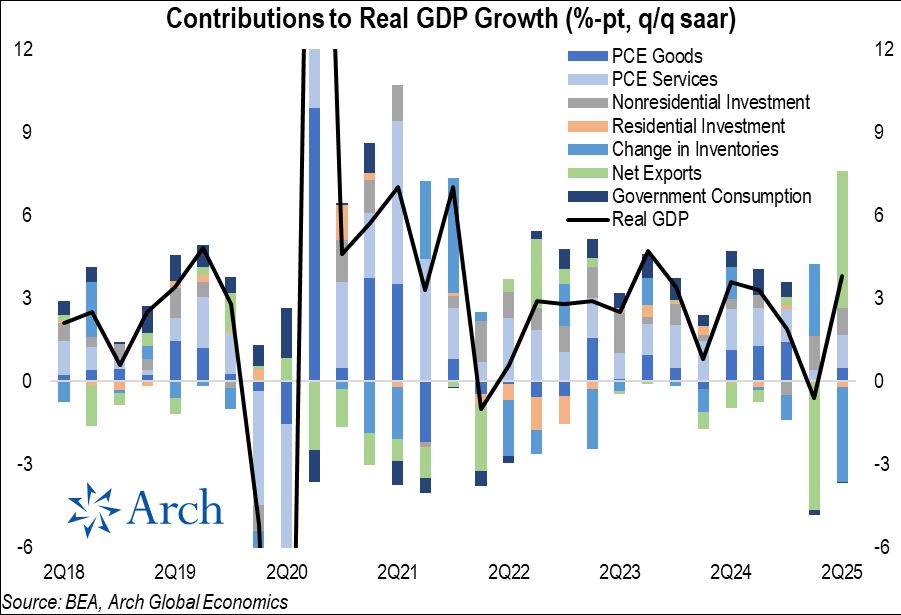
Looking at the revised series, here's contributions to real GDP growth over time, showing all of the slowdown occurred in Q1, with exports and inventories driving most of the swing.
September 25, 2025 at 2:39 PM
Looking at the revised series, here's contributions to real GDP growth over time, showing all of the slowdown occurred in Q1, with exports and inventories driving most of the swing.
Pretty notable upward revisions to 2Q25 real GDP growth this morning: up 50bps to 3.8% from 3.3% prior.
All of the upward revision was due to stronger than previously reported Consumer spending on of Services, Business Investment and a modest bump to Government consumption.
Details in 🧵
#EconSky
All of the upward revision was due to stronger than previously reported Consumer spending on of Services, Business Investment and a modest bump to Government consumption.
Details in 🧵
#EconSky

September 25, 2025 at 2:39 PM
Pretty notable upward revisions to 2Q25 real GDP growth this morning: up 50bps to 3.8% from 3.3% prior.
All of the upward revision was due to stronger than previously reported Consumer spending on of Services, Business Investment and a modest bump to Government consumption.
Details in 🧵
#EconSky
All of the upward revision was due to stronger than previously reported Consumer spending on of Services, Business Investment and a modest bump to Government consumption.
Details in 🧵
#EconSky
Looking at the breadth and severity of increases in insured unemployment across states, two-thirds are up y/y, but only 23% are up more than 10bps.
So, there's widespread softening, but it's not very rapid.
So, there's widespread softening, but it's not very rapid.

September 25, 2025 at 2:37 PM
Looking at the breadth and severity of increases in insured unemployment across states, two-thirds are up y/y, but only 23% are up more than 10bps.
So, there's widespread softening, but it's not very rapid.
So, there's widespread softening, but it's not very rapid.
So, how concerned should we be about broad-based insured unemployment trends?
Right now, it's still a relatively small cohort rising at a notable pace.
Typically, insured unemployment is rising > 40bps y/y in ~20% of states at the onsets of recessions since 1990.
Right now we're at just 4%.
Right now, it's still a relatively small cohort rising at a notable pace.
Typically, insured unemployment is rising > 40bps y/y in ~20% of states at the onsets of recessions since 1990.
Right now we're at just 4%.

September 25, 2025 at 2:37 PM
So, how concerned should we be about broad-based insured unemployment trends?
Right now, it's still a relatively small cohort rising at a notable pace.
Typically, insured unemployment is rising > 40bps y/y in ~20% of states at the onsets of recessions since 1990.
Right now we're at just 4%.
Right now, it's still a relatively small cohort rising at a notable pace.
Typically, insured unemployment is rising > 40bps y/y in ~20% of states at the onsets of recessions since 1990.
Right now we're at just 4%.
Although the flows into continuing claims for federal workers has certainly tapered off vs the initial surge, it remains elevated vs the recent norm.

September 25, 2025 at 2:37 PM
Although the flows into continuing claims for federal workers has certainly tapered off vs the initial surge, it remains elevated vs the recent norm.
For context on DOGE-impacted federal employees, we need to look at the Unemployment Compensation program for Federal Employees (UCFE).
There we see a continued surge in workers receiving benefits.
There we see a continued surge in workers receiving benefits.

September 25, 2025 at 2:37 PM
For context on DOGE-impacted federal employees, we need to look at the Unemployment Compensation program for Federal Employees (UCFE).
There we see a continued surge in workers receiving benefits.
There we see a continued surge in workers receiving benefits.
Stepping back and looking at the broader trends in insured unemployment, we see DC is leading the way higher on an over-year-ago basis (up 83 bps), followed by Oregon (43 bps), Massachusetts (36 bps), Washington (34 bps) and Kansas (18 bps).

September 25, 2025 at 2:37 PM
Stepping back and looking at the broader trends in insured unemployment, we see DC is leading the way higher on an over-year-ago basis (up 83 bps), followed by Oregon (43 bps), Massachusetts (36 bps), Washington (34 bps) and Kansas (18 bps).
Normalizing continuing claims for the size of its labor force gives us the insured unemployment rate, which shows us that California has only a modestly elevated insured unemployment rate.

September 25, 2025 at 2:37 PM
Normalizing continuing claims for the size of its labor force gives us the insured unemployment rate, which shows us that California has only a modestly elevated insured unemployment rate.
But, in the grand scheme, that size of a weekly change is just noise for a state the size of California.

September 25, 2025 at 2:37 PM
But, in the grand scheme, that size of a weekly change is just noise for a state the size of California.
Although national continuing claims ticked down w/w, California exerted the most upward pressure last week on continuing claims.

September 25, 2025 at 2:37 PM
Although national continuing claims ticked down w/w, California exerted the most upward pressure last week on continuing claims.
That now appears to have been corrected.

September 25, 2025 at 2:37 PM
That now appears to have been corrected.