


Dr. Dominic Royé
@drxeo.eu
-Mapping the world- Dr. in Physical Geography | Environmental Health - bioclimatology - geography. RC Researcher from 🇩🇪 at @mbgcsic.bsky.social @csic.es in 🇪🇸 #rstats #dataviz
Secretary of the @aeclim.org
📍Galicia
ℹ️ https://dominicroye.github.io
Secretary of the @aeclim.org
📍Galicia
ℹ️ https://dominicroye.github.io
New study out! 🌍💧 “The Association between Total Precipitation and Diarrhea Morbidity” — a multicountry analysis across climate zones. Both dry & wet extremes raise health risks. 📖 Read journals.lww.com/environepide...
#ClimateHealth #GlobalHealth #Diarrhea #Precipitation
#ClimateHealth #GlobalHealth #Diarrhea #Precipitation


November 10, 2025 at 8:43 AM
New study out! 🌍💧 “The Association between Total Precipitation and Diarrhea Morbidity” — a multicountry analysis across climate zones. Both dry & wet extremes raise health risks. 📖 Read journals.lww.com/environepide...
#ClimateHealth #GlobalHealth #Diarrhea #Precipitation
#ClimateHealth #GlobalHealth #Diarrhea #Precipitation
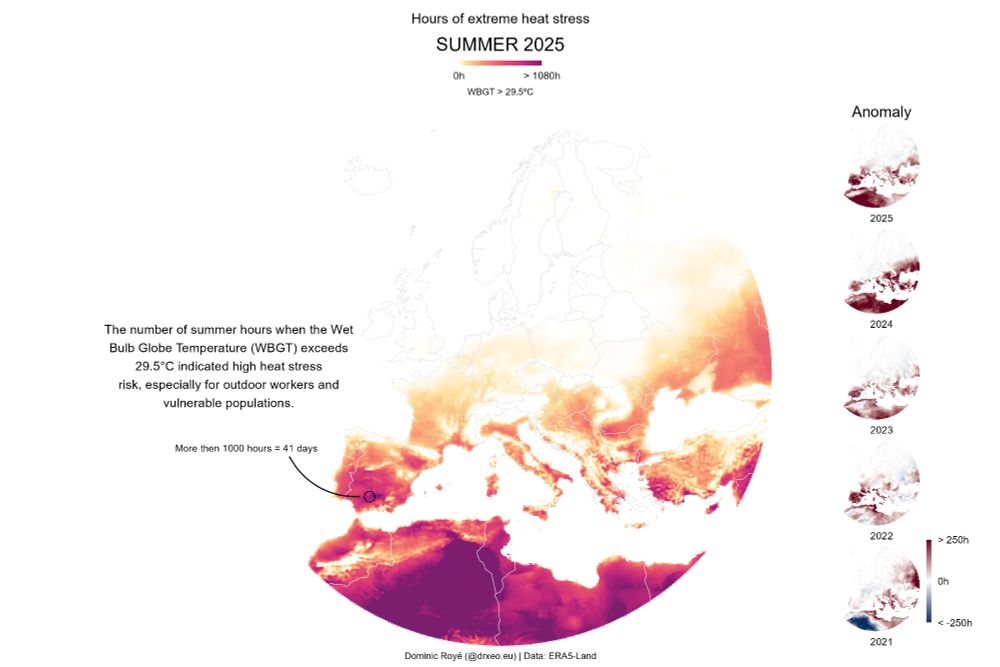
New #dataviz on summer heat-stress anomalies in Europe, 1950–2025. 🥵
This map shows hours with WBGT > 29.5 °C—extreme stress where work should be limited. Since 2010, positive anomalies dominate. 300h = 12.5 days of danger. It’s important to focus on the sub-daily exposure.
#rstats #climatechange
This map shows hours with WBGT > 29.5 °C—extreme stress where work should be limited. Since 2010, positive anomalies dominate. 300h = 12.5 days of danger. It’s important to focus on the sub-daily exposure.
#rstats #climatechange

November 8, 2025 at 2:13 PM
New #dataviz on summer heat-stress anomalies in Europe, 1950–2025. 🥵
This map shows hours with WBGT > 29.5 °C—extreme stress where work should be limited. Since 2010, positive anomalies dominate. 300h = 12.5 days of danger. It’s important to focus on the sub-daily exposure.
#rstats #climatechange
This map shows hours with WBGT > 29.5 °C—extreme stress where work should be limited. Since 2010, positive anomalies dominate. 300h = 12.5 days of danger. It’s important to focus on the sub-daily exposure.
#rstats #climatechange
#30DayMapChallenge
Day 7: Accessibility
Frequency of routes to the nearest park in Santiago de Compostela. 🗺️
#rstats #dataviz
Day 7: Accessibility
Frequency of routes to the nearest park in Santiago de Compostela. 🗺️
#rstats #dataviz

November 7, 2025 at 3:25 PM
#30DayMapChallenge
Day 7: Accessibility
Frequency of routes to the nearest park in Santiago de Compostela. 🗺️
#rstats #dataviz
Day 7: Accessibility
Frequency of routes to the nearest park in Santiago de Compostela. 🗺️
#rstats #dataviz
New #dataviz on heat stress in Europe, summer 2025.
This map shows total summer hours with WBGT > 29.5°C — a threshold for extreme heat stress. In parts of Spain, values exceed 1,000 hours (41 days).
#rstats #climatechange #health
This map shows total summer hours with WBGT > 29.5°C — a threshold for extreme heat stress. In parts of Spain, values exceed 1,000 hours (41 days).
#rstats #climatechange #health
November 3, 2025 at 9:48 AM
New #dataviz on heat stress in Europe, summer 2025.
This map shows total summer hours with WBGT > 29.5°C — a threshold for extreme heat stress. In parts of Spain, values exceed 1,000 hours (41 days).
#rstats #climatechange #health
This map shows total summer hours with WBGT > 29.5°C — a threshold for extreme heat stress. In parts of Spain, values exceed 1,000 hours (41 days).
#rstats #climatechange #health

Empezamos la jornada de la PTI Salud Global del CSIC con muchos desafíos ante la emergencia climatica 🫠
#salud #cambioclimatico
#salud #cambioclimatico

October 20, 2025 at 5:09 PM
Empezamos la jornada de la PTI Salud Global del CSIC con muchos desafíos ante la emergencia climatica 🫠
#salud #cambioclimatico
#salud #cambioclimatico
🔬 New in The Lancet Planetary Health: Our global study links short-term exposure to BTEX (benzene, toluene, ethylbenzene, xylene) with increased daily mortality across 757 locations. Urgent need for stricter air quality rules. ☠️
📖 doi.org/10.1016/j.la...
#AirPollution #BTEX #MCCnetwork
📖 doi.org/10.1016/j.la...
#AirPollution #BTEX #MCCnetwork

September 17, 2025 at 1:43 PM
🔬 New in The Lancet Planetary Health: Our global study links short-term exposure to BTEX (benzene, toluene, ethylbenzene, xylene) with increased daily mortality across 757 locations. Urgent need for stricter air quality rules. ☠️
📖 doi.org/10.1016/j.la...
#AirPollution #BTEX #MCCnetwork
📖 doi.org/10.1016/j.la...
#AirPollution #BTEX #MCCnetwork
📢 CONFERENCIA
impartida por Jaime Ribalaygua @ficlima.org
📡 Mejorando la información para gestionar bosques resilientes al cambio climático para la restauración ecológica
Acceso gratuito previo registro.
📅 16 de octubre 🕛 12h
📍 Aula Magna, MBG, Sede Santiago de Compostela
🔗 lnkd.in/ef59Dffm
impartida por Jaime Ribalaygua @ficlima.org
📡 Mejorando la información para gestionar bosques resilientes al cambio climático para la restauración ecológica
Acceso gratuito previo registro.
📅 16 de octubre 🕛 12h
📍 Aula Magna, MBG, Sede Santiago de Compostela
🔗 lnkd.in/ef59Dffm

September 4, 2025 at 8:43 AM
📢 CONFERENCIA
impartida por Jaime Ribalaygua @ficlima.org
📡 Mejorando la información para gestionar bosques resilientes al cambio climático para la restauración ecológica
Acceso gratuito previo registro.
📅 16 de octubre 🕛 12h
📍 Aula Magna, MBG, Sede Santiago de Compostela
🔗 lnkd.in/ef59Dffm
impartida por Jaime Ribalaygua @ficlima.org
📡 Mejorando la información para gestionar bosques resilientes al cambio climático para la restauración ecológica
Acceso gratuito previo registro.
📅 16 de octubre 🕛 12h
📍 Aula Magna, MBG, Sede Santiago de Compostela
🔗 lnkd.in/ef59Dffm
📢 CONFERENCIA
impartida por @albavianasoto.bsky.social
📡 Las huellas de las perturbaciones forestales en Europa: teledetección para evaluar el daño y la recuperación
Acceso gratuito previo registro.
📅 10 de octubre 🕛 12h
📍 Aula Magna, MBG, Sede Santiago de Compostela
🔗 lnkd.in/dnYdvpxA
impartida por @albavianasoto.bsky.social
📡 Las huellas de las perturbaciones forestales en Europa: teledetección para evaluar el daño y la recuperación
Acceso gratuito previo registro.
📅 10 de octubre 🕛 12h
📍 Aula Magna, MBG, Sede Santiago de Compostela
🔗 lnkd.in/dnYdvpxA

September 3, 2025 at 7:53 AM
📢 CONFERENCIA
impartida por @albavianasoto.bsky.social
📡 Las huellas de las perturbaciones forestales en Europa: teledetección para evaluar el daño y la recuperación
Acceso gratuito previo registro.
📅 10 de octubre 🕛 12h
📍 Aula Magna, MBG, Sede Santiago de Compostela
🔗 lnkd.in/dnYdvpxA
impartida por @albavianasoto.bsky.social
📡 Las huellas de las perturbaciones forestales en Europa: teledetección para evaluar el daño y la recuperación
Acceso gratuito previo registro.
📅 10 de octubre 🕛 12h
📍 Aula Magna, MBG, Sede Santiago de Compostela
🔗 lnkd.in/dnYdvpxA
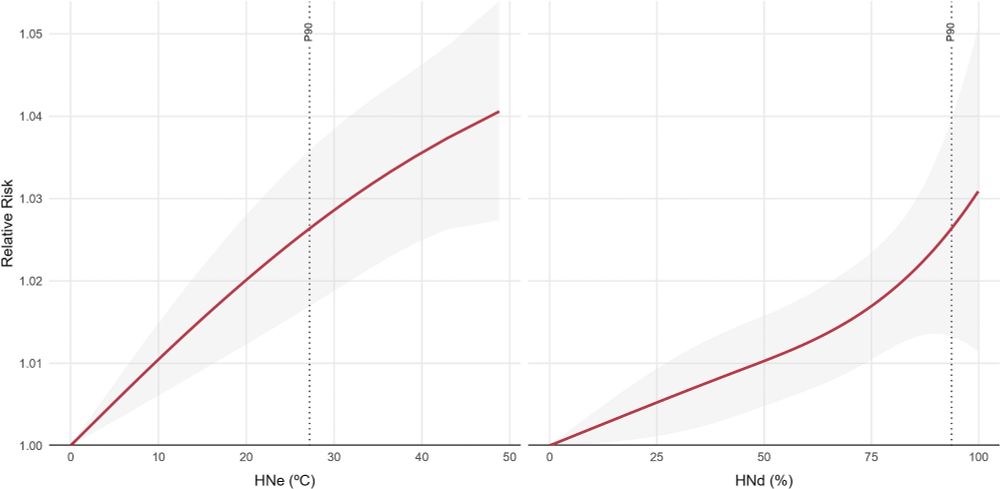
Hot nights disrupt sleep, prevent recovery from daytime heat, and increase cardiovascular & respiratory risks. #PublicHealth #ClimateCrisis
September 2, 2025 at 10:05 AM
Hot nights disrupt sleep, prevent recovery from daytime heat, and increase cardiovascular & respiratory risks. #PublicHealth #ClimateCrisis
The Mediterranean Basin is a global hotspot. Southern Europe & Western Asia show the highest mortality burden from hot nights. #Mediterranean #HeatRisk

September 2, 2025 at 10:05 AM
The Mediterranean Basin is a global hotspot. Southern Europe & Western Asia show the highest mortality burden from hot nights. #Mediterranean #HeatRisk
🌡️ New global study: hot nights increase mortality risk — independently of daytime heat. 178 cities, 44 countries, 14M+ deaths analyzed.
Our new study published in Environment Int and led by Carmen Iñiguez and myself from the MCC Research Network.
#HotNights #ClimateHealth #climatechange
Our new study published in Environment Int and led by Carmen Iñiguez and myself from the MCC Research Network.
#HotNights #ClimateHealth #climatechange

September 2, 2025 at 10:05 AM
🌡️ New global study: hot nights increase mortality risk — independently of daytime heat. 178 cities, 44 countries, 14M+ deaths analyzed.
Our new study published in Environment Int and led by Carmen Iñiguez and myself from the MCC Research Network.
#HotNights #ClimateHealth #climatechange
Our new study published in Environment Int and led by Carmen Iñiguez and myself from the MCC Research Network.
#HotNights #ClimateHealth #climatechange
📢 Todavía quedan plazas. ¡Apúntate!
🗓️ Plazo de inscripción hasta el 8 de septiembre.
#comunicación #ciencia #meteo #clima
🗓️ Plazo de inscripción hasta el 8 de septiembre.
#comunicación #ciencia #meteo #clima


September 1, 2025 at 7:23 AM
📢 Todavía quedan plazas. ¡Apúntate!
🗓️ Plazo de inscripción hasta el 8 de septiembre.
#comunicación #ciencia #meteo #clima
🗓️ Plazo de inscripción hasta el 8 de septiembre.
#comunicación #ciencia #meteo #clima
🔥 En nuestro estudio (doi:10.1002/ldr.3450) de 2020 analizamos incendios en el Mediterráneo (1985–2015). Hallamos que pocos incendios causan la mayoría del área quemada. En 🇵🇹 y 🇪🇸, el índice de concentración crece +7,6% y +1,3% por década. Urge adaptar la gestión del fuego.

August 21, 2025 at 3:05 PM
🔥 En nuestro estudio (doi:10.1002/ldr.3450) de 2020 analizamos incendios en el Mediterráneo (1985–2015). Hallamos que pocos incendios causan la mayoría del área quemada. En 🇵🇹 y 🇪🇸, el índice de concentración crece +7,6% y +1,3% por década. Urge adaptar la gestión del fuego.
Here is your color proposal:

August 6, 2025 at 10:05 AM
Here is your color proposal:
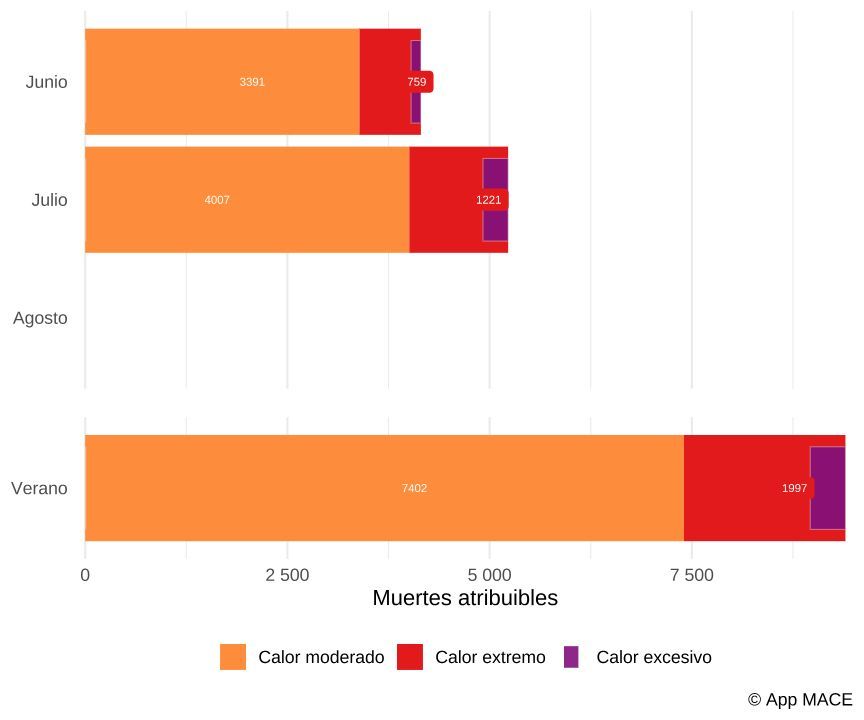
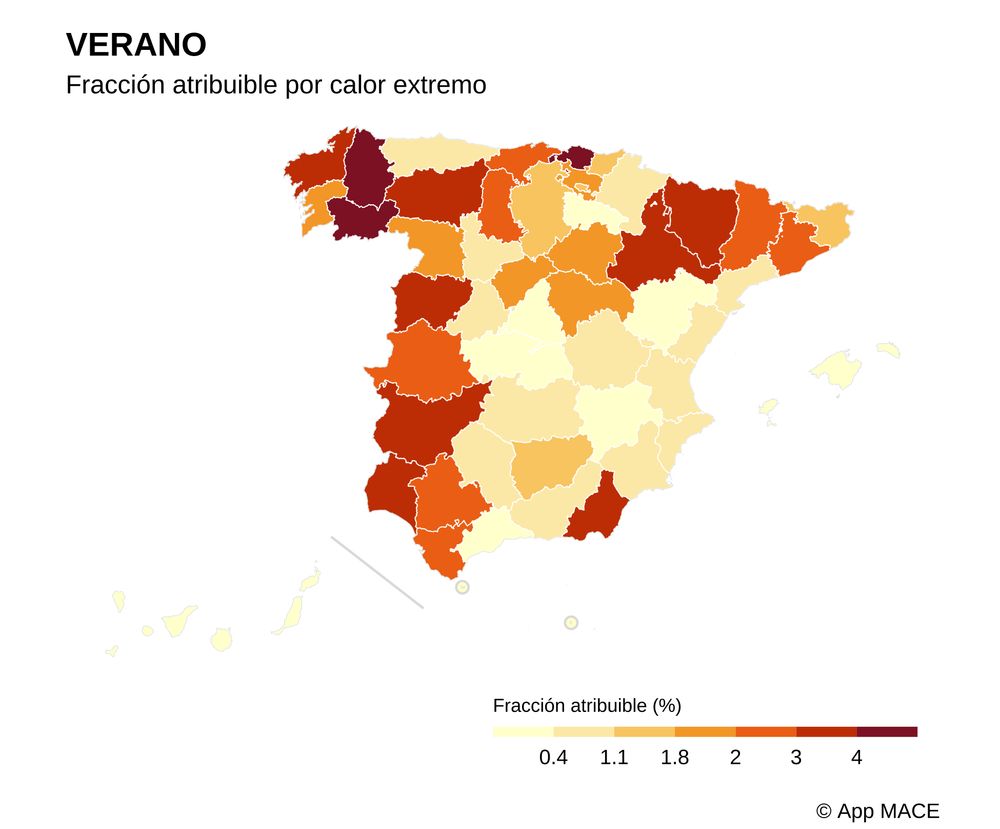
🌡️ Julio bajo calor extremo 🥵
Según nuestra app MACE, el mes de julio de 2025 dejó una huella preocupante: 5228 fallecieron por causas atribuibles al calor, de las cuales 🔴 1221 por calor extremo. En todo el verano llevamos 9399 (1997 por calor extremo).
🔗 Descubre más: ficlima.shinyapps.io/mace/
Según nuestra app MACE, el mes de julio de 2025 dejó una huella preocupante: 5228 fallecieron por causas atribuibles al calor, de las cuales 🔴 1221 por calor extremo. En todo el verano llevamos 9399 (1997 por calor extremo).
🔗 Descubre más: ficlima.shinyapps.io/mace/
August 4, 2025 at 3:33 PM
🌡️ Julio bajo calor extremo 🥵
Según nuestra app MACE, el mes de julio de 2025 dejó una huella preocupante: 5228 fallecieron por causas atribuibles al calor, de las cuales 🔴 1221 por calor extremo. En todo el verano llevamos 9399 (1997 por calor extremo).
🔗 Descubre más: ficlima.shinyapps.io/mace/
Según nuestra app MACE, el mes de julio de 2025 dejó una huella preocupante: 5228 fallecieron por causas atribuibles al calor, de las cuales 🔴 1221 por calor extremo. En todo el verano llevamos 9399 (1997 por calor extremo).
🔗 Descubre más: ficlima.shinyapps.io/mace/
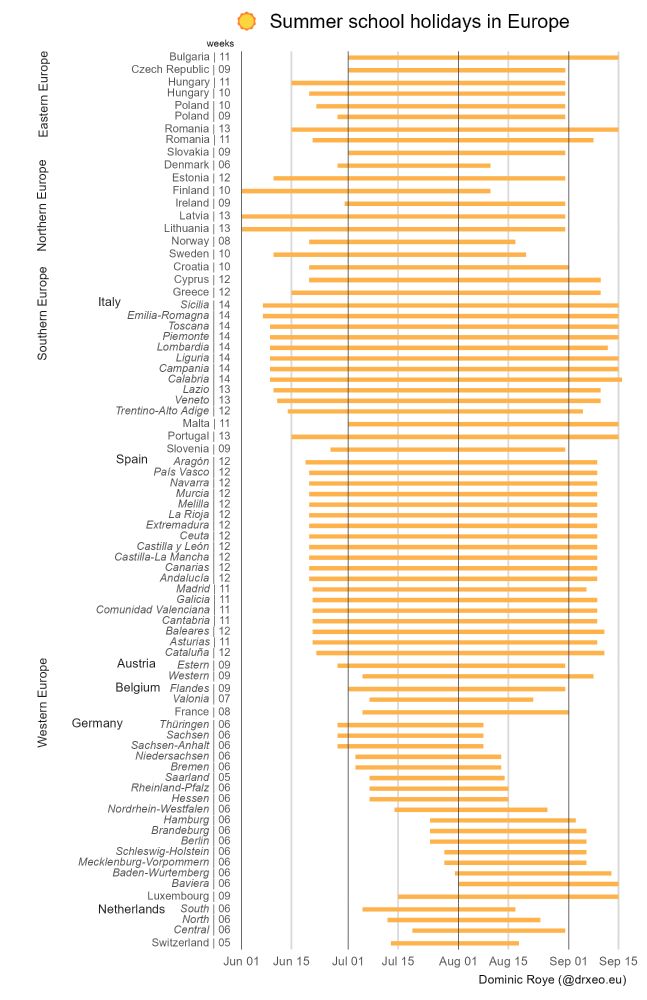
🇪🇺📊 New #dataviz exploring the length and timing of summer school holidays across Europe! Germany is one of the countries with the greatest variability in the start and end dates.
🛠️ Data was gathered with the help of Microsoft Copilot. Please note that minor discrepancies may still exist.
#rstats
🛠️ Data was gathered with the help of Microsoft Copilot. Please note that minor discrepancies may still exist.
#rstats
August 3, 2025 at 9:58 AM
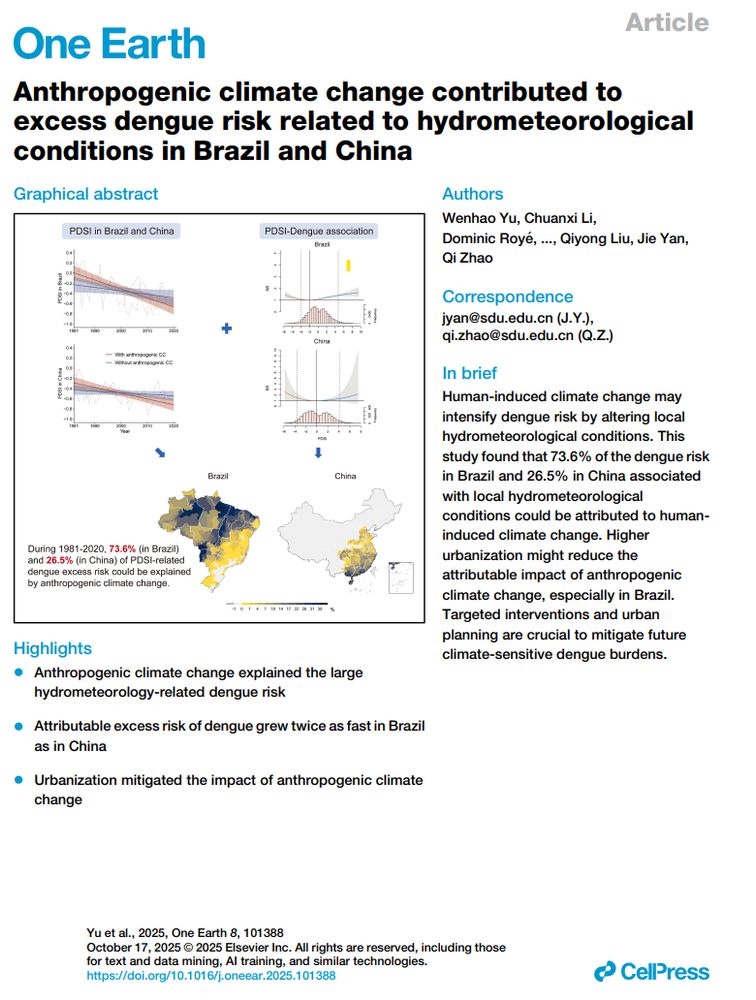
🌍 New publication out!
With an international team, we demonstrate that human-driven climate change amplified dengue risk, increasing it by up to 73.6% in Brazil, 26.5% in China. Insights that can guide public health and urban planning. #Dengue #ClimateChange
📖
www.sciencedirect.com/science/arti...
With an international team, we demonstrate that human-driven climate change amplified dengue risk, increasing it by up to 73.6% in Brazil, 26.5% in China. Insights that can guide public health and urban planning. #Dengue #ClimateChange
📖
www.sciencedirect.com/science/arti...
July 28, 2025 at 7:48 AM
🌍 New publication out!
With an international team, we demonstrate that human-driven climate change amplified dengue risk, increasing it by up to 73.6% in Brazil, 26.5% in China. Insights that can guide public health and urban planning. #Dengue #ClimateChange
📖
www.sciencedirect.com/science/arti...
With an international team, we demonstrate that human-driven climate change amplified dengue risk, increasing it by up to 73.6% in Brazil, 26.5% in China. Insights that can guide public health and urban planning. #Dengue #ClimateChange
📖
www.sciencedirect.com/science/arti...
Sólo en los primeros tres días de julio estimamos 897 muertes por calor, siendo 545 muertes por calor extremo 🥵
#oladecalor #salud
💡 ficlima.shinyapps.io/mace/
#oladecalor #salud
💡 ficlima.shinyapps.io/mace/

July 7, 2025 at 3:23 PM
Sólo en los primeros tres días de julio estimamos 897 muertes por calor, siendo 545 muertes por calor extremo 🥵
#oladecalor #salud
💡 ficlima.shinyapps.io/mace/
#oladecalor #salud
💡 ficlima.shinyapps.io/mace/
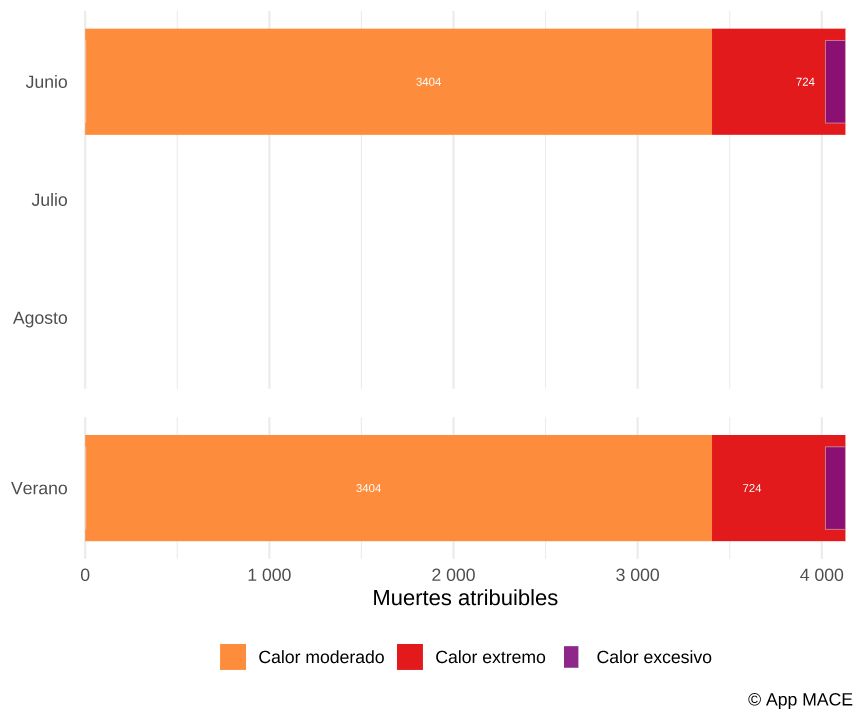
4128 muertes atribuibles al calor 🌡️ en JUNIO para toda España según nuestra aplicación #MACE. 3.404 por calor moderado y 724 por calor extremo. #oladecalor
En comparación junio de 2022 fueron 2859 y 879, respectivamente 🥵
@csic.es @mbgcsic.bsky.social
🔗https://ficlima.shinyapps.io/mace/
En comparación junio de 2022 fueron 2859 y 879, respectivamente 🥵
@csic.es @mbgcsic.bsky.social
🔗https://ficlima.shinyapps.io/mace/

July 4, 2025 at 8:11 AM
4128 muertes atribuibles al calor 🌡️ en JUNIO para toda España según nuestra aplicación #MACE. 3.404 por calor moderado y 724 por calor extremo. #oladecalor
En comparación junio de 2022 fueron 2859 y 879, respectivamente 🥵
@csic.es @mbgcsic.bsky.social
🔗https://ficlima.shinyapps.io/mace/
En comparación junio de 2022 fueron 2859 y 879, respectivamente 🥵
@csic.es @mbgcsic.bsky.social
🔗https://ficlima.shinyapps.io/mace/
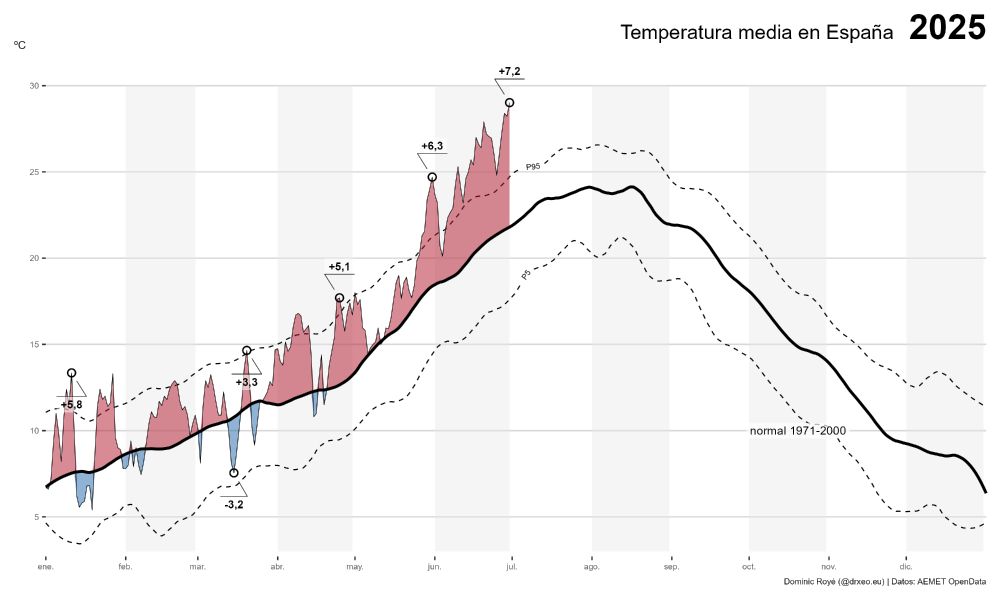
Y así estamos terminando junio y empezando julio. 🫠🥵
149 días con anomalía positiva, de los cuáles 56 días son extremos. 🌡️
149 días con anomalía positiva, de los cuáles 56 días son extremos. 🌡️
July 2, 2025 at 3:20 PM
Y así estamos terminando junio y empezando julio. 🫠🥵
149 días con anomalía positiva, de los cuáles 56 días son extremos. 🌡️
149 días con anomalía positiva, de los cuáles 56 días son extremos. 🌡️
¿Quién se anima? #rstats
Valencia 5, 6 y 7 de noviembre de 2025
IV Congreso & XV JORNADAS de Usuarios de R
rvalencia.webs.upv.es
Valencia 5, 6 y 7 de noviembre de 2025
IV Congreso & XV JORNADAS de Usuarios de R
rvalencia.webs.upv.es

July 1, 2025 at 11:30 AM
¿Quién se anima? #rstats
Valencia 5, 6 y 7 de noviembre de 2025
IV Congreso & XV JORNADAS de Usuarios de R
rvalencia.webs.upv.es
Valencia 5, 6 y 7 de noviembre de 2025
IV Congreso & XV JORNADAS de Usuarios de R
rvalencia.webs.upv.es
In the face of the #heatwave on the Iberian Peninsula, I have updated the map of drinking water sources based on data from @openstreetmap.bsky.social. #rstats #dataviz
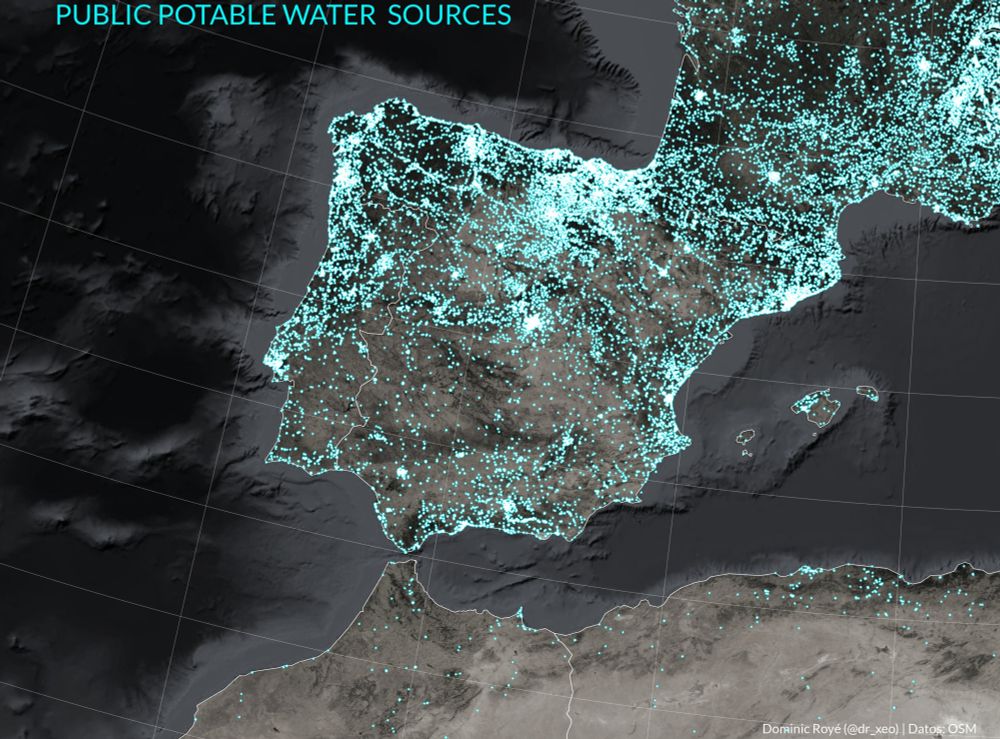
July 1, 2025 at 11:12 AM
In the face of the #heatwave on the Iberian Peninsula, I have updated the map of drinking water sources based on data from @openstreetmap.bsky.social. #rstats #dataviz