


diego1972.bsky.social
@diego1972.bsky.social
Reposted by diego1972.bsky.social

One of the strongest, clearest increases in likelihood & intensity, attributable to climate change, I've seen in a complex index like fire weather - the more intense & frequent events in Greece & Türkiye are already outpacing efforts to adapt.
www.worldweatherattribution.org/weather-cond...
www.worldweatherattribution.org/weather-cond...

August 28, 2025 at 8:41 AM
One of the strongest, clearest increases in likelihood & intensity, attributable to climate change, I've seen in a complex index like fire weather - the more intense & frequent events in Greece & Türkiye are already outpacing efforts to adapt.
www.worldweatherattribution.org/weather-cond...
www.worldweatherattribution.org/weather-cond...
Reposted by diego1972.bsky.social


Reposted by diego1972.bsky.social

Va be', proviamo anche questo.
February 20, 2025 at 4:22 AM
Va be', proviamo anche questo.
Reposted by diego1972.bsky.social

En Italie, un logiciel espion a ciblé des représentants de la société civile

En Italie, un logiciel espion a ciblé des représentants de la société civile
Un journaliste, un membre d’une ONG d’aide aux migrants et un militant libyen critique des compromissions de Rome avec les miliciens de Tripoli ont été avertis par Meta que leur téléphone avait été infecté.
www.lemonde.fr
February 6, 2025 at 1:12 PM
En Italie, un logiciel espion a ciblé des représentants de la société civile
Reposted by diego1972.bsky.social

Important new study shows that current climate models underestimate the human-caused slowing of the #AMOC (Atlantic Meridional Overturning Circulation), because they neglect freshwater influx from Greenland melt and other sources. /1 🌊
www.nature.com/articles/s41...
www.nature.com/articles/s41...
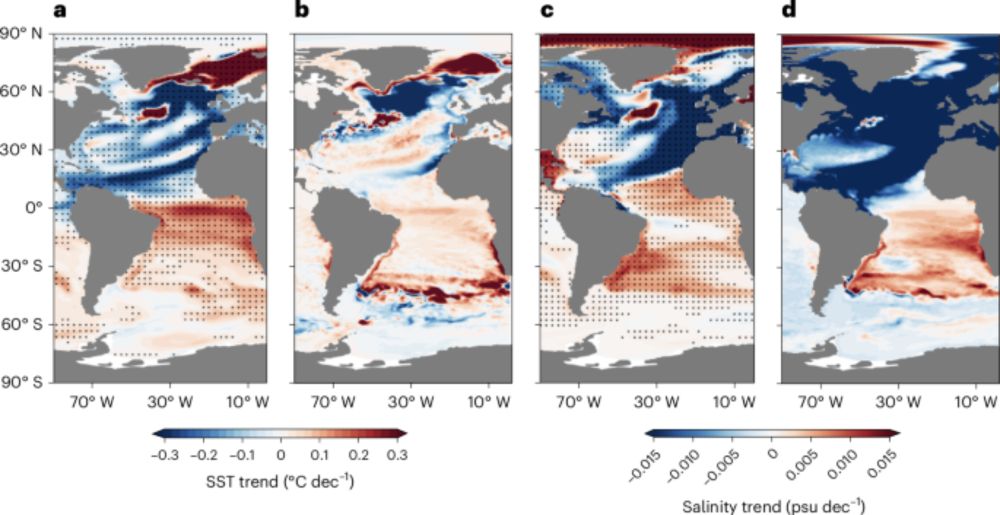
Weakening of the Atlantic Meridional Overturning Circulation driven by subarctic freshening since the mid-twentieth century - Nature Geoscience
Fresh meltwater entering the Labrador and Irminger seas has resulted in a slowing of the Atlantic Meridional Overturning Circulation since the 1950s, according to a combination of modelling approaches...
www.nature.com
November 20, 2024 at 11:22 AM
Important new study shows that current climate models underestimate the human-caused slowing of the #AMOC (Atlantic Meridional Overturning Circulation), because they neglect freshwater influx from Greenland melt and other sources. /1 🌊
www.nature.com/articles/s41...
www.nature.com/articles/s41...
Reposted by diego1972.bsky.social

La "fabbrica di troll" russi è ormai stata superata.
In questo articolo racconto in che modo le operazioni segrete di influenza e disinformazione russa sono diventate più sofisticate e raffinate, tra investimenti milionari e pianificazioni a lungo termine www.facta.news/articoli/ope...
In questo articolo racconto in che modo le operazioni segrete di influenza e disinformazione russa sono diventate più sofisticate e raffinate, tra investimenti milionari e pianificazioni a lungo termine www.facta.news/articoli/ope...

Le operazioni segrete di disinformazione russa sono sempre più sofisticate | Facta
Investimenti milionari e pianificazioni a lungo termine: come si sono evoluti i programmi segreti di influenza del Cremlino
www.facta.news
November 15, 2024 at 6:45 AM
La "fabbrica di troll" russi è ormai stata superata.
In questo articolo racconto in che modo le operazioni segrete di influenza e disinformazione russa sono diventate più sofisticate e raffinate, tra investimenti milionari e pianificazioni a lungo termine www.facta.news/articoli/ope...
In questo articolo racconto in che modo le operazioni segrete di influenza e disinformazione russa sono diventate più sofisticate e raffinate, tra investimenti milionari e pianificazioni a lungo termine www.facta.news/articoli/ope...
Reposted by diego1972.bsky.social

Donald Trump recently shared a plot that many climate models have historically overestimated summer warming over the US corn belt
But it turns out this is an egregious unrepresentative cherrypick, as @andrewdessler.bsky.social notes over at The Climate Brink: www.theclimatebrink.com/p/are-climat...
But it turns out this is an egregious unrepresentative cherrypick, as @andrewdessler.bsky.social notes over at The Climate Brink: www.theclimatebrink.com/p/are-climat...

August 12, 2024 at 3:16 PM
Donald Trump recently shared a plot that many climate models have historically overestimated summer warming over the US corn belt
But it turns out this is an egregious unrepresentative cherrypick, as @andrewdessler.bsky.social notes over at The Climate Brink: www.theclimatebrink.com/p/are-climat...
But it turns out this is an egregious unrepresentative cherrypick, as @andrewdessler.bsky.social notes over at The Climate Brink: www.theclimatebrink.com/p/are-climat...
Reposted by diego1972.bsky.social

Come intitolarlo?
Male ma non malissimo
Malissimo ma non malissimissimo
Malissimissimo ma non malissimissimissimo
Male ma non malissimo
Malissimo ma non malissimissimo
Malissimissimo ma non malissimissimissimo

January 12, 2024 at 5:56 PM
Come intitolarlo?
Male ma non malissimo
Malissimo ma non malissimissimo
Malissimissimo ma non malissimissimissimo
Male ma non malissimo
Malissimo ma non malissimissimo
Malissimissimo ma non malissimissimissimo
Reposted by diego1972.bsky.social

Perché le elezioni a Taiwan sono importanti

Perché le elezioni a Taiwan sono importanti
Le elezioni del 13 gennaio 2024 a Taiwan potrebbero ridisegnare gli equilibri con la Cina e avere ripercussioni sui rapporti con gli Stati Uniti, col rischio di aprire un nuovo fronte conflittuale mon...
www.valigiablu.it
January 12, 2024 at 9:06 AM
Perché le elezioni a Taiwan sono importanti
Reposted by diego1972.bsky.social

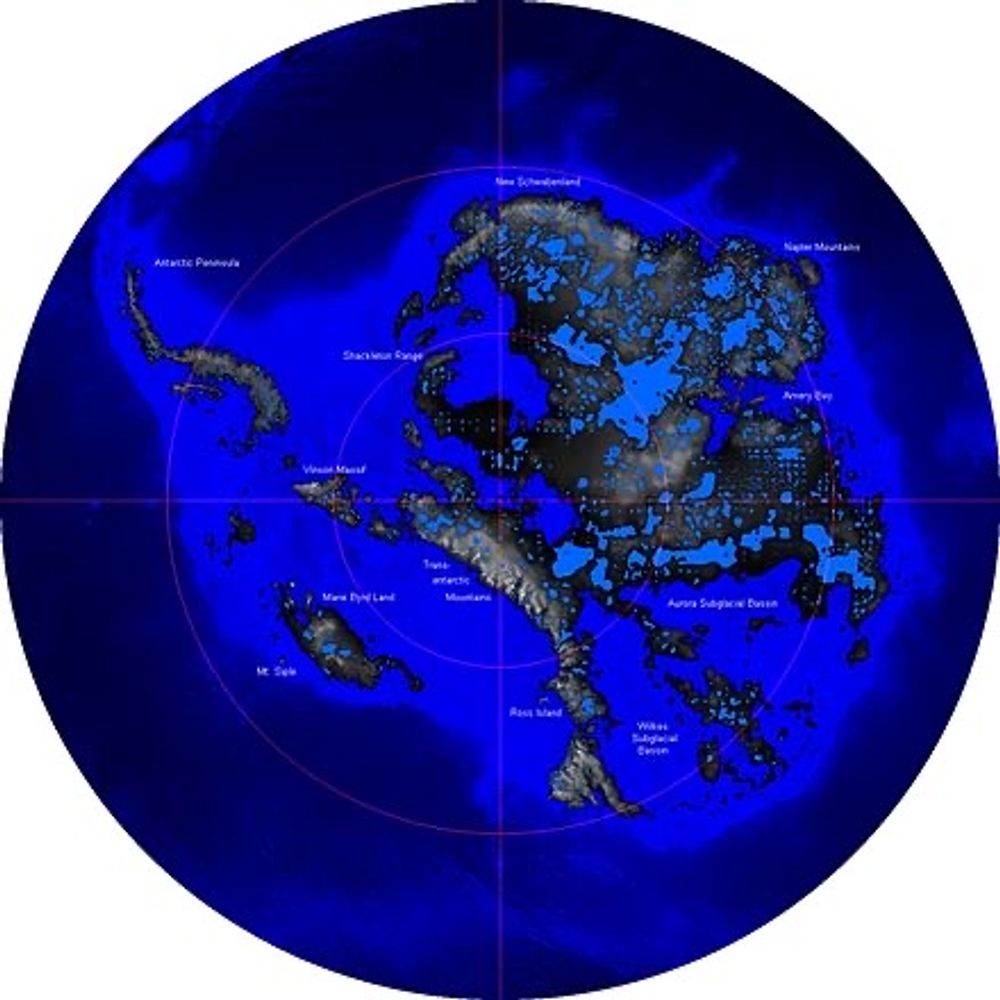
i would like to nominate Planet Earth for the 2024 climate communication award, this is a very effective way of conveying the urgency of climate change
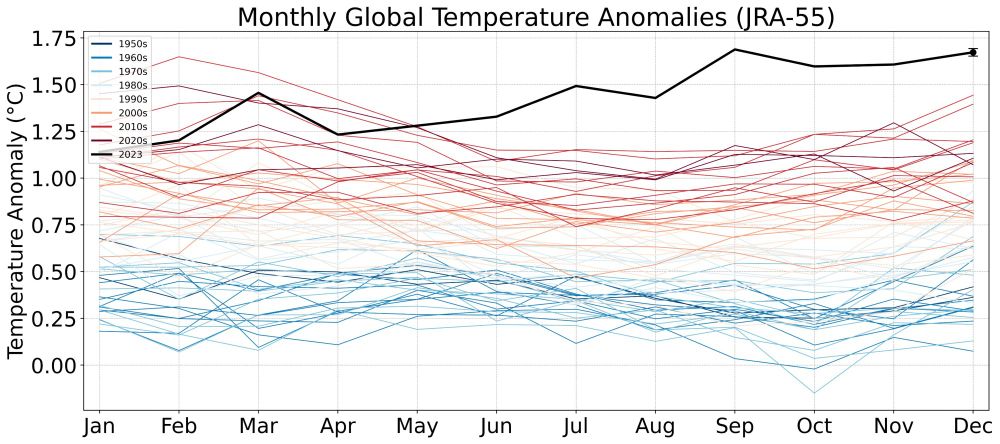
December 2023 is now certain to be the warmest December on record in the JRA-55 dataset, beating the prior record by over 0.2C. It will end just below September as the second highest anomaly of the year (with respect to an 1850-1900 baseline period).
January 2, 2024 at 7:27 PM
i would like to nominate Planet Earth for the 2024 climate communication award, this is a very effective way of conveying the urgency of climate change
Reposted by diego1972.bsky.social
Global temperatures are now available from
Copernicus/ECMWF's ERA5 reanalysis product for 2023.
They find it was the warmest year on record by a large margin, at 1.48C above preindustrial levels, higher than the 1.43C that JRA-55 reported earlier this week:
Copernicus/ECMWF's ERA5 reanalysis product for 2023.
They find it was the warmest year on record by a large margin, at 1.48C above preindustrial levels, higher than the 1.43C that JRA-55 reported earlier this week:

January 4, 2024 at 6:20 PM
Global temperatures are now available from
Copernicus/ECMWF's ERA5 reanalysis product for 2023.
They find it was the warmest year on record by a large margin, at 1.48C above preindustrial levels, higher than the 1.43C that JRA-55 reported earlier this week:
Copernicus/ECMWF's ERA5 reanalysis product for 2023.
They find it was the warmest year on record by a large margin, at 1.48C above preindustrial levels, higher than the 1.43C that JRA-55 reported earlier this week:
Reposted by diego1972.bsky.social
Global temperatures in 2023 were really weird.
For almost every other year we can pretty reliably predict temperatures (red dot and bars) based on the long term trend, the prior year, and the El Nino / La Nina conditions at the start. For 2023 this model completely breaks down:
For almost every other year we can pretty reliably predict temperatures (red dot and bars) based on the long term trend, the prior year, and the El Nino / La Nina conditions at the start. For 2023 this model completely breaks down:

January 5, 2024 at 10:27 PM
Global temperatures in 2023 were really weird.
For almost every other year we can pretty reliably predict temperatures (red dot and bars) based on the long term trend, the prior year, and the El Nino / La Nina conditions at the start. For 2023 this model completely breaks down:
For almost every other year we can pretty reliably predict temperatures (red dot and bars) based on the long term trend, the prior year, and the El Nino / La Nina conditions at the start. For 2023 this model completely breaks down:
Reposted by diego1972.bsky.social
January 5, 2024 at 9:38 AM
Reposted by diego1972.bsky.social
Tendenza meteo.
Quella che vedete sotto è la sezione verticale dell'atmosfera nel Nord Emisfero da 1 a 1000 hPa (Stratosfera + Troposfera). A destra della linea tratteggiata bianca la previsione (futuro), a sinistra l'osservato (passato). Andiamo verso il rosso, quindi?
Quella che vedete sotto è la sezione verticale dell'atmosfera nel Nord Emisfero da 1 a 1000 hPa (Stratosfera + Troposfera). A destra della linea tratteggiata bianca la previsione (futuro), a sinistra l'osservato (passato). Andiamo verso il rosso, quindi?

December 29, 2023 at 8:30 AM
Tendenza meteo.
Quella che vedete sotto è la sezione verticale dell'atmosfera nel Nord Emisfero da 1 a 1000 hPa (Stratosfera + Troposfera). A destra della linea tratteggiata bianca la previsione (futuro), a sinistra l'osservato (passato). Andiamo verso il rosso, quindi?
Quella che vedete sotto è la sezione verticale dell'atmosfera nel Nord Emisfero da 1 a 1000 hPa (Stratosfera + Troposfera). A destra della linea tratteggiata bianca la previsione (futuro), a sinistra l'osservato (passato). Andiamo verso il rosso, quindi?
Reposted by diego1972.bsky.social

Innalzamento del livello del mare, nuovo studio rivede al rialzo le stime sull'estensione delle aree a rischio nella zona del Mediterraneo entro fine secolo. 38.500 km quadrati di coste esposti al rischio di inondazione marina
www.ingv.it/stampa-e-urp...
www.ingv.it/stampa-e-urp...

MEDITERRANEO | Al rialzo le stime sull’aumento del livello marino sulle coste entro la fine del se...
Nuovi dati sulla subsidenza delle coste del Mediterraneo hanno permesso di rideterminare al rialzo le proiezioni dell'IPCC sull’aumento del livello marino entro il 2150 Le proiezioni di aumento del ...
www.ingv.it
December 29, 2023 at 10:20 AM
Innalzamento del livello del mare, nuovo studio rivede al rialzo le stime sull'estensione delle aree a rischio nella zona del Mediterraneo entro fine secolo. 38.500 km quadrati di coste esposti al rischio di inondazione marina
www.ingv.it/stampa-e-urp...
www.ingv.it/stampa-e-urp...
Reposted by diego1972.bsky.social

New research suggests that fast jet-stream winds will get faster and faster in a warming climate.
As this @carbonbrief.org guest post explains, that could mean "stronger severe storms and an increase in clear-air turbulence for aircraft passengers":
www.carbonbrief.org/guest-post-w...
As this @carbonbrief.org guest post explains, that could mean "stronger severe storms and an increase in clear-air turbulence for aircraft passengers":
www.carbonbrief.org/guest-post-w...
December 19, 2023 at 12:43 PM
New research suggests that fast jet-stream winds will get faster and faster in a warming climate.
As this @carbonbrief.org guest post explains, that could mean "stronger severe storms and an increase in clear-air turbulence for aircraft passengers":
www.carbonbrief.org/guest-post-w...
As this @carbonbrief.org guest post explains, that could mean "stronger severe storms and an increase in clear-air turbulence for aircraft passengers":
www.carbonbrief.org/guest-post-w...
Reposted by diego1972.bsky.social

We talk about population growth, and most know we will peak.
Few appreciate that after the peak, population will likely fall as steeply as it increases now.
PS: This alone won't solve env. problems, but create others.
Excellent @nytimes article:
www.nytimes.com/interactive/...
Few appreciate that after the peak, population will likely fall as steeply as it increases now.
PS: This alone won't solve env. problems, but create others.
Excellent @nytimes article:
www.nytimes.com/interactive/...

December 14, 2023 at 7:12 AM
We talk about population growth, and most know we will peak.
Few appreciate that after the peak, population will likely fall as steeply as it increases now.
PS: This alone won't solve env. problems, but create others.
Excellent @nytimes article:
www.nytimes.com/interactive/...
Few appreciate that after the peak, population will likely fall as steeply as it increases now.
PS: This alone won't solve env. problems, but create others.
Excellent @nytimes article:
www.nytimes.com/interactive/...
Reposted by diego1972.bsky.social
IA generativa, polizia predittiva, riconoscimento facciale: cosa sappiamo del regolamento UE sull’intelligenza artificiale

IA generativa, polizia predittiva, riconoscimento facciale: cosa sappiamo del regolamento UE sull’...
Dopo più di due anni di gestazione, un record di 36 ore di negoziazioni estenuanti, una conferenza stampa annunciata e saltata a data da destinarsi, per poi finire in corner a mezzanotte, e un intere...
www.valigiablu.it
December 14, 2023 at 8:12 AM
IA generativa, polizia predittiva, riconoscimento facciale: cosa sappiamo del regolamento UE sull’intelligenza artificiale
Reposted by diego1972.bsky.social
Crisi climatica, arrestare attivisti pacifici che lottano per il loro e il nostro futuro è un sacrilegio

Crisi climatica, arrestare attivisti pacifici che lottano per il loro e il nostro futuro è un sacri...
28 attivisti ambientali sono stati arrestati con le accuse di interruzione di pubblico servizio, violenza privata, manifestazione non autorizzata e sversamento di sostanze pericolose. È solo l��...
www.valigiablu.it
December 13, 2023 at 8:11 AM
Crisi climatica, arrestare attivisti pacifici che lottano per il loro e il nostro futuro è un sacrilegio
Reposted by diego1972.bsky.social

In the first few days of COP28, three more nation states have joined the bloc of now eleven countries calling for a Fossil Fuel Non-Proliferation Treaty - the global initiative to manage an equitable transition away from oil, gas, and coal!
December 5, 2023 at 7:08 AM
In the first few days of COP28, three more nation states have joined the bloc of now eleven countries calling for a Fossil Fuel Non-Proliferation Treaty - the global initiative to manage an equitable transition away from oil, gas, and coal!
Reposted by diego1972.bsky.social

The nonlinear trend shows that the rate of warming in California is accelerating. And current temperatures are 1.95 C above the 1896-1977 average.

December 5, 2023 at 4:39 AM
The nonlinear trend shows that the rate of warming in California is accelerating. And current temperatures are 1.95 C above the 1896-1977 average.
Reposted by diego1972.bsky.social

COP28 was already tarnished by Al Jaber's presidency. It's like putting the Chief Executive of a tobacco company in charge of a conference on lung cancer. Now this.

Cop28 president says there is ‘no science’ behind demands for phase-out of fossil fuels
Exclusive: UAE’s Sultan Al Jaber says phase-out of coal, oil and gas would take world ‘back into caves’
www.theguardian.com
December 3, 2023 at 1:04 PM
COP28 was already tarnished by Al Jaber's presidency. It's like putting the Chief Executive of a tobacco company in charge of a conference on lung cancer. Now this.
Reposted by diego1972.bsky.social

Clauser-ology: Cloudy with a chance of meatballs

Clauser-ology: Cloudy with a chance of meatballs
John Clauser's theory of climate explained. Some of you will have heard of John Clauser because he was an awardee of the 2022 Nobel Prize in Physics for his role in the experimental verification ...
www.realclimate.org
November 18, 2023 at 6:23 PM
Clauser-ology: Cloudy with a chance of meatballs