


Capucine Lechartre
@clechartre.bsky.social
(she/her)
PhD Candidate in Dynamic Macroecology @ WSL and ETH Zürich l climate impact on biome distribution
PhD Candidate in Dynamic Macroecology @ WSL and ETH Zürich l climate impact on biome distribution
Reposted by Capucine Lechartre

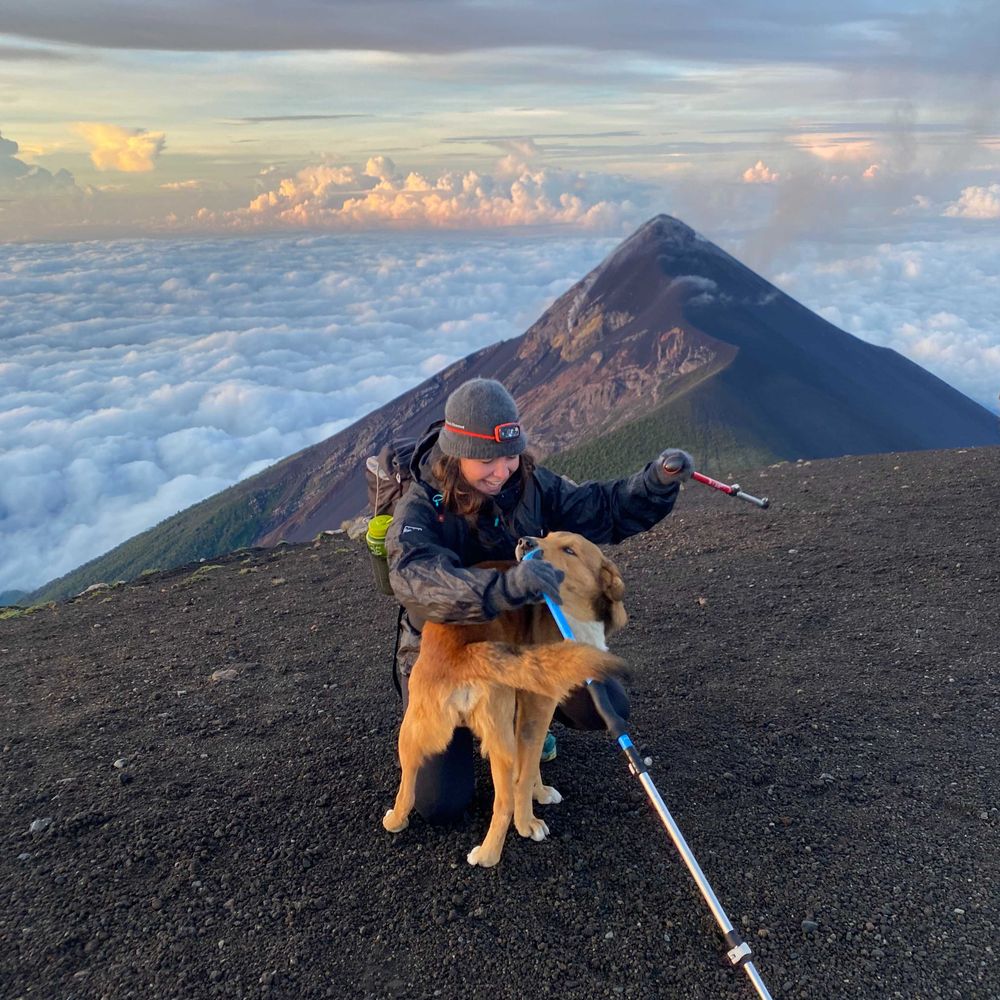
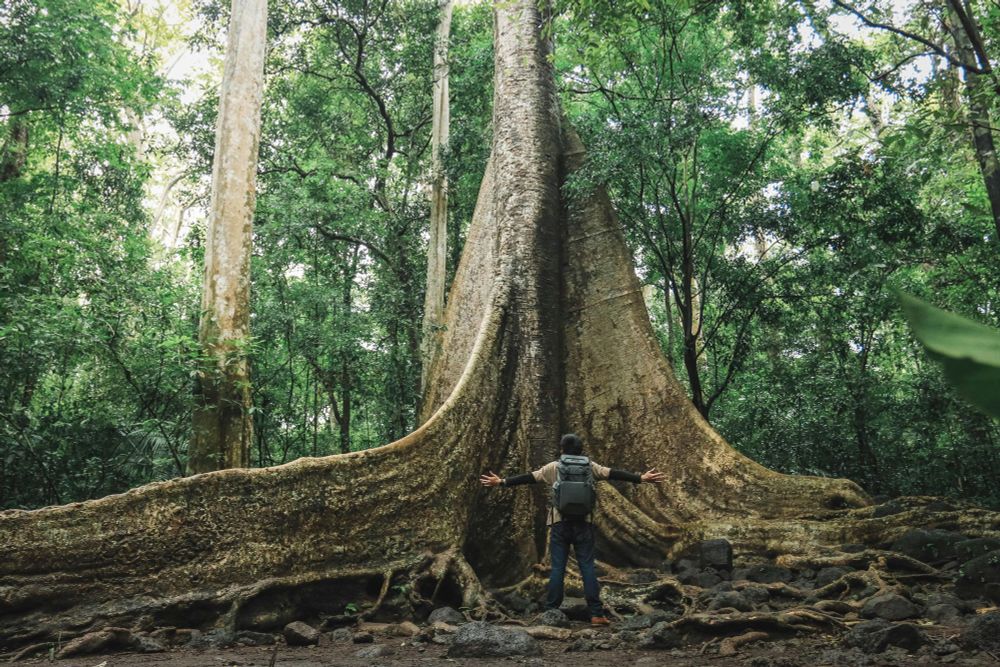
Exploring the tropical cloud forests of #Guacamayos. 🔎 Foggy, rain-soaked and mild temperatures: #cloudforests are some of the most species- and endemism-rich biomes on Earth. Despite covering only 0.4% of global land, they host 3,700 #species of birds, mammals, amphibians and tree ferns. 🌧️🌳🌿


November 14, 2025 at 3:22 PM
Exploring the tropical cloud forests of #Guacamayos. 🔎 Foggy, rain-soaked and mild temperatures: #cloudforests are some of the most species- and endemism-rich biomes on Earth. Despite covering only 0.4% of global land, they host 3,700 #species of birds, mammals, amphibians and tree ferns. 🌧️🌳🌿
Reposted by Capucine Lechartre

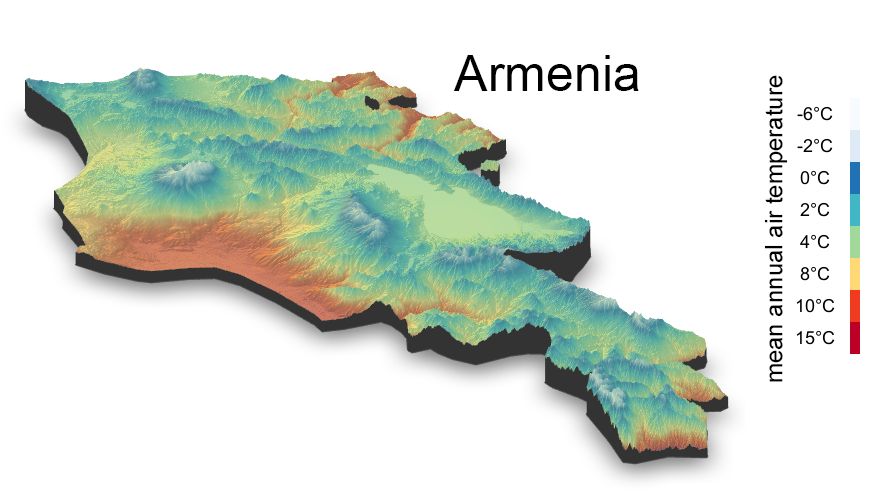
🌿 Join Our Team as Postdoctoral Researcher in Regional Climate Downscaling at the Swiss Federal Research Institute WSL in Switzerland and lead the development of regional, highresolution climate scenarios for Armenia. @wslresearch.bsky.social @wsl-dme.bsky.social apply.refline.ch/273855/1747/...
July 8, 2025 at 10:53 AM
🌿 Join Our Team as Postdoctoral Researcher in Regional Climate Downscaling at the Swiss Federal Research Institute WSL in Switzerland and lead the development of regional, highresolution climate scenarios for Armenia. @wslresearch.bsky.social @wsl-dme.bsky.social apply.refline.ch/273855/1747/...
Reposted by Capucine Lechartre
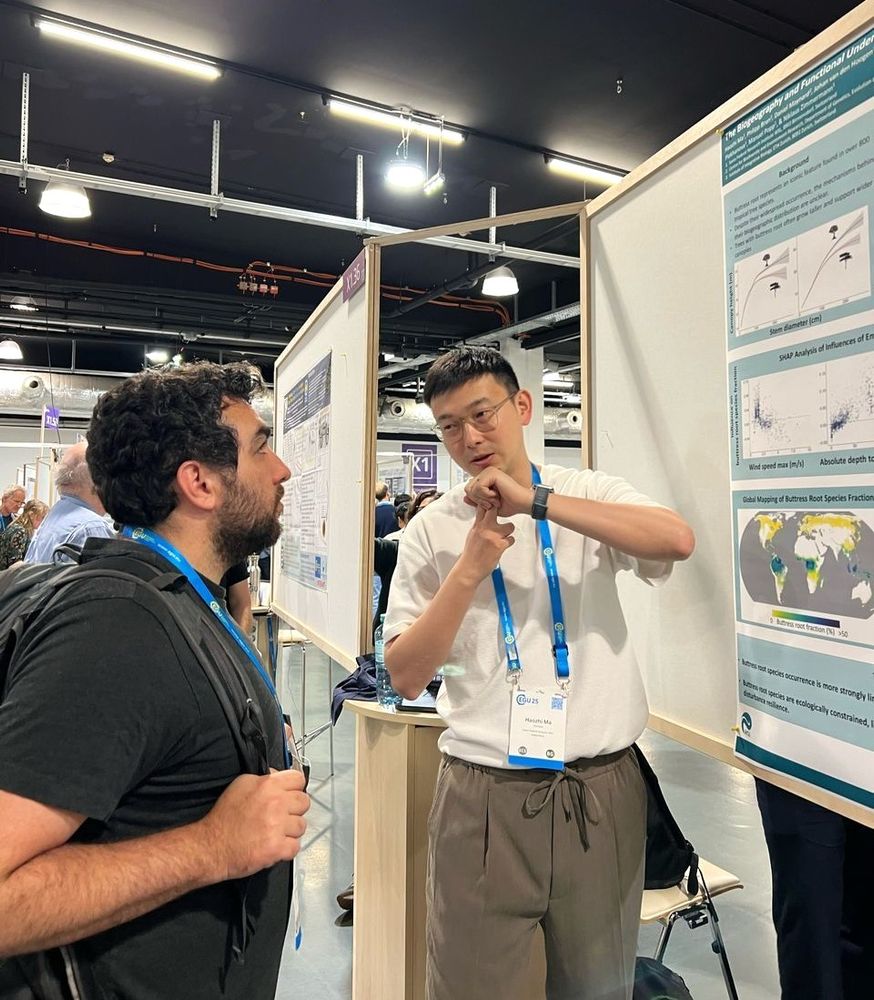
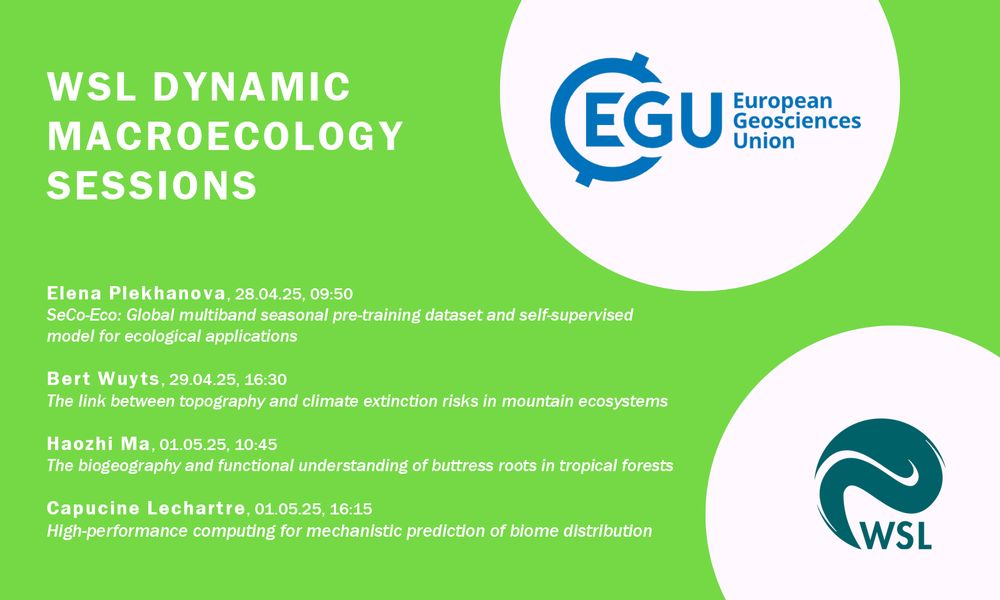
What drives the iconic buttress roots in tropical forests—mechanics or nutrients?🌳 At #EGU25, @haozhima.bsky.social presented his research on “The biogeography & functional understanding of buttress roots in tropical forests”. He’s part of our SNSF Advanced Grant project "BIOME.cc"🌎: rb.gy/r8vy1l
May 6, 2025 at 8:15 AM
What drives the iconic buttress roots in tropical forests—mechanics or nutrients?🌳 At #EGU25, @haozhima.bsky.social presented his research on “The biogeography & functional understanding of buttress roots in tropical forests”. He’s part of our SNSF Advanced Grant project "BIOME.cc"🌎: rb.gy/r8vy1l
Reposted by Capucine Lechartre
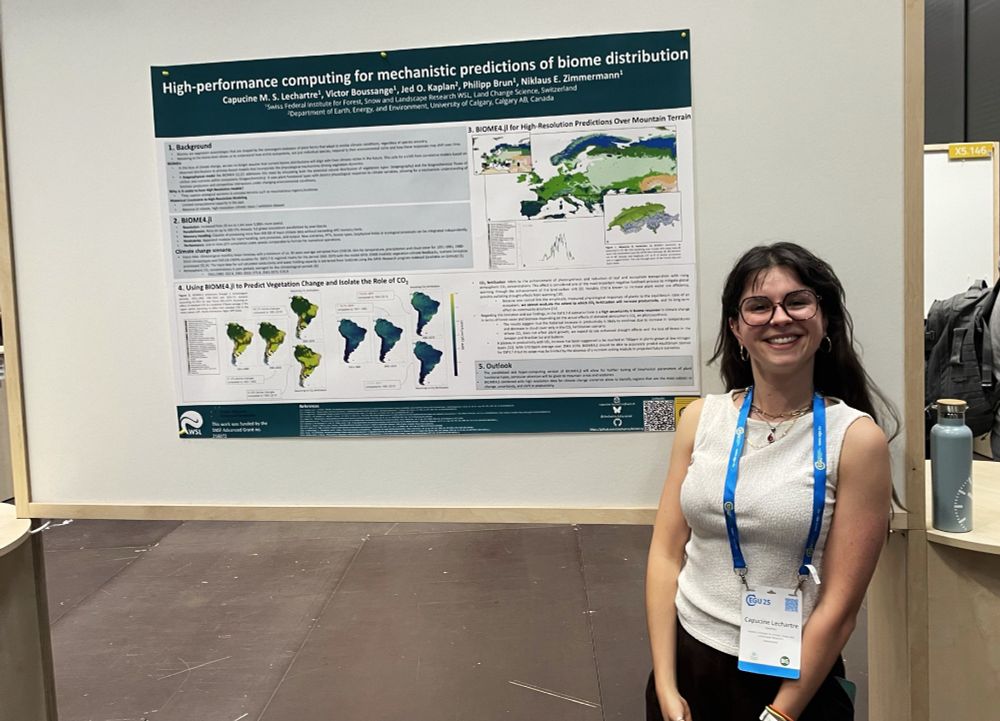
@clechartre.bsky.social held a session on "HP computing for mechanistic prediction of biome distribution" at #EGU25. She presented BIOME4.jl—a hi-res #Julia reimplementation of #BIOME4 to improve performance, modularity & scalability, enabling the simulation of biome dynamics in complex terrains.🌍🖥️
May 4, 2025 at 1:12 PM
@clechartre.bsky.social held a session on "HP computing for mechanistic prediction of biome distribution" at #EGU25. She presented BIOME4.jl—a hi-res #Julia reimplementation of #BIOME4 to improve performance, modularity & scalability, enabling the simulation of biome dynamics in complex terrains.🌍🖥️
Reposted by Capucine Lechartre
Thrilled to share that we will be participating in the European Geosciences Union General Assembly 2025 #EGU25 in #Vienna — with four sessions led by our scientists!🚀 Don’t miss the chance to join their talks and meet them in person for insightful discussions & future collaborations!💡🌱
April 24, 2025 at 5:10 PM
Reposted by Capucine Lechartre
1/ How often does a major droughts hit the Alps? A deep dive into the data. 🌍
Having free and accessible drought data makes it easy to check how climate change has already impacted a region. Using our global drought dataset envidat.ch#/metadata/gl..., I took a closer look at the Alps. 🧵👇
Having free and accessible drought data makes it easy to check how climate change has already impacted a region. Using our global drought dataset envidat.ch#/metadata/gl..., I took a closer look at the Alps. 🧵👇
Envidat
envidat.ch
February 6, 2025 at 4:32 PM
1/ How often does a major droughts hit the Alps? A deep dive into the data. 🌍
Having free and accessible drought data makes it easy to check how climate change has already impacted a region. Using our global drought dataset envidat.ch#/metadata/gl..., I took a closer look at the Alps. 🧵👇
Having free and accessible drought data makes it easy to check how climate change has already impacted a region. Using our global drought dataset envidat.ch#/metadata/gl..., I took a closer look at the Alps. 🧵👇
A piece by my friend Gloria Mariño Briceño on the behind-the-scenes of working with NGOs, and the discrimination, and disrespect of human rights happening in some organizations.
To read on page 25.
www.linkedin.com/posts/gloria...
To read on page 25.
www.linkedin.com/posts/gloria...

Gloria Mariño Briceño on LinkedIn: MER Letter January
Dear LinkedIn Community,
The importance of preserving human rights and workers' rights often seems overshadowed in the world of environmental conservation…
www.linkedin.com
January 31, 2025 at 3:03 PM
A piece by my friend Gloria Mariño Briceño on the behind-the-scenes of working with NGOs, and the discrimination, and disrespect of human rights happening in some organizations.
To read on page 25.
www.linkedin.com/posts/gloria...
To read on page 25.
www.linkedin.com/posts/gloria...
Reposted by Capucine Lechartre

Stay tuned!!
🌳Why are buttress roots almost exclusively found in tropical rainforests? Is it mechanical suppport or nutrient competition? Dr. Haozhi Ma is delving into these fascinating questions to uncover patterns and evolutionary advantages tied to buttress roots.🌎✨ shorturl.at/TtakH
January 29, 2025 at 8:53 AM
Stay tuned!!
Reposted by Capucine Lechartre

In our new review on 'Hydroclimate volatility on a warming Earth' led by @weatherwest.bsky.social, we show that global-averaged subseasonal and interannual whiplash have increased substantially in the past and further increases are anticipated with ongoing warming: www.nature.com/articles/s43...

Hydroclimate volatility on a warming Earth - Nature Reviews Earth & Environment
Rapid transitions between extreme wet and extreme dry conditions — ‘hydroclimate whiplash’ — have marked environmental and societal impacts. This Review outlines observed and projected changes in hydr...
www.nature.com
January 13, 2025 at 5:05 PM
In our new review on 'Hydroclimate volatility on a warming Earth' led by @weatherwest.bsky.social, we show that global-averaged subseasonal and interannual whiplash have increased substantially in the past and further increases are anticipated with ongoing warming: www.nature.com/articles/s43...
Reposted by Capucine Lechartre

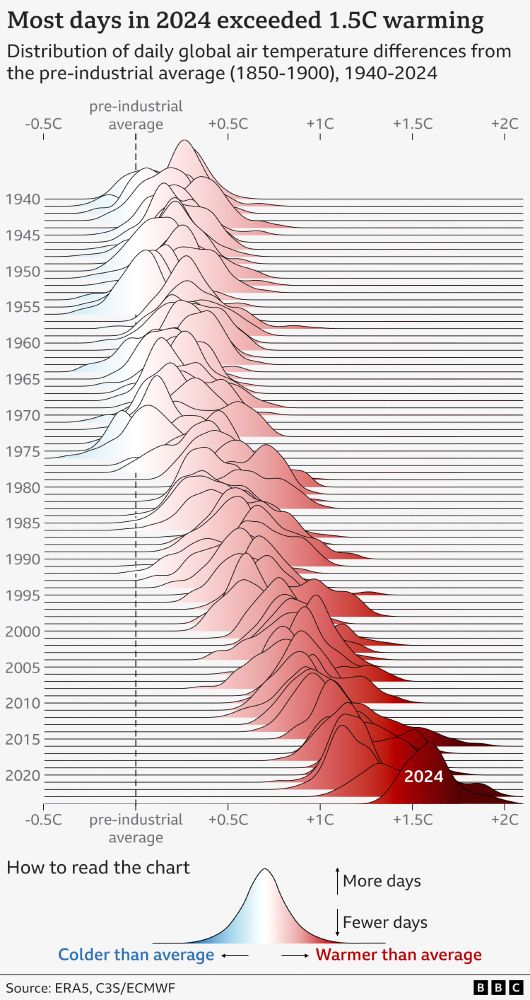
NEW: 2024 has just been confirmed as the warmest year on record, and the first to breach the 1.5C threshold.
We used a ridgeline (Joy Division inspired) chart to visualise daily temperature anomalies since 1940.
2024 clearly stands out with 100% of its days above 1.3C and 75% above 1.5C.
We used a ridgeline (Joy Division inspired) chart to visualise daily temperature anomalies since 1940.
2024 clearly stands out with 100% of its days above 1.3C and 75% above 1.5C.
January 10, 2025 at 8:04 AM
NEW: 2024 has just been confirmed as the warmest year on record, and the first to breach the 1.5C threshold.
We used a ridgeline (Joy Division inspired) chart to visualise daily temperature anomalies since 1940.
2024 clearly stands out with 100% of its days above 1.3C and 75% above 1.5C.
We used a ridgeline (Joy Division inspired) chart to visualise daily temperature anomalies since 1940.
2024 clearly stands out with 100% of its days above 1.3C and 75% above 1.5C.