


Charles Tallack
@charlestallack.bsky.social
Senior Fellow @HealthFdn. Ex-Whitehall civil servant & NHS England.
Love ideas, numbers, analysis, evidence, debate and challenge. Views my own.
Love ideas, numbers, analysis, evidence, debate and challenge. Views my own.
I thought this very insightful too - initially it's specific tasks that get replaced first. Most jobs consist of more than specific tasks.

October 24, 2025 at 7:12 AM
I thought this very insightful too - initially it's specific tasks that get replaced first. Most jobs consist of more than specific tasks.
Completed pathways increased by 2.3% vs 7.9% for appointments. They haven’t risen as quickly as appointments because appointments per completed pathways has increased from 3.9 in July 23 – April 24, to 4.1 a year later.

August 11, 2025 at 7:17 AM
Completed pathways increased by 2.3% vs 7.9% for appointments. They haven’t risen as quickly as appointments because appointments per completed pathways has increased from 3.9 in July 23 – April 24, to 4.1 a year later.
First – is it a notable achievement? 4.6m extra appointments is an increase of 7.9% (table 1). But applying exactly the same approach to the previous year, (ie Jul 23 – Apr 24) the growth in appointments under the Conservatives was 5.5m, an increase of 10.5% (table 2).


August 11, 2025 at 7:17 AM
First – is it a notable achievement? 4.6m extra appointments is an increase of 7.9% (table 1). But applying exactly the same approach to the previous year, (ie Jul 23 – Apr 24) the growth in appointments under the Conservatives was 5.5m, an increase of 10.5% (table 2).
What does all this mean? It’s well known that socioeconomic factors are amongst the most important wider determinants of health. But this analysis uniquely quantifies their impact drawing on individual level Census data.

July 19, 2025 at 8:53 AM
What does all this mean? It’s well known that socioeconomic factors are amongst the most important wider determinants of health. But this analysis uniquely quantifies their impact drawing on individual level Census data.
These are the baseline and adjusted rates (for socioeconomic factors etc) for local authorities in all regions. When adjusted, around half have lower rates than Richmond. Compared to those in other regions, authorities in the North East do well.

July 19, 2025 at 8:53 AM
These are the baseline and adjusted rates (for socioeconomic factors etc) for local authorities in all regions. When adjusted, around half have lower rates than Richmond. Compared to those in other regions, authorities in the North East do well.
This chart shows how the premature mortality rates of local authorities in the NE compare to those in Richmond. Some LAs have rates more than twice as LA.
But if the LAs had the same socioeconomic and ethnicity make-up as Richmond, all except Darlington would have lower rates.
But if the LAs had the same socioeconomic and ethnicity make-up as Richmond, all except Darlington would have lower rates.

July 19, 2025 at 8:53 AM
This chart shows how the premature mortality rates of local authorities in the NE compare to those in Richmond. Some LAs have rates more than twice as LA.
But if the LAs had the same socioeconomic and ethnicity make-up as Richmond, all except Darlington would have lower rates.
But if the LAs had the same socioeconomic and ethnicity make-up as Richmond, all except Darlington would have lower rates.
Unsurprisingly, the ONS analysis shows premature mortality rates (adjusted for differences in age and sex) in the North East are higher than those any other region.
Amongst all local authorities, Richmond-upon-Thames has the lowest premature mortality, Blackpool the highest.
Amongst all local authorities, Richmond-upon-Thames has the lowest premature mortality, Blackpool the highest.

July 19, 2025 at 8:53 AM
Unsurprisingly, the ONS analysis shows premature mortality rates (adjusted for differences in age and sex) in the North East are higher than those any other region.
Amongst all local authorities, Richmond-upon-Thames has the lowest premature mortality, Blackpool the highest.
Amongst all local authorities, Richmond-upon-Thames has the lowest premature mortality, Blackpool the highest.
The North East has the lowest healthy life expectancy, lagging regions with the highest (London/SE) by almost 7 years. Halving that gap means increasing life expectancy and reducing ill health. The biggest gains in life expectancy will come from reducing premature mortality (death before age 75).

July 19, 2025 at 8:53 AM
The North East has the lowest healthy life expectancy, lagging regions with the highest (London/SE) by almost 7 years. Halving that gap means increasing life expectancy and reducing ill health. The biggest gains in life expectancy will come from reducing premature mortality (death before age 75).
And the 92nd percentile of waits would be 16 weeks, comfortably achieving the government’s target. In fact, the removal growth rate could slip to 2.3% and 18 weeks still be achieved.

July 3, 2025 at 10:34 AM
And the 92nd percentile of waits would be 16 weeks, comfortably achieving the government’s target. In fact, the removal growth rate could slip to 2.3% and 18 weeks still be achieved.
This means that the waiting list would be 3.8 million by the time of the election.

July 3, 2025 at 10:34 AM
This means that the waiting list would be 3.8 million by the time of the election.
If these growth rates persist for the rest of the Parliament, by April 2029 annual removals will exceed annual referrals by 1.4m. This is the number by which the waiting list will be falling in the last year of the Parliament.

July 3, 2025 at 10:34 AM
If these growth rates persist for the rest of the Parliament, by April 2029 annual removals will exceed annual referrals by 1.4m. This is the number by which the waiting list will be falling in the last year of the Parliament.
But to revolutionise prevention we need to understand and tackle the factors which lead to earlier death amongst the poorest parts of our society. A whole of government approach is needed, not one relying only on medical science.

June 21, 2025 at 8:46 PM
But to revolutionise prevention we need to understand and tackle the factors which lead to earlier death amongst the poorest parts of our society. A whole of government approach is needed, not one relying only on medical science.
In January a record 11% of patients attending major A&Es waited more than 12h+.
How much was poor NHS performance this winter due to "exceptional pressure" with "mammoth demand" from a quademic of winter illnesses?
This and more in our new analysis:
How much was poor NHS performance this winter due to "exceptional pressure" with "mammoth demand" from a quademic of winter illnesses?
This and more in our new analysis:

April 28, 2025 at 12:02 PM
In January a record 11% of patients attending major A&Es waited more than 12h+.
How much was poor NHS performance this winter due to "exceptional pressure" with "mammoth demand" from a quademic of winter illnesses?
This and more in our new analysis:
How much was poor NHS performance this winter due to "exceptional pressure" with "mammoth demand" from a quademic of winter illnesses?
This and more in our new analysis:
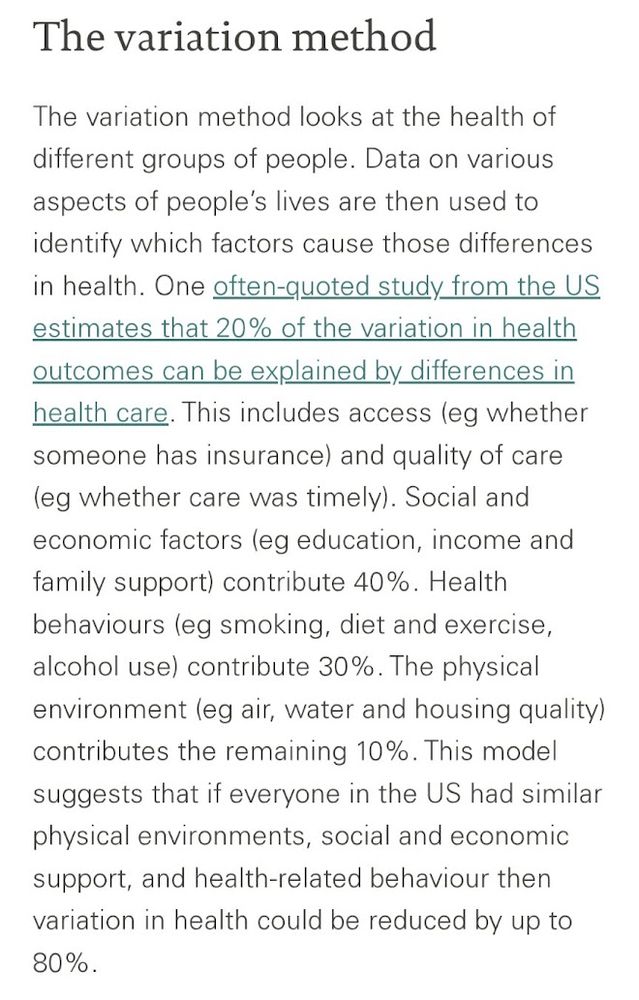
The figure can be traced to a US study showing that 20% of the *variation* in mortality at local level was due to variation in access to healthcare.
April 26, 2025 at 8:55 AM
The figure can be traced to a US study showing that 20% of the *variation* in mortality at local level was due to variation in access to healthcare.
Sarah Neville in the FT on lunch with Amanda Pritchard: "The NHS contributes between 10 and 20 per cent to people’s health, she says — a figure I find startlingly low"
This widely quoted figure is startlingly low because it's probably wrong.🧵
www.ft.com/content/5cf4...
This widely quoted figure is startlingly low because it's probably wrong.🧵
www.ft.com/content/5cf4...

April 26, 2025 at 8:55 AM
Sarah Neville in the FT on lunch with Amanda Pritchard: "The NHS contributes between 10 and 20 per cent to people’s health, she says — a figure I find startlingly low"
This widely quoted figure is startlingly low because it's probably wrong.🧵
www.ft.com/content/5cf4...
This widely quoted figure is startlingly low because it's probably wrong.🧵
www.ft.com/content/5cf4...
Here's what the "record £26 billion extra NHS funding secured at the October Budget" looks like translated in annual real terms growth.
3.2% pa over two years. Higher than during 2010s, but lower than the 3.7% pa in the 40 years preceding the pandemic.
www.health.org.uk/reports-and-...
3.2% pa over two years. Higher than during 2010s, but lower than the 3.7% pa in the 40 years preceding the pandemic.
www.health.org.uk/reports-and-...

April 17, 2025 at 11:36 AM
Here's what the "record £26 billion extra NHS funding secured at the October Budget" looks like translated in annual real terms growth.
3.2% pa over two years. Higher than during 2010s, but lower than the 3.7% pa in the 40 years preceding the pandemic.
www.health.org.uk/reports-and-...
3.2% pa over two years. Higher than during 2010s, but lower than the 3.7% pa in the 40 years preceding the pandemic.
www.health.org.uk/reports-and-...
The response from DHSC and NHSE to our analysis, dismisses the evidence, and doubles down on the claims. This isn't encouraging. If the NHS is to improve we need an evidence-informed approach to change, openness to challenge and honesty about what is and isn’t working.

April 16, 2025 at 6:45 AM
The response from DHSC and NHSE to our analysis, dismisses the evidence, and doubles down on the claims. This isn't encouraging. If the NHS is to improve we need an evidence-informed approach to change, openness to challenge and honesty about what is and isn’t working.
There’s no evidence that FF20 trusts increased treatment volumes or reduced referrals more than in other trusts.
In FF20 trusts, treatment volumes fell slightly on the same period in the previous year. In other trusts they increased by 3.2%.
Referrals rose by the same amount.
In FF20 trusts, treatment volumes fell slightly on the same period in the previous year. In other trusts they increased by 3.2%.
Referrals rose by the same amount.

April 16, 2025 at 6:45 AM
There’s no evidence that FF20 trusts increased treatment volumes or reduced referrals more than in other trusts.
In FF20 trusts, treatment volumes fell slightly on the same period in the previous year. In other trusts they increased by 3.2%.
Referrals rose by the same amount.
In FF20 trusts, treatment volumes fell slightly on the same period in the previous year. In other trusts they increased by 3.2%.
Referrals rose by the same amount.
The is no significant difference between the waiting list reductions in FF20 trusts and other trusts; they show the same patterns. Picking 20 trusts at random would give us the same result or better one time in four.

April 16, 2025 at 6:45 AM
The is no significant difference between the waiting list reductions in FF20 trusts and other trusts; they show the same patterns. Picking 20 trusts at random would give us the same result or better one time in four.
The waiting list falls (slim red bars on the chart) result from additions to the waiting list (pink bars on the chart –referrals) and removals from the waiting list (blue – treatments etc ) during Nov 2024 and Jan 2025. In this context the differences don't look quite as impressive.

April 16, 2025 at 6:45 AM
The waiting list falls (slim red bars on the chart) result from additions to the waiting list (pink bars on the chart –referrals) and removals from the waiting list (blue – treatments etc ) during Nov 2024 and Jan 2025. In this context the differences don't look quite as impressive.
this says that health RDEL spend as share of GDP is 6.8%. This seems low. IFS says 8.4%.

April 9, 2025 at 4:02 PM
this says that health RDEL spend as share of GDP is 6.8%. This seems low. IFS says 8.4%.
Reducing duplication between NHS E and DHSC has been a main plank of the rationale for NHSE's abolition and 50% cuts to the centre. But how much duplication is there?

April 9, 2025 at 10:43 AM
Reducing duplication between NHS E and DHSC has been a main plank of the rationale for NHSE's abolition and 50% cuts to the centre. But how much duplication is there?
Stupidity/pseudo science dressed up as economics in the White House's technical explanation of the tariff calculations
ustr.gov/issue-areas/...
ustr.gov/issue-areas/...

April 5, 2025 at 11:51 AM
Stupidity/pseudo science dressed up as economics in the White House's technical explanation of the tariff calculations
ustr.gov/issue-areas/...
ustr.gov/issue-areas/...
£105bn a year on debt interest (4x social care spend) is a big part of why it feels like many of our public services are in permanent austerity.
The 2008 financial crisis and pandemic response accounts for at least £60bn of that. on.ft.com/4c7agjB via @FT
The 2008 financial crisis and pandemic response accounts for at least £60bn of that. on.ft.com/4c7agjB via @FT


March 26, 2025 at 8:32 AM
£105bn a year on debt interest (4x social care spend) is a big part of why it feels like many of our public services are in permanent austerity.
The 2008 financial crisis and pandemic response accounts for at least £60bn of that. on.ft.com/4c7agjB via @FT
The 2008 financial crisis and pandemic response accounts for at least £60bn of that. on.ft.com/4c7agjB via @FT
The Health Foundation also modelled this and came to a more optimistic conclusion, that the treatment growth required would be 2.4% pa. ⬇️ from IFS report

March 20, 2025 at 7:04 AM
The Health Foundation also modelled this and came to a more optimistic conclusion, that the treatment growth required would be 2.4% pa. ⬇️ from IFS report