


Alaskans for Sustainable Budgets
@ak4sb.bsky.social
A non-partisan project focused on helping develop and advocate for responsible state and federal fiscal policies.
... The PFC trails the S&P 500 on a 5-, 3- and 1-yr avg, as well as 9 of the previous 10 years. Tellingly, the PFC also trails its own passive & performance benchmarks on a rolling 1- & 3-yr avg.
The second chart looks at the comparative Fund balances and POMV draws of the PFC v. ...
3/4
The second chart looks at the comparative Fund balances and POMV draws of the PFC v. ...
3/4

December 2, 2025 at 10:30 PM
... The PFC trails the S&P 500 on a 5-, 3- and 1-yr avg, as well as 9 of the previous 10 years. Tellingly, the PFC also trails its own passive & performance benchmarks on a rolling 1- & 3-yr avg.
The second chart looks at the comparative Fund balances and POMV draws of the PFC v. ...
3/4
The second chart looks at the comparative Fund balances and POMV draws of the PFC v. ...
3/4
The first chart looks at the returns over the relevant periods for the PFC v. the S&P 500 ETF, the PFC's Total Return Objective (CPI +5%) and other PFC benchmarks.
As the chart shows, for FY26, the PFC's return trails the S&P 500 ETF as well as its own passive & performance benchmarks ....
2/4
As the chart shows, for FY26, the PFC's return trails the S&P 500 ETF as well as its own passive & performance benchmarks ....
2/4

December 2, 2025 at 10:30 PM
The first chart looks at the returns over the relevant periods for the PFC v. the S&P 500 ETF, the PFC's Total Return Objective (CPI +5%) and other PFC benchmarks.
As the chart shows, for FY26, the PFC's return trails the S&P 500 ETF as well as its own passive & performance benchmarks ....
2/4
As the chart shows, for FY26, the PFC's return trails the S&P 500 ETF as well as its own passive & performance benchmarks ....
2/4
Rolling Avg Prices & Differentials| To keep track of the relationships, monthly, we look at the average prices for and differentials between ANS, Brent & WTI on a rolling 12-, 6-, 3-, 1-month and FYTD basis. We then incorporate those into our daily pricing outlooks. #akleg #akoil


December 2, 2025 at 7:01 PM
The 8:35a Chart| Given the importance of Permanent Fund returns to #AKrev levels, we have developed a second morning chart focusing on S&P 500 5-, 3- & 1-yr returns v the PFC's. #akleg
* 5-yr: S&P 13.22% v PFC 9.54%
* 3-yr: S&P 18.67% v PFC 10.41%
* 1-yr: S&P 12.93% v PFC 10.10%
* 5-yr: S&P 13.22% v PFC 9.54%
* 3-yr: S&P 18.67% v PFC 10.41%
* 1-yr: S&P 12.93% v PFC 10.10%

December 2, 2025 at 5:35 PM
The 8:30a Chart| To provide context to current $$oil, we publish daily (ex-Su) a running avg of FY26-32 $$ANS, Brent & WTI actual+futures. Projected ANS v. SPRING25 rev F'cast:
> FY26 ⬆️ $1 (+$82mil UGF)
> FY27 ⬇️ $3 (-$103mil)
> FY28-32 ⬆️ $1 (avg annual +$36mil)
#akleg
> FY26 ⬆️ $1 (+$82mil UGF)
> FY27 ⬇️ $3 (-$103mil)
> FY28-32 ⬆️ $1 (avg annual +$36mil)
#akleg

December 2, 2025 at 5:31 PM
The 8:30a Chart| To provide context to current $$oil, we publish daily (ex-Su) a running avg of FY26-32 $$ANS, Brent & WTI actual+futures. Projected ANS v. SPRING25 rev F'cast:
> FY26 ⬆️ $1 (+$82mil UGF)
> FY27 ⬇️ $3 (-$103mil)
> FY28-32 ⬆️ $1 (avg annual +$36mil)
#akleg
> FY26 ⬆️ $1 (+$82mil UGF)
> FY27 ⬇️ $3 (-$103mil)
> FY28-32 ⬆️ $1 (avg annual +$36mil)
#akleg
This Wk's Top 3| The challenge facing the Fall Forecast, is Lt Gov Dahlstrom duplicitous or just dumb & Ralph Samuels is a good Alaskan, but definitely NOT the right choice for the PFC. #akleg T'row, 6:05a on the Michael Dukes Show at buff.ly/qfUxAXB

December 1, 2025 at 11:30 PM
This Wk's Top 3| The challenge facing the Fall Forecast, is Lt Gov Dahlstrom duplicitous or just dumb & Ralph Samuels is a good Alaskan, but definitely NOT the right choice for the PFC. #akleg T'row, 6:05a on the Michael Dukes Show at buff.ly/qfUxAXB
End of Month (Nov25) Summary for ANS Tankers. 15.5 deliveries (Rolling 12-month avg%). #akleg
CA: 8.5 (46%)
WA: 6.0 (42%)
AK: 1.0 (9%)
HI: 0.0 (2%)
Asia: 0.0 (1%)
Significant during the month: 1 HIL in maint.
CA: 8.5 (46%)
WA: 6.0 (42%)
AK: 1.0 (9%)
HI: 0.0 (2%)
Asia: 0.0 (1%)
Significant during the month: 1 HIL in maint.


December 1, 2025 at 7:10 PM
End of Month (Nov25) Summary for ANS Tankers. 15.5 deliveries (Rolling 12-month avg%). #akleg
CA: 8.5 (46%)
WA: 6.0 (42%)
AK: 1.0 (9%)
HI: 0.0 (2%)
Asia: 0.0 (1%)
Significant during the month: 1 HIL in maint.
CA: 8.5 (46%)
WA: 6.0 (42%)
AK: 1.0 (9%)
HI: 0.0 (2%)
Asia: 0.0 (1%)
Significant during the month: 1 HIL in maint.
Exports as a %ANS| Due to COVID, a material share of ANS was exported to Asian (primarily Chinese) mkts from 2Q 2020 to 1Q 2022. However, from shortly after the start of the Ukraine War (Apr22), most has gone to the USWC, w/ only sporadic dels (CY25 YTD: 2%) to Asia. #akleg

December 1, 2025 at 7:05 PM
Exports as a %ANS| Due to COVID, a material share of ANS was exported to Asian (primarily Chinese) mkts from 2Q 2020 to 1Q 2022. However, from shortly after the start of the Ukraine War (Apr22), most has gone to the USWC, w/ only sporadic dels (CY25 YTD: 2%) to Asia. #akleg
USWC Supply Chart| Monthly as data becomes available from EIA we take a look at supply sources into PADD V (USWC) refineries. #akleg
YTD (thru Aug), Alaska running ⬆️ 1.2% v. 2019 USWC mkt share (20.1% v 18.9%), but due to lower demand, vols ⬇️ 38kbd (410kbd). US sources 40% of total USWC supplies.
YTD (thru Aug), Alaska running ⬆️ 1.2% v. 2019 USWC mkt share (20.1% v 18.9%), but due to lower demand, vols ⬇️ 38kbd (410kbd). US sources 40% of total USWC supplies.

December 1, 2025 at 7:01 PM
USWC Supply Chart| Monthly as data becomes available from EIA we take a look at supply sources into PADD V (USWC) refineries. #akleg
YTD (thru Aug), Alaska running ⬆️ 1.2% v. 2019 USWC mkt share (20.1% v 18.9%), but due to lower demand, vols ⬇️ 38kbd (410kbd). US sources 40% of total USWC supplies.
YTD (thru Aug), Alaska running ⬆️ 1.2% v. 2019 USWC mkt share (20.1% v 18.9%), but due to lower demand, vols ⬇️ 38kbd (410kbd). US sources 40% of total USWC supplies.
The 8:35a Chart| Given the importance of Permanent Fund returns to #AKrev levels, we have developed a second morning chart focusing on S&P 500 5-, 3- & 1-yr returns v the PFC's. #akleg
* 5-yr: S&P 13.59% v PFC 9.54%
* 3-yr: S&P 18.85% v PFC 10.41%
* 1-yr: S&P 13.54% v PFC 10.10%
* 5-yr: S&P 13.59% v PFC 9.54%
* 3-yr: S&P 18.85% v PFC 10.41%
* 1-yr: S&P 13.54% v PFC 10.10%

December 1, 2025 at 5:35 PM
The 8:30a Chart| To provide context to current $$oil, we publish daily (ex-Su) a running avg of FY26-32 $$ANS, Brent & WTI actual+futures. Projected ANS v. SPRING25 rev F'cast:
> FY26 ⬆️ $1 (+$55mil UGF)
> FY27 ⬇️ $4 (-$133mil)
> FY28-32 even (avg annual $0mil)
#akleg
> FY26 ⬆️ $1 (+$55mil UGF)
> FY27 ⬇️ $4 (-$133mil)
> FY28-32 even (avg annual $0mil)
#akleg

December 1, 2025 at 5:30 PM
The 8:30a Chart| To provide context to current $$oil, we publish daily (ex-Su) a running avg of FY26-32 $$ANS, Brent & WTI actual+futures. Projected ANS v. SPRING25 rev F'cast:
> FY26 ⬆️ $1 (+$55mil UGF)
> FY27 ⬇️ $4 (-$133mil)
> FY28-32 even (avg annual $0mil)
#akleg
> FY26 ⬆️ $1 (+$55mil UGF)
> FY27 ⬇️ $4 (-$133mil)
> FY28-32 even (avg annual $0mil)
#akleg
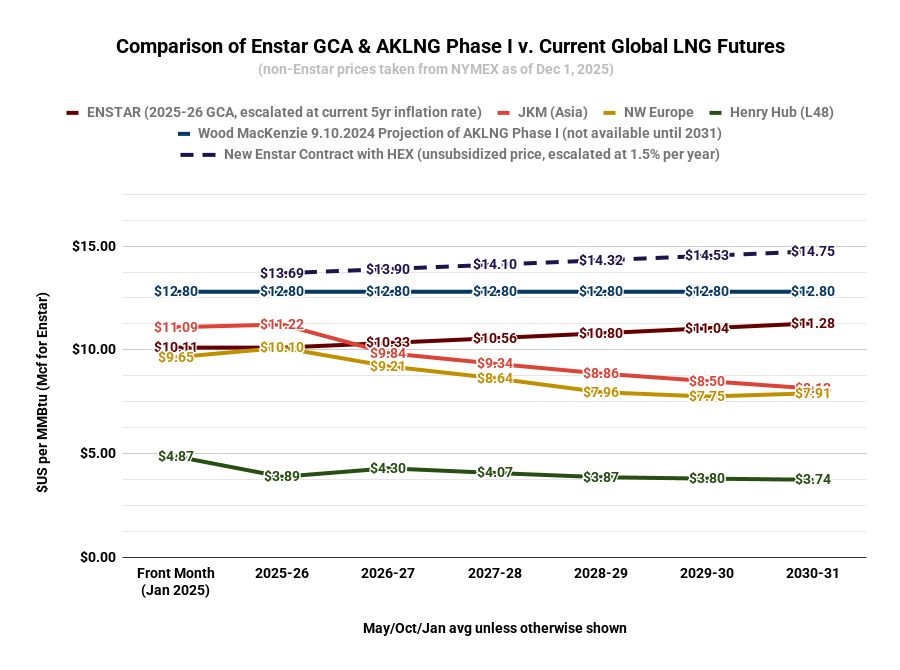
The Monday Chart| To put Alaska's in-state gas prices in global context, once wkly we compare Enstar's current Gas Cost Adjustment v. global markers. 2025-26 Enstar price is 10% ⬇️ Asia, 160% ⬆️ L48. 5yr forward avg, Enstar 22% ⬆️ Asia, 174% ⬆️ L48. #akleg
1/2
1/2
December 1, 2025 at 4:01 PM
The Monday Chart| To put Alaska's in-state gas prices in global context, once wkly we compare Enstar's current Gas Cost Adjustment v. global markers. 2025-26 Enstar price is 10% ⬇️ Asia, 160% ⬆️ L48. 5yr forward avg, Enstar 22% ⬆️ Asia, 174% ⬆️ L48. #akleg
1/2
1/2
Exports as a %ANS| Due to COVID, a material share of ANS was exported to Asian (primarily Chinese) mkts from 2Q 2020 to 1Q 2022. However, from shortly after the start of the Ukraine War (Apr22), most has gone to the USWC, w/ only sporadic dels (CY25 YTD: 2%) to Asia. #akleg
November 30, 2025 at 7:05 PM
Exports as a %ANS| Due to COVID, a material share of ANS was exported to Asian (primarily Chinese) mkts from 2Q 2020 to 1Q 2022. However, from shortly after the start of the Ukraine War (Apr22), most has gone to the USWC, w/ only sporadic dels (CY25 YTD: 2%) to Asia. #akleg
𝙄𝙣𝙩𝙚𝙧𝙚𝙨𝙩 𝙧𝙖𝙩𝙚𝙨: We track the current Fed funds rate + 10-, 20- & 30-year US Treas Bond yields. buff.ly/DnoHrsR
Effective Fed funds rate: 3.88%
US Treas Bond yields --
**10-Yr: 4.00%**
20-Yr: 4.60%
30-Yr: 4.64%
4/end
Effective Fed funds rate: 3.88%
US Treas Bond yields --
**10-Yr: 4.00%**
20-Yr: 4.60%
30-Yr: 4.64%
4/end

November 30, 2025 at 5:30 PM
𝙄𝙣𝙩𝙚𝙧𝙚𝙨𝙩 𝙧𝙖𝙩𝙚𝙨: We track the current Fed funds rate + 10-, 20- & 30-year US Treas Bond yields. buff.ly/DnoHrsR
Effective Fed funds rate: 3.88%
US Treas Bond yields --
**10-Yr: 4.00%**
20-Yr: 4.60%
30-Yr: 4.64%
4/end
Effective Fed funds rate: 3.88%
US Treas Bond yields --
**10-Yr: 4.00%**
20-Yr: 4.60%
30-Yr: 4.64%
4/end
> Second, the current rate + forward expectations as measured in the Treas market. buff.ly/Ta5DMOf
Current: 3.02% (Sept)
10yr Avg: 2.23%
Next 5yrs: 2.29%
5 yrs Beyond That: 2.17%
3/4
Current: 3.02% (Sept)
10yr Avg: 2.23%
Next 5yrs: 2.29%
5 yrs Beyond That: 2.17%
3/4

November 30, 2025 at 5:30 PM
> Second, the current rate + forward expectations as measured in the Treas market. buff.ly/Ta5DMOf
Current: 3.02% (Sept)
10yr Avg: 2.23%
Next 5yrs: 2.29%
5 yrs Beyond That: 2.17%
3/4
Current: 3.02% (Sept)
10yr Avg: 2.23%
Next 5yrs: 2.29%
5 yrs Beyond That: 2.17%
3/4
> First, accumulated inflation (as measured by the Alaska PCE & Alaska CPI) over the last 10 years. buff.ly/GfXomE3
PCE: up 50.0% (5.0%/yr)
CPI: up 24.6% (2.5%/yr)
2/4
PCE: up 50.0% (5.0%/yr)
CPI: up 24.6% (2.5%/yr)
2/4

November 30, 2025 at 5:30 PM
> First, accumulated inflation (as measured by the Alaska PCE & Alaska CPI) over the last 10 years. buff.ly/GfXomE3
PCE: up 50.0% (5.0%/yr)
CPI: up 24.6% (2.5%/yr)
2/4
PCE: up 50.0% (5.0%/yr)
CPI: up 24.6% (2.5%/yr)
2/4
The Sunday Chart| To help assess the ANS market, wkly we review the status of the ANS tanker fleet. Notes: 1 (HIL) moored at KR for maint; no MPC in service. #akleg
* Deliveries month to date: 15.5
* Not in ANS service: 1 (HIL maint.)
* Asia: 0
* USWC: 9 (5 CP, 2 HIL, 2 XOM) in runs
* Deliveries month to date: 15.5
* Not in ANS service: 1 (HIL maint.)
* Asia: 0
* USWC: 9 (5 CP, 2 HIL, 2 XOM) in runs

November 30, 2025 at 4:00 PM
The Sunday Chart| To help assess the ANS market, wkly we review the status of the ANS tanker fleet. Notes: 1 (HIL) moored at KR for maint; no MPC in service. #akleg
* Deliveries month to date: 15.5
* Not in ANS service: 1 (HIL maint.)
* Asia: 0
* USWC: 9 (5 CP, 2 HIL, 2 XOM) in runs
* Deliveries month to date: 15.5
* Not in ANS service: 1 (HIL maint.)
* Asia: 0
* USWC: 9 (5 CP, 2 HIL, 2 XOM) in runs
The Rolling 4-Wk Avgs| To provide perspective on $$ANS trends as well as the relationship b/w ANS & other reference prices, wkly we chart the 4-wk avg & differentials. Current ANS 4-wk avg $65, ahead of both Brent ($1.14) and Brent/WTI avg ($3.06). #akleg

November 29, 2025 at 10:00 PM
The Rolling 4-Wk Avgs| To provide perspective on $$ANS trends as well as the relationship b/w ANS & other reference prices, wkly we chart the 4-wk avg & differentials. Current ANS 4-wk avg $65, ahead of both Brent ($1.14) and Brent/WTI avg ($3.06). #akleg
The 8:35a Chart| Given the importance of Permanent Fund returns to #AKrev levels, we have developed a second morning chart focusing on S&P 500 5-, 3- & 1-yr returns v the PFC's. #akleg
* 5-yr: S&P 13.59% v PFC 9.54%
* 3-yr: S&P 18.85% v PFC 10.41%
* 1-yr: S&P 13.54% v PFC 10.10%
* 5-yr: S&P 13.59% v PFC 9.54%
* 3-yr: S&P 18.85% v PFC 10.41%
* 1-yr: S&P 13.54% v PFC 10.10%
November 29, 2025 at 5:35 PM
The 8:30a Chart| To provide context to current $$oil, we publish daily (ex-Su) a running avg of FY26-32 $$ANS, Brent & WTI actual+futures. Projected ANS v. SPRING25 rev F'cast:
> FY26 ⬆️ $1 (+$46mil UGF)
> FY27 ⬇️ $4 (-$133mil)
> FY28-32 even (avg annual $0mil)
#akleg
> FY26 ⬆️ $1 (+$46mil UGF)
> FY27 ⬇️ $4 (-$133mil)
> FY28-32 even (avg annual $0mil)
#akleg

November 29, 2025 at 5:30 PM
The 8:30a Chart| To provide context to current $$oil, we publish daily (ex-Su) a running avg of FY26-32 $$ANS, Brent & WTI actual+futures. Projected ANS v. SPRING25 rev F'cast:
> FY26 ⬆️ $1 (+$46mil UGF)
> FY27 ⬇️ $4 (-$133mil)
> FY28-32 even (avg annual $0mil)
#akleg
> FY26 ⬆️ $1 (+$46mil UGF)
> FY27 ⬇️ $4 (-$133mil)
> FY28-32 even (avg annual $0mil)
#akleg
Building on that, we publish a second chart tracking the impact of the revs generated at current projected oil price levels against the FY26 waterfall. At projected price, production & spending levels, projected revs are $50mil ⬇️ breakeven.
2/end
2/end

November 29, 2025 at 4:00 PM
Building on that, we publish a second chart tracking the impact of the revs generated at current projected oil price levels against the FY26 waterfall. At projected price, production & spending levels, projected revs are $50mil ⬇️ breakeven.
2/end
2/end
The Saturday Charts| Each Saturday, we compare current FY gross oil revs v. DOR's most recent (NOW SPRING25) F'cast. W/ 41% of FY26 booked, projected annual gross revs (blue) running ⬇️ 1% v Spring25 F'cast rev. Projected FY26 WAVG currently $66. #akleg
1/2
1/2

November 29, 2025 at 4:00 PM
The Saturday Charts| Each Saturday, we compare current FY gross oil revs v. DOR's most recent (NOW SPRING25) F'cast. W/ 41% of FY26 booked, projected annual gross revs (blue) running ⬇️ 1% v Spring25 F'cast rev. Projected FY26 WAVG currently $66. #akleg
1/2
1/2
* Abandoning a rules-based PFD and using the "leftover" PFD approach (which reduces the PFD over the period to 14.6% of the POMV draw).
As the charts demonstrate, the first approach spreads the burden proportionately among all #AKfams. The second, third & fourth are increasingly regressive ...
5/6
As the charts demonstrate, the first approach spreads the burden proportionately among all #AKfams. The second, third & fourth are increasingly regressive ...
5/6

November 28, 2025 at 10:00 PM
* Abandoning a rules-based PFD and using the "leftover" PFD approach (which reduces the PFD over the period to 14.6% of the POMV draw).
As the charts demonstrate, the first approach spreads the burden proportionately among all #AKfams. The second, third & fourth are increasingly regressive ...
5/6
As the charts demonstrate, the first approach spreads the burden proportionately among all #AKfams. The second, third & fourth are increasingly regressive ...
5/6
* Restructuring the PFD as POMV 50/50, w/ the remaining deficit filled through a flat tax,
* Restructuring the PFD as POMV 25/75, w/ the additional deficit (above POMV 25/75) filled through a flat tax,
4/6
* Restructuring the PFD as POMV 25/75, w/ the additional deficit (above POMV 25/75) filled through a flat tax,
4/6


November 28, 2025 at 10:00 PM
* Restructuring the PFD as POMV 50/50, w/ the remaining deficit filled through a flat tax,
* Restructuring the PFD as POMV 25/75, w/ the additional deficit (above POMV 25/75) filled through a flat tax,
4/6
* Restructuring the PFD as POMV 25/75, w/ the additional deficit (above POMV 25/75) filled through a flat tax,
4/6
... (32% of the UGF budget, ~4.7% of Alaska AGI, ~3.0% of Alaska Private Sector GDP).
𝙎𝙚𝙘𝙤𝙣𝙙, we then look at four ways of closing the deficit.
* Retaining the current law PFD and using a flat tax to close the deficit instead,
3/6
𝙎𝙚𝙘𝙤𝙣𝙙, we then look at four ways of closing the deficit.
* Retaining the current law PFD and using a flat tax to close the deficit instead,
3/6

November 28, 2025 at 10:00 PM
... (32% of the UGF budget, ~4.7% of Alaska AGI, ~3.0% of Alaska Private Sector GDP).
𝙎𝙚𝙘𝙤𝙣𝙙, we then look at four ways of closing the deficit.
* Retaining the current law PFD and using a flat tax to close the deficit instead,
3/6
𝙎𝙚𝙘𝙤𝙣𝙙, we then look at four ways of closing the deficit.
* Retaining the current law PFD and using a flat tax to close the deficit instead,
3/6