


Vinicius Oike
@viniciusoike.bsky.social
Economist and Data Scientist | https://restateinsight.com/blog
São Paulo, Brazil
São Paulo, Brazil
When I say that Claude is very good at coding in R, there are caveats.

November 4, 2025 at 8:14 PM
When I say that Claude is very good at coding in R, there are caveats.
Reposted by Vinicius Oike

As G10 countries succumb to simplistic populism, reckless fiscal policy and fiscal dominance of their central banks, the line between the G10 and EM is getting blurred. Real long-term interest rates in the G10 have begun to rise towards EM levels...
robinjbrooks.substack.com/p/the-global...
robinjbrooks.substack.com/p/the-global...

September 25, 2025 at 10:03 AM
As G10 countries succumb to simplistic populism, reckless fiscal policy and fiscal dominance of their central banks, the line between the G10 and EM is getting blurred. Real long-term interest rates in the G10 have begun to rise towards EM levels...
robinjbrooks.substack.com/p/the-global...
robinjbrooks.substack.com/p/the-global...
Reposted by Vinicius Oike

Closeread Prize winners are here! 🏆
Want to create engaging, scroll-based stories with your data? See stunning scrollytelling examples made with Quarto: posit.co/blog/closere...
Learn more about Closeread and its power to create dynamic narratives. Congrats winners! #Quarto #RStats #Python
Want to create engaging, scroll-based stories with your data? See stunning scrollytelling examples made with Quarto: posit.co/blog/closere...
Learn more about Closeread and its power to create dynamic narratives. Congrats winners! #Quarto #RStats #Python
February 24, 2025 at 3:14 PM
Closeread Prize winners are here! 🏆
Want to create engaging, scroll-based stories with your data? See stunning scrollytelling examples made with Quarto: posit.co/blog/closere...
Learn more about Closeread and its power to create dynamic narratives. Congrats winners! #Quarto #RStats #Python
Want to create engaging, scroll-based stories with your data? See stunning scrollytelling examples made with Quarto: posit.co/blog/closere...
Learn more about Closeread and its power to create dynamic narratives. Congrats winners! #Quarto #RStats #Python
Claude can be savage at times

September 23, 2025 at 2:27 PM
Claude can be savage at times
What happens when you get lazy and don't follow your own advice...

September 19, 2025 at 6:56 PM
What happens when you get lazy and don't follow your own advice...
Happy to know I'm not the only one who creates a ggplot2 theme package for every company I work with #positconf.
Not only does it standardize communication, but it also makes a great impression. theme_quintoandar() took about a day to make and led to me reporting directly to the C-level.
Not only does it standardize communication, but it also makes a great impression. theme_quintoandar() took about a day to make and led to me reporting directly to the C-level.
September 19, 2025 at 6:55 PM
Happy to know I'm not the only one who creates a ggplot2 theme package for every company I work with #positconf.
Not only does it standardize communication, but it also makes a great impression. theme_quintoandar() took about a day to make and led to me reporting directly to the C-level.
Not only does it standardize communication, but it also makes a great impression. theme_quintoandar() took about a day to make and led to me reporting directly to the C-level.
Been working with ClaudeCode for the past ~2 months (mainly R and Quarto). My main tips:
1. Plan a lot.
2. Manually approve (auto-accept only for very simple tasks).
3. Create knowledge that can be referenced.
4. Avoid /compact and auto-compacting.
1. Plan a lot.
2. Manually approve (auto-accept only for very simple tasks).
3. Create knowledge that can be referenced.
4. Avoid /compact and auto-compacting.
September 17, 2025 at 7:40 PM
Been working with ClaudeCode for the past ~2 months (mainly R and Quarto). My main tips:
1. Plan a lot.
2. Manually approve (auto-accept only for very simple tasks).
3. Create knowledge that can be referenced.
4. Avoid /compact and auto-compacting.
1. Plan a lot.
2. Manually approve (auto-accept only for very simple tasks).
3. Create knowledge that can be referenced.
4. Avoid /compact and auto-compacting.
I've been using Air since switching to Positron and have been loving it. My only criticism is the styling of tibbles (it just breaks them). Apparently that has been solved
# fmt: tabular
coming soon
#PositConf
# fmt: tabular
coming soon
#PositConf
September 17, 2025 at 7:24 PM
I've been using Air since switching to Positron and have been loving it. My only criticism is the styling of tibbles (it just breaks them). Apparently that has been solved
# fmt: tabular
coming soon
#PositConf
# fmt: tabular
coming soon
#PositConf
Reposted by Vinicius Oike

The fastest way to start using & exploring the new 2024 1-year ACS data?
R with tidycensus + mapgl.
With just a few lines of code, you can pull down any of the thousands of variables available in the new data and explore on an interactive MapLibre map.
R with tidycensus + mapgl.
With just a few lines of code, you can pull down any of the thousands of variables available in the new data and explore on an interactive MapLibre map.
September 11, 2025 at 8:05 PM
The fastest way to start using & exploring the new 2024 1-year ACS data?
R with tidycensus + mapgl.
With just a few lines of code, you can pull down any of the thousands of variables available in the new data and explore on an interactive MapLibre map.
R with tidycensus + mapgl.
With just a few lines of code, you can pull down any of the thousands of variables available in the new data and explore on an interactive MapLibre map.
Reposted by Vinicius Oike

Jair Bolsonaro was sentenced to more than 27 years in a Brazil prison for attempting a coup after losing the 2022 election.

Bolsonaro Convicted of Attempting a Coup in Brazil, Sentenced to 27 Years in Prison
Brazil’s Supreme Court convicted the former president of trying to cling to power after losing the 2022 election, including a plan to assassinate his opponent.
nyti.ms
September 11, 2025 at 11:10 PM
Jair Bolsonaro was sentenced to more than 27 years in a Brazil prison for attempting a coup after losing the 2022 election.
Reposted by Vinicius Oike

I was loving Claude Code... until I tried it with #rstats. Constant errors, wouldn't use the tidyverse even when asked, "optimized" functions were slower.
Frustrated, I started a session just to teach R to Claude and summarize what it learned into a CLAUDE.md file gist.github.com/sj-io/3828d6...
Frustrated, I started a session just to teach R to Claude and summarize what it learned into a CLAUDE.md file gist.github.com/sj-io/3828d6...

Claude R Tidyverse Expert
Claude R Tidyverse Expert. GitHub Gist: instantly share code, notes, and snippets.
gist.github.com
August 21, 2025 at 10:18 AM
I was loving Claude Code... until I tried it with #rstats. Constant errors, wouldn't use the tidyverse even when asked, "optimized" functions were slower.
Frustrated, I started a session just to teach R to Claude and summarize what it learned into a CLAUDE.md file gist.github.com/sj-io/3828d6...
Frustrated, I started a session just to teach R to Claude and summarize what it learned into a CLAUDE.md file gist.github.com/sj-io/3828d6...
Reposted by Vinicius Oike
Saw a post from an influencer telling followers to "stop using R for anything -- use Python like a normal person"
As a 10+ year R & Python user, the irony is that 2025 is the best time EVER to be using R.
Here's why:
As a 10+ year R & Python user, the irony is that 2025 is the best time EVER to be using R.
Here's why:


September 1, 2025 at 2:13 PM
Saw a post from an influencer telling followers to "stop using R for anything -- use Python like a normal person"
As a 10+ year R & Python user, the irony is that 2025 is the best time EVER to be using R.
Here's why:
As a 10+ year R & Python user, the irony is that 2025 is the best time EVER to be using R.
Here's why:
What a great piece on online advertising. Summarizes beautifully my frustrations when working as a data scientist (with econ background) in a big marketing department.
Leaders justified decisions with bad metrics, fueled by biased samples.
thecorrespondent.com/100/the-new-...
Leaders justified decisions with bad metrics, fueled by biased samples.
thecorrespondent.com/100/the-new-...

The new dot com bubble is here: it’s called online advertising
In 2018 $273bn was spent on digital ads globally. We delve into the world of clicks, banners and keywords to find out if any of it is real. What do we really know about the effectiveness of digital ad...
thecorrespondent.com
August 21, 2025 at 2:25 PM
What a great piece on online advertising. Summarizes beautifully my frustrations when working as a data scientist (with econ background) in a big marketing department.
Leaders justified decisions with bad metrics, fueled by biased samples.
thecorrespondent.com/100/the-new-...
Leaders justified decisions with bad metrics, fueled by biased samples.
thecorrespondent.com/100/the-new-...
Forgot some Positron shoutouts,
@andrew.heiss.phd has a nice post talking about Positron (www.andrewheiss.com/blog/2024/07...) and Albert Rapp also has one (3mw.albert-rapp.de/p/using-the-...)
@andrew.heiss.phd has a nice post talking about Positron (www.andrewheiss.com/blog/2024/07...) and Albert Rapp also has one (3mw.albert-rapp.de/p/using-the-...)

Fun with Positron | Andrew Heiss
Combine the best of RStudio and Visual Studio Code in Posit’s new Positron IDE
www.andrewheiss.com
August 4, 2025 at 2:59 AM
Forgot some Positron shoutouts,
@andrew.heiss.phd has a nice post talking about Positron (www.andrewheiss.com/blog/2024/07...) and Albert Rapp also has one (3mw.albert-rapp.de/p/using-the-...)
@andrew.heiss.phd has a nice post talking about Positron (www.andrewheiss.com/blog/2024/07...) and Albert Rapp also has one (3mw.albert-rapp.de/p/using-the-...)
Almost reaching 100 posts in my blog restateinsight.com/blog.
Feel like it's time to reorganize things. I created this blog back in 2019 to post R tutorials on econometrics and data visualization. I posted everything in Portuguese since I felt there was lack of R-related materials in Portuguese.
Feel like it's time to reorganize things. I created this blog back in 2019 to post R tutorials on econometrics and data visualization. I posted everything in Portuguese since I felt there was lack of R-related materials in Portuguese.
Blog – Vinicius Oike
restateinsight.com
August 3, 2025 at 11:16 PM
Almost reaching 100 posts in my blog restateinsight.com/blog.
Feel like it's time to reorganize things. I created this blog back in 2019 to post R tutorials on econometrics and data visualization. I posted everything in Portuguese since I felt there was lack of R-related materials in Portuguese.
Feel like it's time to reorganize things. I created this blog back in 2019 to post R tutorials on econometrics and data visualization. I posted everything in Portuguese since I felt there was lack of R-related materials in Portuguese.
Overall, Positron has some great benefits over RStudio. It's faster, lighter, and after some customization looks a lot nicer.
There are still issues. The main one that comes to mind is the overall inferior autocomplete.
Also, autocomplete for Quarto docs seems to breakdown at some point.
There are still issues. The main one that comes to mind is the overall inferior autocomplete.
Also, autocomplete for Quarto docs seems to breakdown at some point.
August 3, 2025 at 10:59 PM
Overall, Positron has some great benefits over RStudio. It's faster, lighter, and after some customization looks a lot nicer.
There are still issues. The main one that comes to mind is the overall inferior autocomplete.
Also, autocomplete for Quarto docs seems to breakdown at some point.
There are still issues. The main one that comes to mind is the overall inferior autocomplete.
Also, autocomplete for Quarto docs seems to breakdown at some point.
Last month I tried to pick up Positron as my main IDE. First two weeks were rough and I found myself going back to RStudio some times for both Quarto and R.
After much stress I am now using Positron daily.
The process did make me realize how much of a petty person I am when it comes to IDEs.
After much stress I am now using Positron daily.
The process did make me realize how much of a petty person I am when it comes to IDEs.
August 3, 2025 at 10:50 PM
Last month I tried to pick up Positron as my main IDE. First two weeks were rough and I found myself going back to RStudio some times for both Quarto and R.
After much stress I am now using Positron daily.
The process did make me realize how much of a petty person I am when it comes to IDEs.
After much stress I am now using Positron daily.
The process did make me realize how much of a petty person I am when it comes to IDEs.
Reposted by Vinicius Oike

City of London:
- 57% more cycling since 2022
- 1.8 times more bikes than cars
- People walking, wheeling and cycling now make up 75% of observed travel activity
- Motor vehicle volumes down 70% since 1999
www.cityoflondon.gov.uk/assets/Servi...
- 57% more cycling since 2022
- 1.8 times more bikes than cars
- People walking, wheeling and cycling now make up 75% of observed travel activity
- Motor vehicle volumes down 70% since 1999
www.cityoflondon.gov.uk/assets/Servi...


April 25, 2025 at 2:23 PM
City of London:
- 57% more cycling since 2022
- 1.8 times more bikes than cars
- People walking, wheeling and cycling now make up 75% of observed travel activity
- Motor vehicle volumes down 70% since 1999
www.cityoflondon.gov.uk/assets/Servi...
- 57% more cycling since 2022
- 1.8 times more bikes than cars
- People walking, wheeling and cycling now make up 75% of observed travel activity
- Motor vehicle volumes down 70% since 1999
www.cityoflondon.gov.uk/assets/Servi...
Reposted by Vinicius Oike

Economic contraction in the US is attributable entirely to tariffs

April 30, 2025 at 1:09 PM
Economic contraction in the US is attributable entirely to tariffs
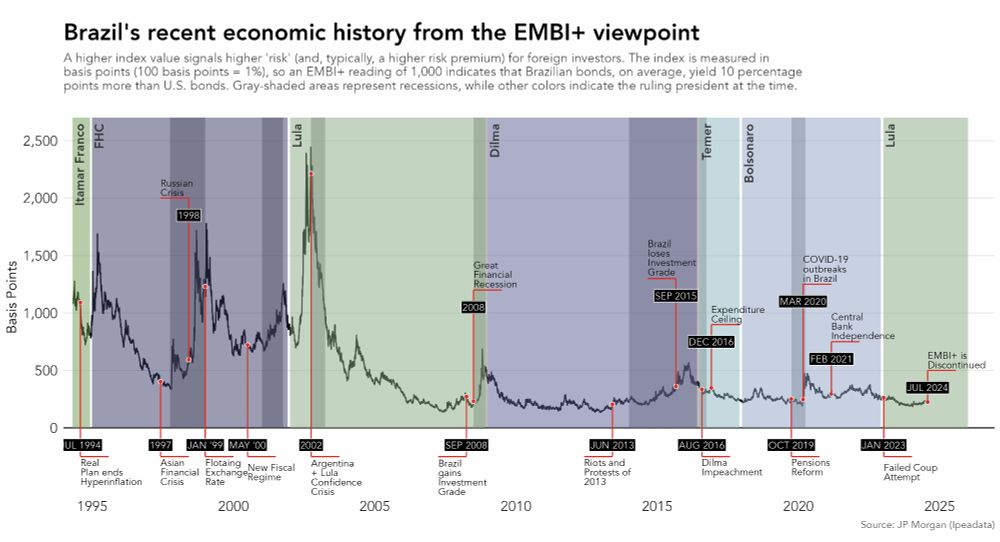
Still missing some plots, but wanted to share this one.
Day 25 #30DayChartChallenge | Uncertainties: Risk
The plot shows the "Brazil Risk" measured by the EMBI+ and highlights key economic/political events. This index broadly measures the risk that foreign investors face when investing in Brazil.
Day 25 #30DayChartChallenge | Uncertainties: Risk
The plot shows the "Brazil Risk" measured by the EMBI+ and highlights key economic/political events. This index broadly measures the risk that foreign investors face when investing in Brazil.
April 30, 2025 at 8:15 PM
Still missing some plots, but wanted to share this one.
Day 25 #30DayChartChallenge | Uncertainties: Risk
The plot shows the "Brazil Risk" measured by the EMBI+ and highlights key economic/political events. This index broadly measures the risk that foreign investors face when investing in Brazil.
Day 25 #30DayChartChallenge | Uncertainties: Risk
The plot shows the "Brazil Risk" measured by the EMBI+ and highlights key economic/political events. This index broadly measures the risk that foreign investors face when investing in Brazil.
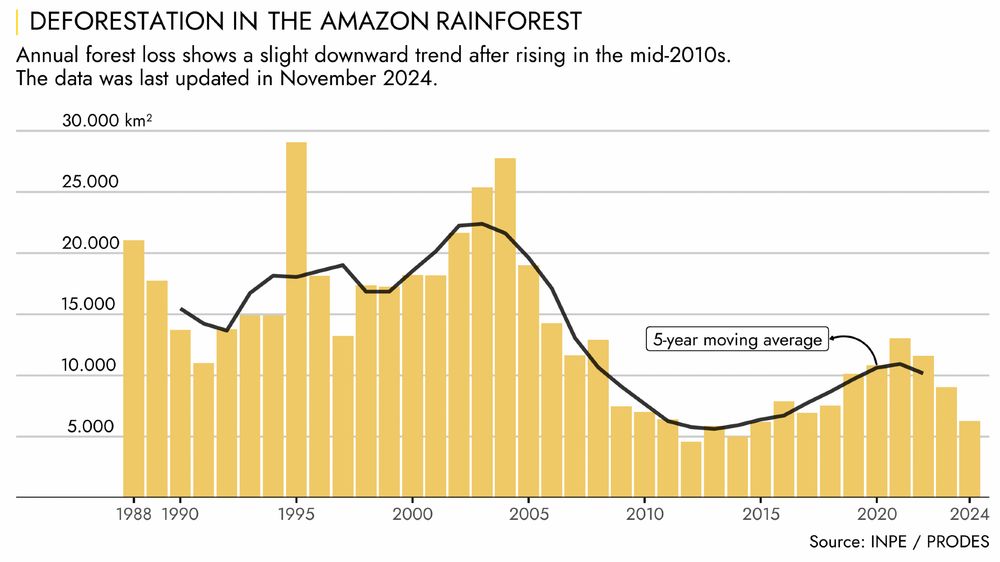
Day 30 #30DayChartChallenge | National Geographic
This chart shows the deforestation of the Amazon rainforest over the years, based on satellite imagery.
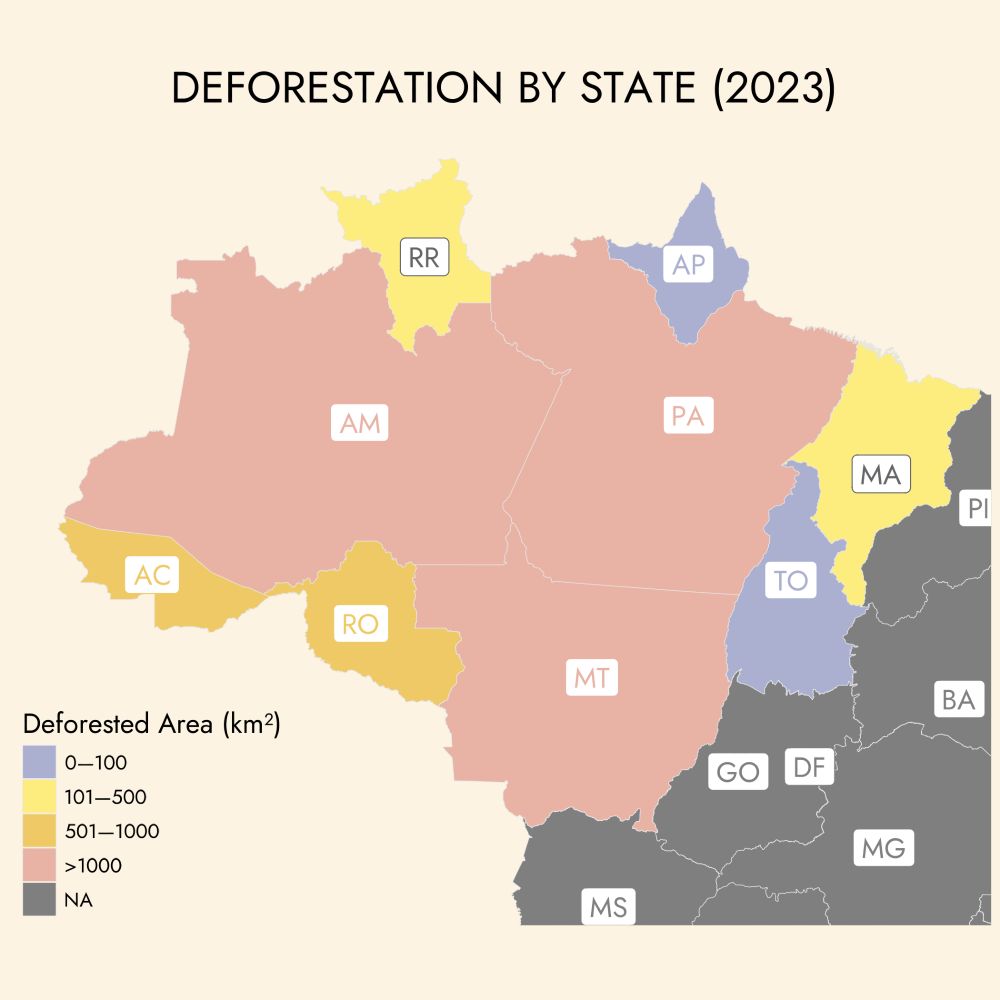
This year's COP30 will take place in Belém, Pará—a state that has consistently ranked among the top 2 in deforestation, since 1988.
This chart shows the deforestation of the Amazon rainforest over the years, based on satellite imagery.
This year's COP30 will take place in Belém, Pará—a state that has consistently ranked among the top 2 in deforestation, since 1988.
April 30, 2025 at 3:15 PM
Day 30 #30DayChartChallenge | National Geographic
This chart shows the deforestation of the Amazon rainforest over the years, based on satellite imagery.
This year's COP30 will take place in Belém, Pará—a state that has consistently ranked among the top 2 in deforestation, since 1988.
This chart shows the deforestation of the Amazon rainforest over the years, based on satellite imagery.
This year's COP30 will take place in Belém, Pará—a state that has consistently ranked among the top 2 in deforestation, since 1988.
Reposted by Vinicius Oike

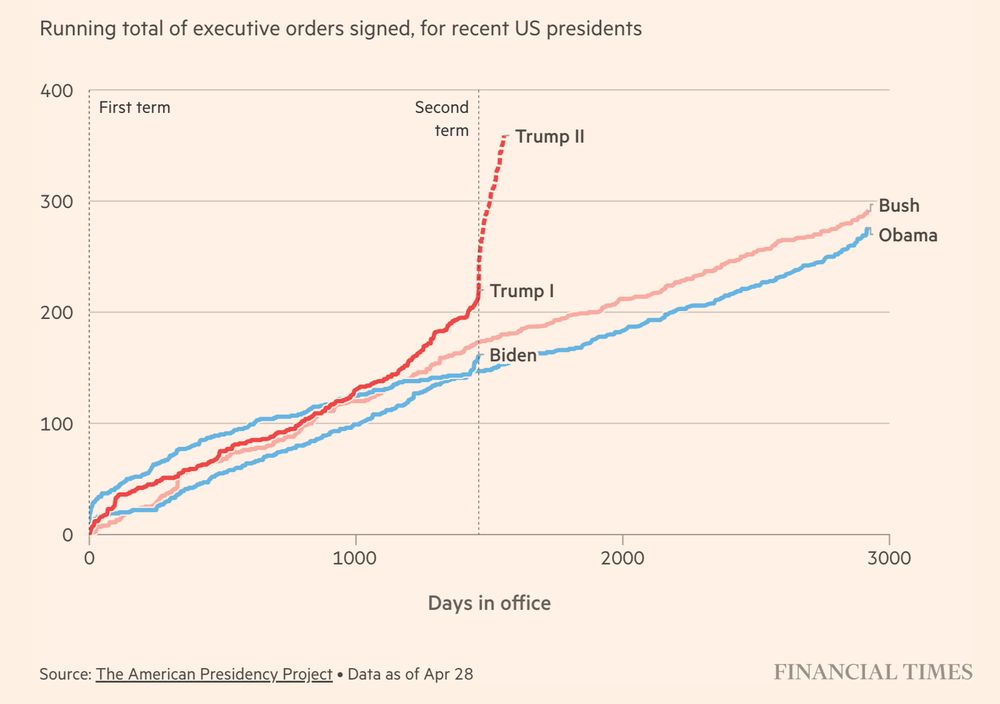
...and he's doing this with his party in control of both houses of congress
www.ft.com/content/9d3e...
www.ft.com/content/9d3e...
April 29, 2025 at 3:53 PM
...and he's doing this with his party in control of both houses of congress
www.ft.com/content/9d3e...
www.ft.com/content/9d3e...
Day 29 #30DayChartChallenge | Uncertainties: extraterrestrial
For day 29, I aggregated U.S. box office numbers for movies featuring aliens—any kind of extraterrestrial life counts. Alien sci-fi really dipped between 1986 and 1995 (Predator 2, Alien 3, Coneheads...).
For day 29, I aggregated U.S. box office numbers for movies featuring aliens—any kind of extraterrestrial life counts. Alien sci-fi really dipped between 1986 and 1995 (Predator 2, Alien 3, Coneheads...).

April 30, 2025 at 2:13 AM
Day 29 #30DayChartChallenge | Uncertainties: extraterrestrial
For day 29, I aggregated U.S. box office numbers for movies featuring aliens—any kind of extraterrestrial life counts. Alien sci-fi really dipped between 1986 and 1995 (Predator 2, Alien 3, Coneheads...).
For day 29, I aggregated U.S. box office numbers for movies featuring aliens—any kind of extraterrestrial life counts. Alien sci-fi really dipped between 1986 and 1995 (Predator 2, Alien 3, Coneheads...).
Day 4 #30DayChartChallenge | Comparisons: Big or Small
Choropleth maps of Brazil can be very deceiving. The Midwest and North regions cover about 65% of the country’s area but house only 16% of its population.
Maps show Aging Index: ratio of the pop. aged 65 and over to those aged 14 and under.
Choropleth maps of Brazil can be very deceiving. The Midwest and North regions cover about 65% of the country’s area but house only 16% of its population.
Maps show Aging Index: ratio of the pop. aged 65 and over to those aged 14 and under.


April 28, 2025 at 2:52 PM
Day 4 #30DayChartChallenge | Comparisons: Big or Small
Choropleth maps of Brazil can be very deceiving. The Midwest and North regions cover about 65% of the country’s area but house only 16% of its population.
Maps show Aging Index: ratio of the pop. aged 65 and over to those aged 14 and under.
Choropleth maps of Brazil can be very deceiving. The Midwest and North regions cover about 65% of the country’s area but house only 16% of its population.
Maps show Aging Index: ratio of the pop. aged 65 and over to those aged 14 and under.