


Koen Van den Eeckhout
@vandeneeckhoutkoen.bsky.social
📊 Turning complex data into powerful visual stories!
Author of 'Powerful Charts'. Ex-physicist. He/him 🏳️🌈
Author of 'Powerful Charts'. Ex-physicist. He/him 🏳️🌈
Pinned

Hey all!
With a large inflow of new followers across multiple platforms, it might be a good idea to re-introduce myself.
I'm a freelance information designer from Belgium, often operating under the alias 'Baryon Design'.
(1/4)
With a large inflow of new followers across multiple platforms, it might be a good idea to re-introduce myself.
I'm a freelance information designer from Belgium, often operating under the alias 'Baryon Design'.
(1/4)
I love vector images. But not for the obvious reasons.
The obvious benefits are well known:
✅ they're infinitely scalable without worries about the resolution
✅ they're easy and fast to edit
1/4
#informationdesign
The obvious benefits are well known:
✅ they're infinitely scalable without worries about the resolution
✅ they're easy and fast to edit
1/4
#informationdesign

November 21, 2025 at 8:30 AM
I love vector images. But not for the obvious reasons.
The obvious benefits are well known:
✅ they're infinitely scalable without worries about the resolution
✅ they're easy and fast to edit
1/4
#informationdesign
The obvious benefits are well known:
✅ they're infinitely scalable without worries about the resolution
✅ they're easy and fast to edit
1/4
#informationdesign
🎨 Not sure how your color combination will look like in real life?
I love how Coolors' "Palette Visualizer" helps you with exactly that in a fast and simple way: pick any color combination and see it applied in illustrations, typography, and even a dashboard.
1/3
I love how Coolors' "Palette Visualizer" helps you with exactly that in a fast and simple way: pick any color combination and see it applied in illustrations, typography, and even a dashboard.
1/3

November 14, 2025 at 12:09 PM
🎨 Not sure how your color combination will look like in real life?
I love how Coolors' "Palette Visualizer" helps you with exactly that in a fast and simple way: pick any color combination and see it applied in illustrations, typography, and even a dashboard.
1/3
I love how Coolors' "Palette Visualizer" helps you with exactly that in a fast and simple way: pick any color combination and see it applied in illustrations, typography, and even a dashboard.
1/3
It's fine to have an unusual chart type. But you might consider giving your audience some help interpreting it.
A connected scatter plot, for example, is not the most common type of chart. And when one dimension is the derivative of the other it gets even more complicated.
1/5
A connected scatter plot, for example, is not the most common type of chart. And when one dimension is the derivative of the other it gets even more complicated.
1/5

November 7, 2025 at 4:12 PM
It's fine to have an unusual chart type. But you might consider giving your audience some help interpreting it.
A connected scatter plot, for example, is not the most common type of chart. And when one dimension is the derivative of the other it gets even more complicated.
1/5
A connected scatter plot, for example, is not the most common type of chart. And when one dimension is the derivative of the other it gets even more complicated.
1/5
#Dataviz newsletters! Here are the ones you shouldn't miss:
📩 Data Vis Dispatch, by Datawrapper - this is the one I never miss - my Nobel Prize visual was featured in a recent edition, I'm always super proud when that happens!
www.datawrapper.de/blog/newslet...
1/5
📩 Data Vis Dispatch, by Datawrapper - this is the one I never miss - my Nobel Prize visual was featured in a recent edition, I'm always super proud when that happens!
www.datawrapper.de/blog/newslet...
1/5

October 31, 2025 at 9:36 AM
#Dataviz newsletters! Here are the ones you shouldn't miss:
📩 Data Vis Dispatch, by Datawrapper - this is the one I never miss - my Nobel Prize visual was featured in a recent edition, I'm always super proud when that happens!
www.datawrapper.de/blog/newslet...
1/5
📩 Data Vis Dispatch, by Datawrapper - this is the one I never miss - my Nobel Prize visual was featured in a recent edition, I'm always super proud when that happens!
www.datawrapper.de/blog/newslet...
1/5
Not sure at all how I feel about this. Completely free? What if the 'AI as an upsell' route doesn't work out?

Yessssssssssss! I had a sneaking feeling they may do this 🙌🏻
Affinity (now all three apps in one) is FREE 🤑
No restrictions, other than the AI tools (that nobody wants) only being available to Canva subscribers.
www.affinity.studio
#photography #art #design #illustration
Affinity (now all three apps in one) is FREE 🤑
No restrictions, other than the AI tools (that nobody wants) only being available to Canva subscribers.
www.affinity.studio
#photography #art #design #illustration

October 31, 2025 at 8:28 AM
Not sure at all how I feel about this. Completely free? What if the 'AI as an upsell' route doesn't work out?
Qualitative information design: don't underestimate how much you can design with only text!
1/8
1/8

October 28, 2025 at 2:26 PM
Qualitative information design: don't underestimate how much you can design with only text!
1/8
1/8
Reposted by Koen Van den Eeckhout

Absolutely delighted to catch up with Xenographics, an initiative of @maartenzam.bsky.social. It was a big thing on Twitter some 4-5 years ago and I wish that the conversation would carry over on Bluesky. 📊
xeno.graphics
xeno.graphics
Xenographics – Weird but (sometimes) useful charts
xeno.graphics
October 23, 2025 at 1:29 AM
Absolutely delighted to catch up with Xenographics, an initiative of @maartenzam.bsky.social. It was a big thing on Twitter some 4-5 years ago and I wish that the conversation would carry over on Bluesky. 📊
xeno.graphics
xeno.graphics
Data visualization can help any field or domain, that's why it's so powerful!
In the past few months I've worked with experts in energy, HR, finance, biomedicine, food, technology,... All of them encounter similar problems when it comes to effective communication of data.
In the past few months I've worked with experts in energy, HR, finance, biomedicine, food, technology,... All of them encounter similar problems when it comes to effective communication of data.
October 22, 2025 at 8:15 AM
Data visualization can help any field or domain, that's why it's so powerful!
In the past few months I've worked with experts in energy, HR, finance, biomedicine, food, technology,... All of them encounter similar problems when it comes to effective communication of data.
In the past few months I've worked with experts in energy, HR, finance, biomedicine, food, technology,... All of them encounter similar problems when it comes to effective communication of data.
Now that all the Nobel laureates for 2025 are known, it's time to update my 'Women of the Nobel Prize' visual!
This year, 2 women received the Prize.
1/4
#nobelprize #infographic
This year, 2 women received the Prize.
1/4
#nobelprize #infographic

October 14, 2025 at 8:26 AM
Now that all the Nobel laureates for 2025 are known, it's time to update my 'Women of the Nobel Prize' visual!
This year, 2 women received the Prize.
1/4
#nobelprize #infographic
This year, 2 women received the Prize.
1/4
#nobelprize #infographic
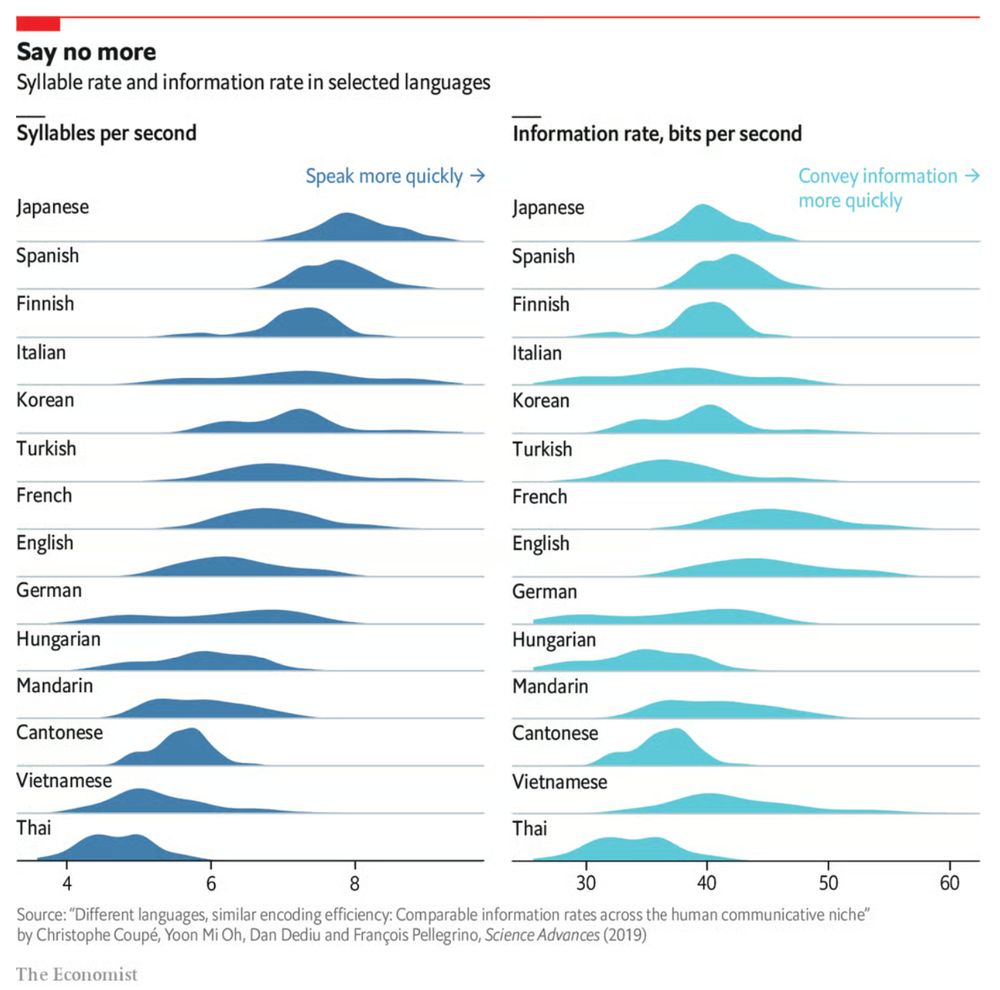
Some languages are spoken faster, but most languages have similar information rates.
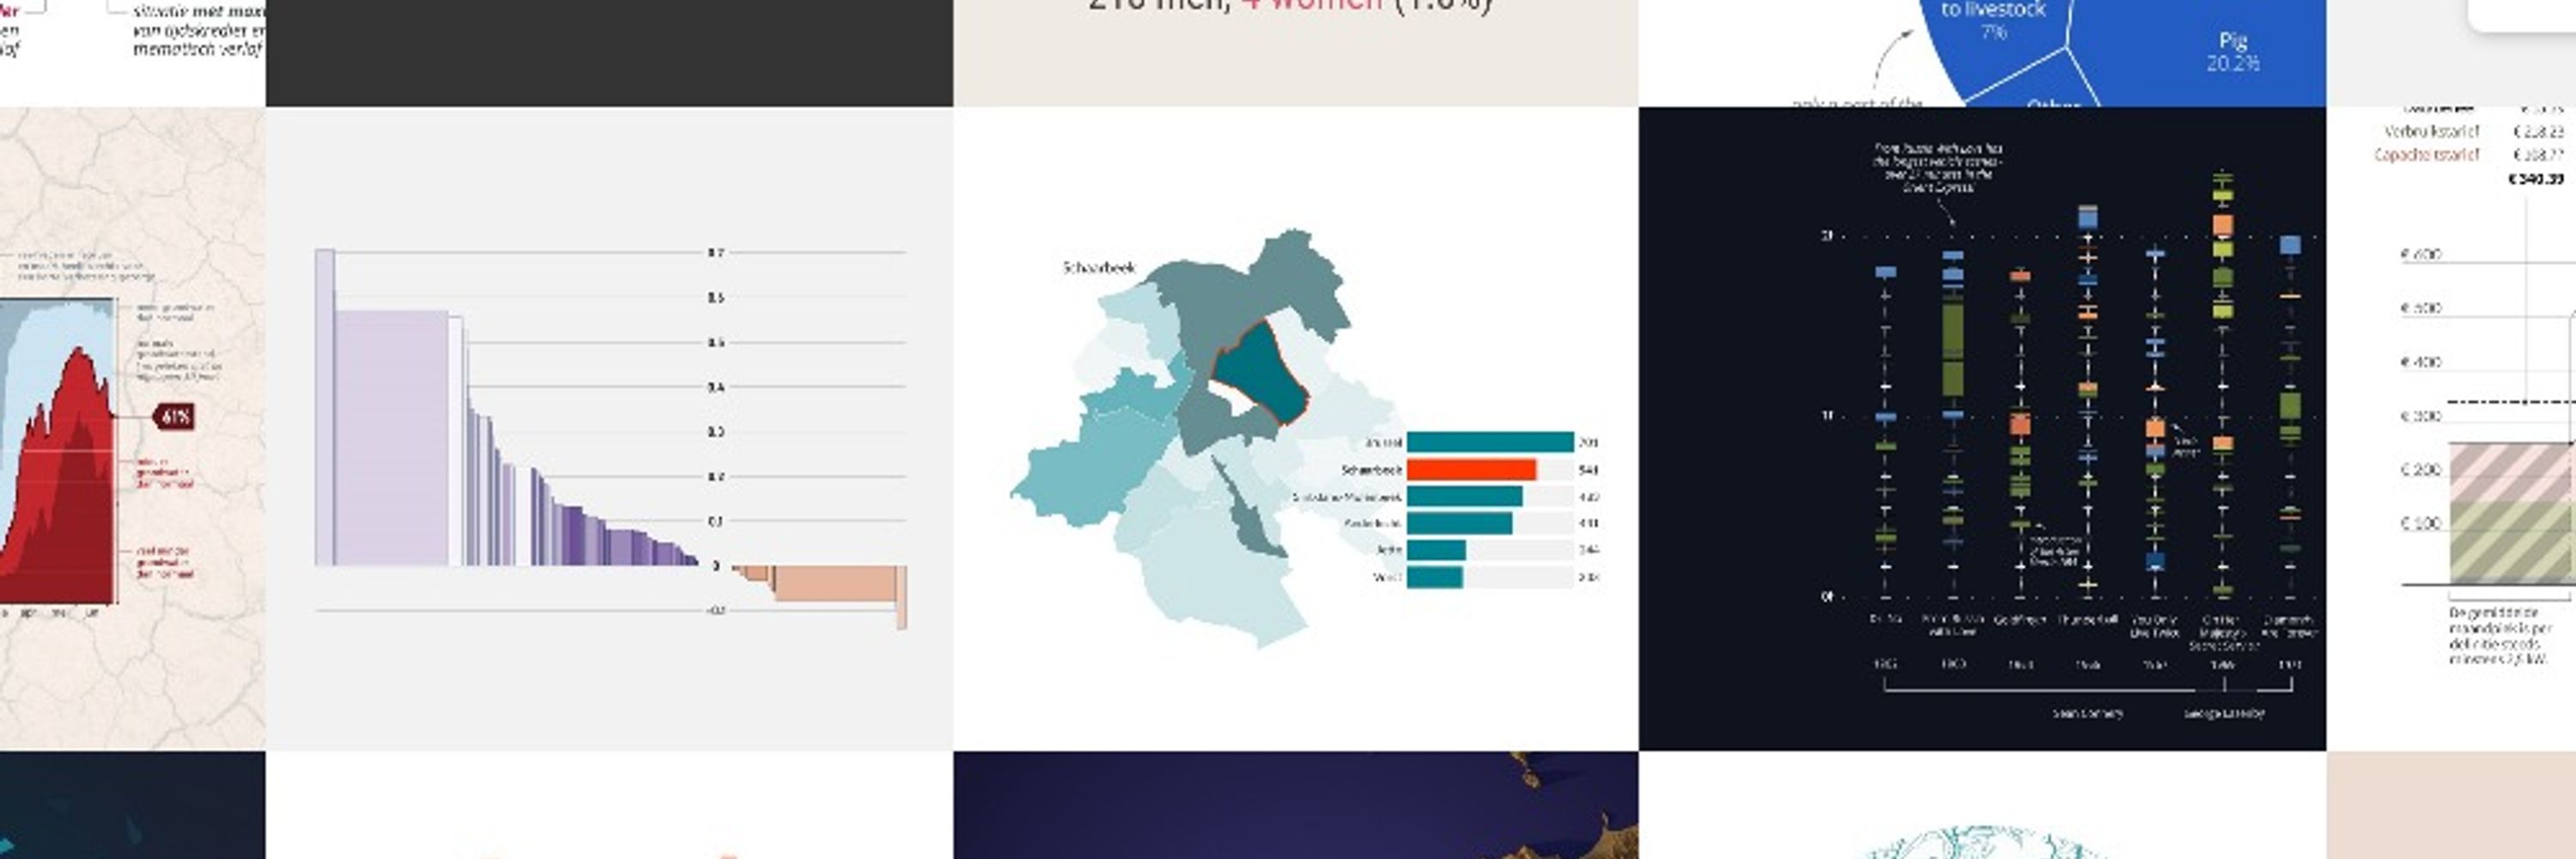
When it comes to insightful data visuals, The Economist is a source of inspiration you shouldn't miss. Their 'Graphic Detail' section is a goldmine of charts:
www.economist.com/topics/graph...
1/2
When it comes to insightful data visuals, The Economist is a source of inspiration you shouldn't miss. Their 'Graphic Detail' section is a goldmine of charts:
www.economist.com/topics/graph...
1/2
October 7, 2025 at 2:44 PM
Some languages are spoken faster, but most languages have similar information rates.
When it comes to insightful data visuals, The Economist is a source of inspiration you shouldn't miss. Their 'Graphic Detail' section is a goldmine of charts:
www.economist.com/topics/graph...
1/2
When it comes to insightful data visuals, The Economist is a source of inspiration you shouldn't miss. Their 'Graphic Detail' section is a goldmine of charts:
www.economist.com/topics/graph...
1/2
Why do some infographics feel very professional, while yours feels amateurish?
There are 3 essential keys you might be missing:
🔑 Sketching: never start creating an infographic without working on paper first. Sketch ideas, explore layouts, iterate!
1/3
There are 3 essential keys you might be missing:
🔑 Sketching: never start creating an infographic without working on paper first. Sketch ideas, explore layouts, iterate!
1/3

September 30, 2025 at 8:04 AM
Why do some infographics feel very professional, while yours feels amateurish?
There are 3 essential keys you might be missing:
🔑 Sketching: never start creating an infographic without working on paper first. Sketch ideas, explore layouts, iterate!
1/3
There are 3 essential keys you might be missing:
🔑 Sketching: never start creating an infographic without working on paper first. Sketch ideas, explore layouts, iterate!
1/3
Gridlines >>> axes
Almost always, gridlines are better than axes. At least for vertical axes.
I admit, vertical axes are the default option, and they have been around for centuries, so they are very well known. But your typical vertical axis also has some downsides.
1/15
Almost always, gridlines are better than axes. At least for vertical axes.
I admit, vertical axes are the default option, and they have been around for centuries, so they are very well known. But your typical vertical axis also has some downsides.
1/15

September 25, 2025 at 7:51 AM
Gridlines >>> axes
Almost always, gridlines are better than axes. At least for vertical axes.
I admit, vertical axes are the default option, and they have been around for centuries, so they are very well known. But your typical vertical axis also has some downsides.
1/15
Almost always, gridlines are better than axes. At least for vertical axes.
I admit, vertical axes are the default option, and they have been around for centuries, so they are very well known. But your typical vertical axis also has some downsides.
1/15
Serendipity: sometimes the best discoveries happen by chance. 🌱
While browsing a random library in a coworking space in Berlin, I stumbled upon "Obstbau in Wort und Bild": a completely unknown, but beautifully illustrated book on fruit cultivation.
1/3
While browsing a random library in a coworking space in Berlin, I stumbled upon "Obstbau in Wort und Bild": a completely unknown, but beautifully illustrated book on fruit cultivation.
1/3

September 23, 2025 at 7:51 AM
Serendipity: sometimes the best discoveries happen by chance. 🌱
While browsing a random library in a coworking space in Berlin, I stumbled upon "Obstbau in Wort und Bild": a completely unknown, but beautifully illustrated book on fruit cultivation.
1/3
While browsing a random library in a coworking space in Berlin, I stumbled upon "Obstbau in Wort und Bild": a completely unknown, but beautifully illustrated book on fruit cultivation.
1/3
Michael Friendly & Howard Wainer clearly love graphs. But "A History of Data Visualization & Graphic Communication" isn’t just about graphs — it’s about the stories behind them: the context, people, new measurements that made them necessary, and the discoveries they enabled.
1/3
1/3

September 18, 2025 at 7:51 AM
Michael Friendly & Howard Wainer clearly love graphs. But "A History of Data Visualization & Graphic Communication" isn’t just about graphs — it’s about the stories behind them: the context, people, new measurements that made them necessary, and the discoveries they enabled.
1/3
1/3
Some charts are more powerful than others. And Sankey diagrams are among the most powerful of all.
Here's one of the examples I really love: it shows an entire country’s energy balance for a year: every source, every use, imports, exports, losses, even the exact numbers...
1/3
Here's one of the examples I really love: it shows an entire country’s energy balance for a year: every source, every use, imports, exports, losses, even the exact numbers...
1/3

September 16, 2025 at 7:51 AM
Some charts are more powerful than others. And Sankey diagrams are among the most powerful of all.
Here's one of the examples I really love: it shows an entire country’s energy balance for a year: every source, every use, imports, exports, losses, even the exact numbers...
1/3
Here's one of the examples I really love: it shows an entire country’s energy balance for a year: every source, every use, imports, exports, losses, even the exact numbers...
1/3
✈️ Heading back home after an engaging 2 days in Berlin…
This week I was kindly invited by 50Hertz to contribute to their Hackathon, where experts from across Europe gathered to tackle the question: how to bridge the gap between electricity markets and system operations?
1/4
This week I was kindly invited by 50Hertz to contribute to their Hackathon, where experts from across Europe gathered to tackle the question: how to bridge the gap between electricity markets and system operations?
1/4
September 11, 2025 at 7:51 AM
✈️ Heading back home after an engaging 2 days in Berlin…
This week I was kindly invited by 50Hertz to contribute to their Hackathon, where experts from across Europe gathered to tackle the question: how to bridge the gap between electricity markets and system operations?
1/4
This week I was kindly invited by 50Hertz to contribute to their Hackathon, where experts from across Europe gathered to tackle the question: how to bridge the gap between electricity markets and system operations?
1/4
📘 When the book "Storytelling with Data" first came out, it changed the way many of us thought about graphs. It's not about flashy tools or exotic chart types; it's about clear, practical principles that anyone can apply. Even if you don't want to leave Excel!
1/5
1/5

September 9, 2025 at 7:51 AM
📘 When the book "Storytelling with Data" first came out, it changed the way many of us thought about graphs. It's not about flashy tools or exotic chart types; it's about clear, practical principles that anyone can apply. Even if you don't want to leave Excel!
1/5
1/5
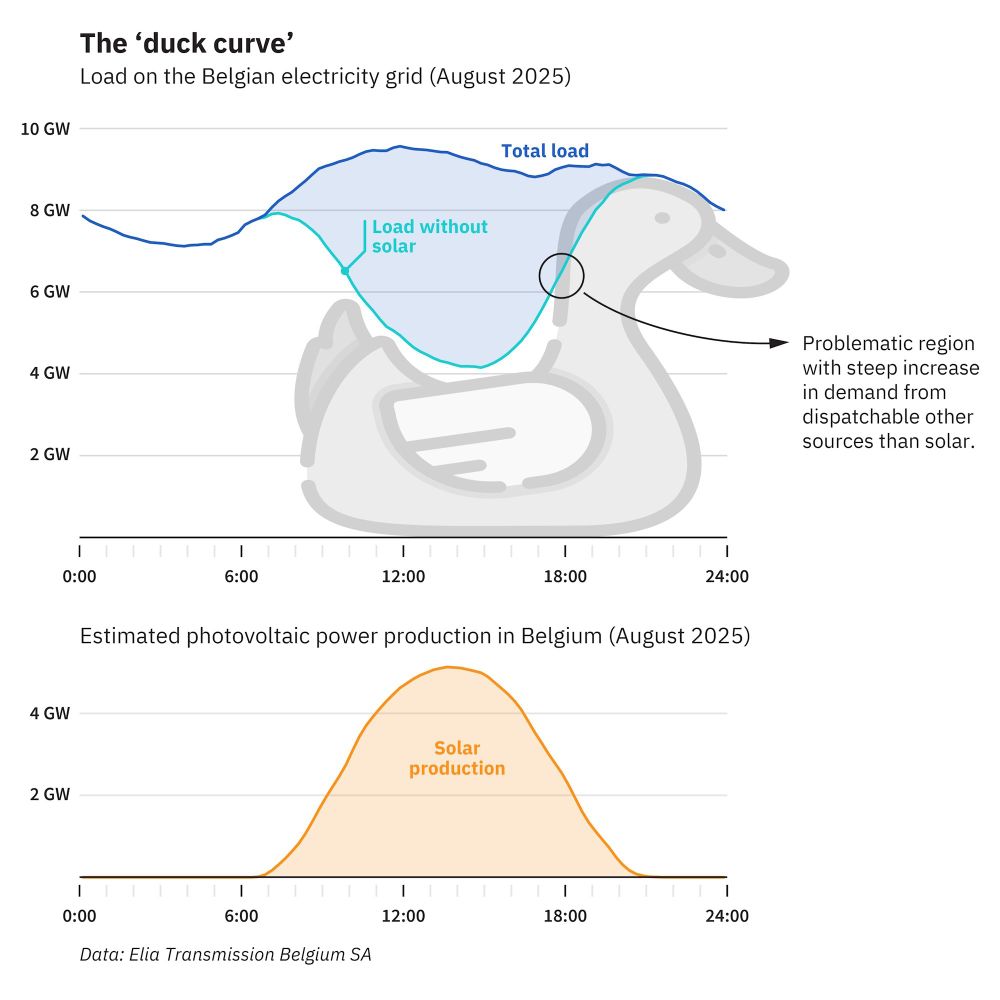
Very few charts are famous enough to have their own Wikipedia page. In climate studies there are the hockey stick graph and warming stripes. The energy sector also has one: the duck curve. It's one of the rare charts that jumped from engineering papers into public debate.
1/5
1/5
September 4, 2025 at 7:51 AM
Very few charts are famous enough to have their own Wikipedia page. In climate studies there are the hockey stick graph and warming stripes. The energy sector also has one: the duck curve. It's one of the rare charts that jumped from engineering papers into public debate.
1/5
1/5
Most reports have boring, or downright confusing charts.
CREG’s Monitoring Report = 150 pages of clear, beautiful visuals.
The secret?
🔹 Clever annotations
🔹 Small multiples
🔹 Smart chart choices
I broke down the lessons here: baryon.be/report-visua...
CREG’s Monitoring Report = 150 pages of clear, beautiful visuals.
The secret?
🔹 Clever annotations
🔹 Small multiples
🔹 Smart chart choices
I broke down the lessons here: baryon.be/report-visua...

September 2, 2025 at 7:51 AM
Most reports have boring, or downright confusing charts.
CREG’s Monitoring Report = 150 pages of clear, beautiful visuals.
The secret?
🔹 Clever annotations
🔹 Small multiples
🔹 Smart chart choices
I broke down the lessons here: baryon.be/report-visua...
CREG’s Monitoring Report = 150 pages of clear, beautiful visuals.
The secret?
🔹 Clever annotations
🔹 Small multiples
🔹 Smart chart choices
I broke down the lessons here: baryon.be/report-visua...
Reposted by Koen Van den Eeckhout

📊 Visual journalism often takes weeks to produce, even though a similar written article may only take a day or two.
Jonas Oesch takes a closer look at a typical visual story to uncover why it takes so long to produce and what can be done to speed up the process.
nightingaledvs.com/why-visual-j...
Jonas Oesch takes a closer look at a typical visual story to uncover why it takes so long to produce and what can be done to speed up the process.
nightingaledvs.com/why-visual-j...

August 27, 2025 at 3:23 PM
📊 Visual journalism often takes weeks to produce, even though a similar written article may only take a day or two.
Jonas Oesch takes a closer look at a typical visual story to uncover why it takes so long to produce and what can be done to speed up the process.
nightingaledvs.com/why-visual-j...
Jonas Oesch takes a closer look at a typical visual story to uncover why it takes so long to produce and what can be done to speed up the process.
nightingaledvs.com/why-visual-j...
Cool job alert!
DNB (De Nederlandsche Bank - the Dutch national bank) is looking for an information designer to translate complex economic and societal topics into impactful visual stories!
www.werkenbijdnb.nl/vacatures/in...
DNB (De Nederlandsche Bank - the Dutch national bank) is looking for an information designer to translate complex economic and societal topics into impactful visual stories!
www.werkenbijdnb.nl/vacatures/in...

Information Designer | Werken bij DNB
Breng complexe data tot leven in visuele verhalen als information designer bij DNB.
www.werkenbijdnb.nl
August 26, 2025 at 7:51 AM
Cool job alert!
DNB (De Nederlandsche Bank - the Dutch national bank) is looking for an information designer to translate complex economic and societal topics into impactful visual stories!
www.werkenbijdnb.nl/vacatures/in...
DNB (De Nederlandsche Bank - the Dutch national bank) is looking for an information designer to translate complex economic and societal topics into impactful visual stories!
www.werkenbijdnb.nl/vacatures/in...
If you're looking for color combinations but are out of inspiration, you can check out the official colors of the International Chronostratigraphic Chart. A beautiful palette spanning over 4 billion years!
All details and color codes can be found at stratigraphy.org/chart
All details and color codes can be found at stratigraphy.org/chart

August 21, 2025 at 8:01 AM
If you're looking for color combinations but are out of inspiration, you can check out the official colors of the International Chronostratigraphic Chart. A beautiful palette spanning over 4 billion years!
All details and color codes can be found at stratigraphy.org/chart
All details and color codes can be found at stratigraphy.org/chart
🎙️ Just updated my list of data visualization podcasts for 2025
Perfect for learning, sparking new ideas, and hearing from voices shaping the field.
Check out the updated lineup here: baryon.be/data-visuali...
Did I miss any #dataviz podcasts? Let me know!
Perfect for learning, sparking new ideas, and hearing from voices shaping the field.
Check out the updated lineup here: baryon.be/data-visuali...
Did I miss any #dataviz podcasts? Let me know!

Data visualization podcasts 2025 – Baryon
Back to overview
baryon.be
August 13, 2025 at 7:00 AM
🎙️ Just updated my list of data visualization podcasts for 2025
Perfect for learning, sparking new ideas, and hearing from voices shaping the field.
Check out the updated lineup here: baryon.be/data-visuali...
Did I miss any #dataviz podcasts? Let me know!
Perfect for learning, sparking new ideas, and hearing from voices shaping the field.
Check out the updated lineup here: baryon.be/data-visuali...
Did I miss any #dataviz podcasts? Let me know!
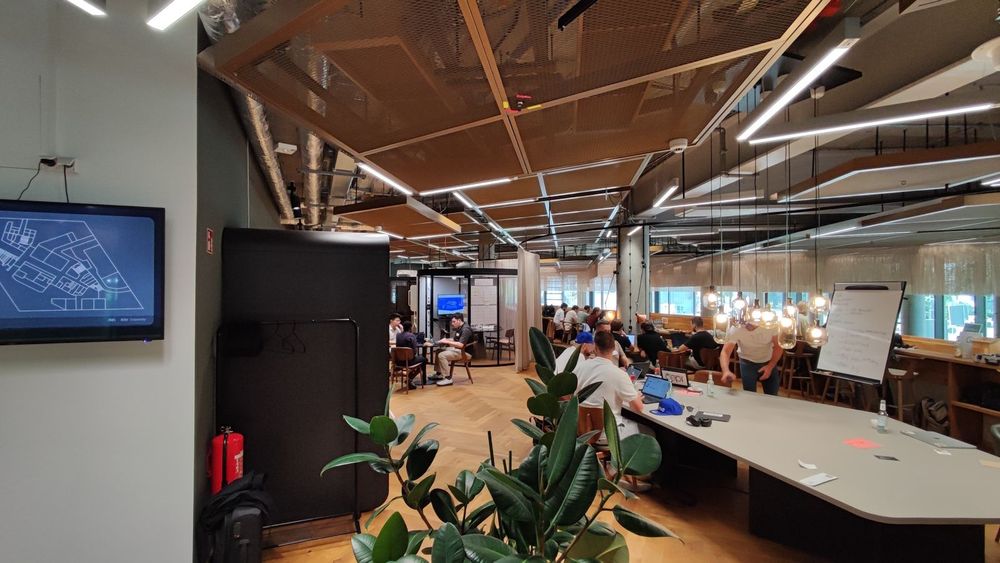
Hey, I'd like to meet you!
In 2 weeks, I'll be in Berlin for a workshop. I have some free time on Wed 13/8 (1-5 pm), and on Thu 14/8 (evening).
Anyone from the #dataviz family who wants to meet up for a ☕ or a 🍺?
Let me know!
Picture: my last visit to Berlin - 5 years ago!
In 2 weeks, I'll be in Berlin for a workshop. I have some free time on Wed 13/8 (1-5 pm), and on Thu 14/8 (evening).
Anyone from the #dataviz family who wants to meet up for a ☕ or a 🍺?
Let me know!
Picture: my last visit to Berlin - 5 years ago!

July 31, 2025 at 2:55 PM
Hey, I'd like to meet you!
In 2 weeks, I'll be in Berlin for a workshop. I have some free time on Wed 13/8 (1-5 pm), and on Thu 14/8 (evening).
Anyone from the #dataviz family who wants to meet up for a ☕ or a 🍺?
Let me know!
Picture: my last visit to Berlin - 5 years ago!
In 2 weeks, I'll be in Berlin for a workshop. I have some free time on Wed 13/8 (1-5 pm), and on Thu 14/8 (evening).
Anyone from the #dataviz family who wants to meet up for a ☕ or a 🍺?
Let me know!
Picture: my last visit to Berlin - 5 years ago!