


Tom Weatherburn
@tdubolyou.bsky.social
Data + Graphics
Planning Research, City of Toronto
mapto.ca; tomweatherburn.com
Planning Research, City of Toronto
mapto.ca; tomweatherburn.com
Pinned
Tom Weatherburn
@tdubolyou.bsky.social
· Dec 10
Exploring overlays on DEM data in Blender. Versions show forest and water, satellite imagery, Greenbelt plan areas, and colour-coded watersheds. Testing different palettes. Long way to go, but sharing progress—feedback welcome.
#map #mapping #gis #blender #Toronto #Ontario #DEM #3D
#map #mapping #gis #blender #Toronto #Ontario #DEM #3D


February 11, 2026 at 8:10 PM
I completed the Applied Data Science with Python specialization from the U of M, which included 5 courses:
Introduction to Data Science
Applied Plotting, Charting & Data Representation
Applied Machine Learning
Applied Text Mining
Applied Social Network Analysis
#datascience #ai #python
Introduction to Data Science
Applied Plotting, Charting & Data Representation
Applied Machine Learning
Applied Text Mining
Applied Social Network Analysis
#datascience #ai #python

February 4, 2026 at 7:00 PM
I completed the Applied Data Science with Python specialization from the U of M, which included 5 courses:
Introduction to Data Science
Applied Plotting, Charting & Data Representation
Applied Machine Learning
Applied Text Mining
Applied Social Network Analysis
#datascience #ai #python
Introduction to Data Science
Applied Plotting, Charting & Data Representation
Applied Machine Learning
Applied Text Mining
Applied Social Network Analysis
#datascience #ai #python
The Planning Research and Analytics team in @planning.cityof.toronto.ca has published a Development Pipeline dashboard. It shows development activity over the past 5 years.
Have a look here: lnkd.in/g8pBE-Ej
#Toronto #DevelopmentPipeline #RE #BI #Tableau #dashboards
Have a look here: lnkd.in/g8pBE-Ej
#Toronto #DevelopmentPipeline #RE #BI #Tableau #dashboards


February 4, 2026 at 6:53 PM
The Planning Research and Analytics team in @planning.cityof.toronto.ca has published a Development Pipeline dashboard. It shows development activity over the past 5 years.
Have a look here: lnkd.in/g8pBE-Ej
#Toronto #DevelopmentPipeline #RE #BI #Tableau #dashboards
Have a look here: lnkd.in/g8pBE-Ej
#Toronto #DevelopmentPipeline #RE #BI #Tableau #dashboards
Reposted by Tom Weatherburn

Add Palmerston to the list of places that need a good Le Corbusiering. Next to the Annex, Cabbagetown and mid-etobicoke. The more righteous and self-proclaimed-special, the more hot towers go in.

February 2, 2026 at 7:50 PM
Add Palmerston to the list of places that need a good Le Corbusiering. Next to the Annex, Cabbagetown and mid-etobicoke. The more righteous and self-proclaimed-special, the more hot towers go in.
Reposted by Tom Weatherburn

brass solidarity band performing “stand by me” in the streets of whittier next to alex pretti’s memorial. the crowd started chanting “the people united will never be defeated” so they incorporated it into the song. i love minneapolis
January 27, 2026 at 12:22 AM
brass solidarity band performing “stand by me” in the streets of whittier next to alex pretti’s memorial. the crowd started chanting “the people united will never be defeated” so they incorporated it into the song. i love minneapolis
Reposted by Tom Weatherburn

This moment in history provides us with incontrovertible evidence that all the conservatives who claim to be extremely devoted to freedom of speech and the right to bear arms, and opposed to the encroachment of tyranny, are completely and totally full of shit.
It's all white supremacy and greed.
It's all white supremacy and greed.

January 25, 2026 at 2:03 AM
This moment in history provides us with incontrovertible evidence that all the conservatives who claim to be extremely devoted to freedom of speech and the right to bear arms, and opposed to the encroachment of tyranny, are completely and totally full of shit.
It's all white supremacy and greed.
It's all white supremacy and greed.
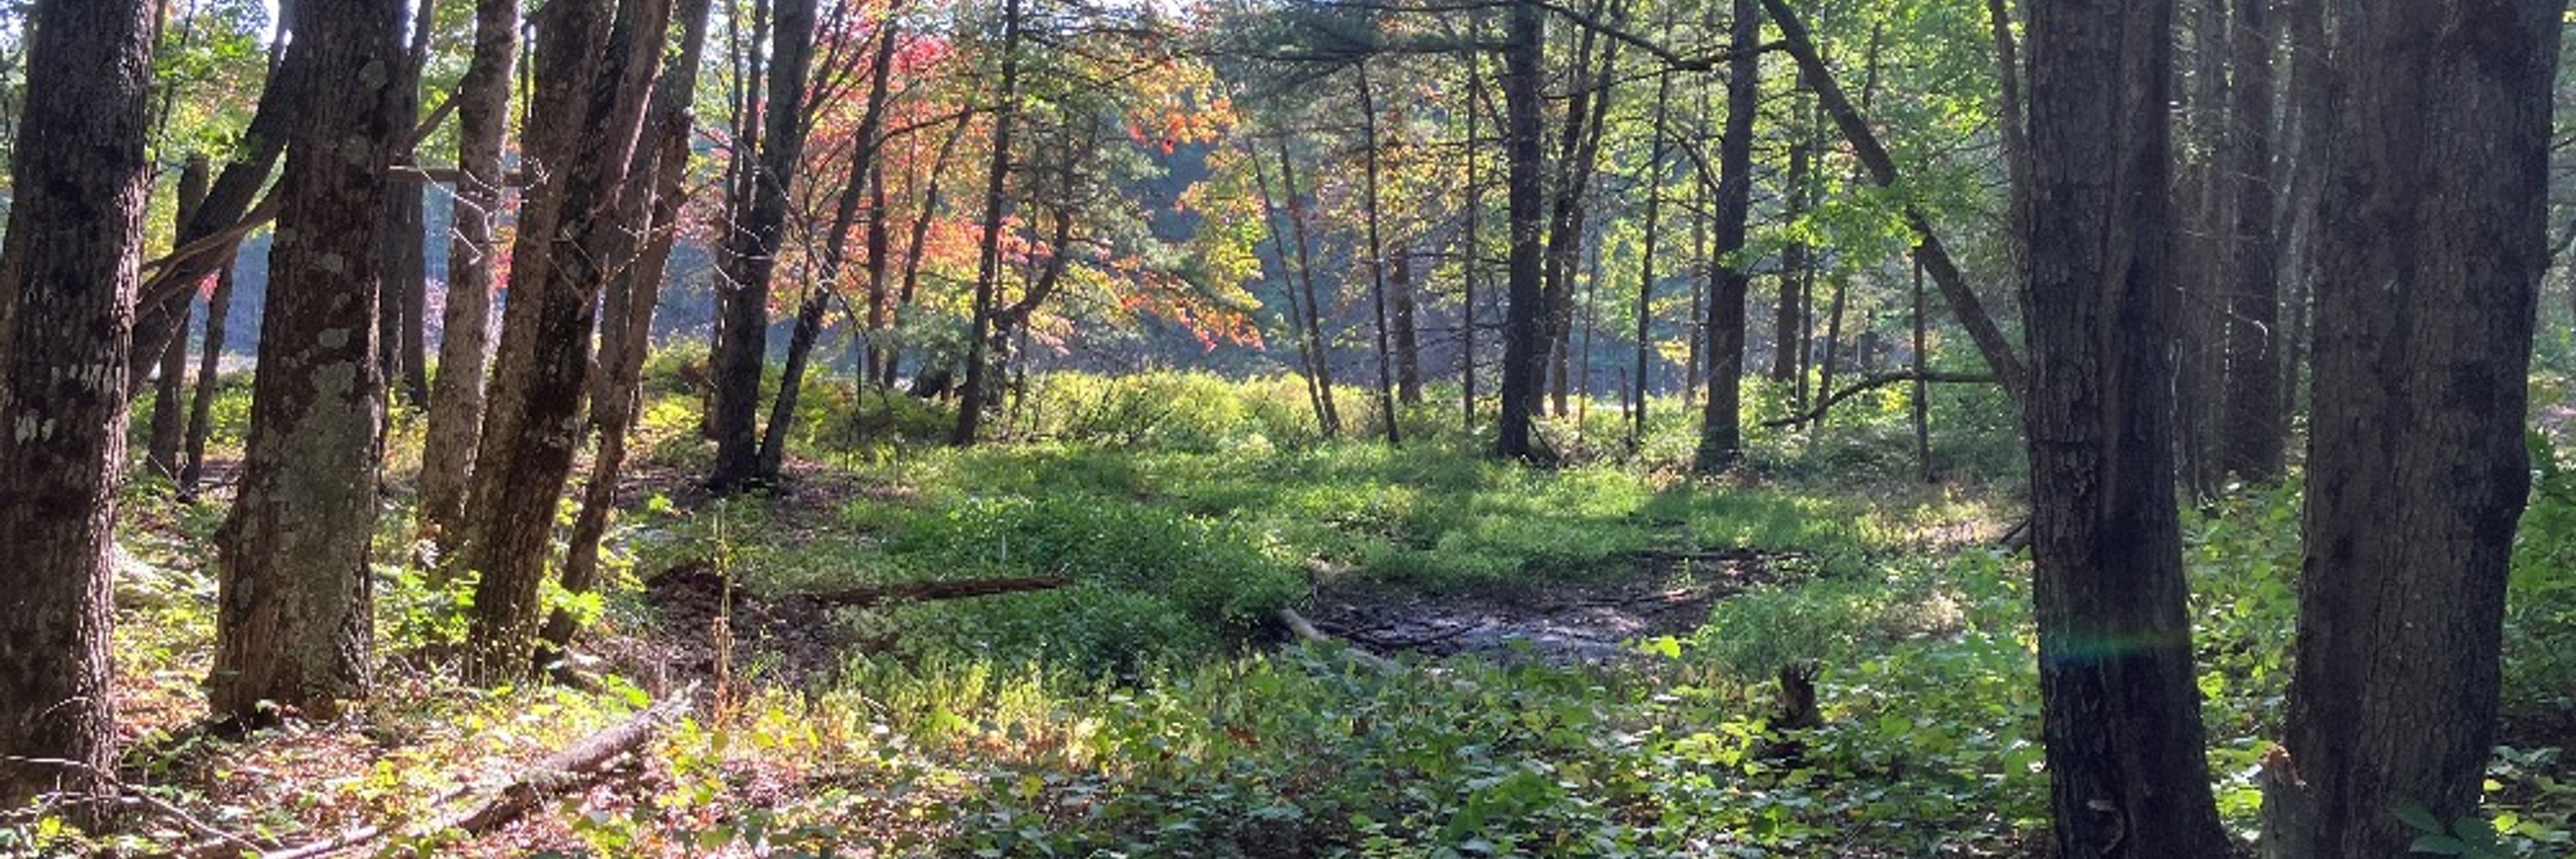
Playing with elevation data in #Blender. This is the #Toronto and Region Conservation Authority (TRCA) boundary which includes all of the watersheds that converge in Toronto. Going to try draping some orthophotos and land cover data over this. Other ideas?
#Maps #Mapping #GIS #3D #dataviz
#Maps #Mapping #GIS #3D #dataviz

January 20, 2026 at 8:28 PM
Reposted by Tom Weatherburn

The Eglinton cover section, meanwhile, features Cheryl Thompson and @johnlorinc.bsky.social on the Golden Mile, a map of Eglinton density by @tdubolyou.bsky.social (slice below), and pieces by @theurbangeog.bsky.social, Todd Harrison, and more ranging from east to west.

January 20, 2026 at 4:57 PM
The Eglinton cover section, meanwhile, features Cheryl Thompson and @johnlorinc.bsky.social on the Golden Mile, a map of Eglinton density by @tdubolyou.bsky.social (slice below), and pieces by @theurbangeog.bsky.social, Todd Harrison, and more ranging from east to west.
Reposted by Tom Weatherburn
New issue! Issue 73 explores Eglinton Avenue, Toronto's "prime rib" from east to west, as it awaits its new transit line spacing.ca/toronto/2026...

NEW ISSUE: Crossing Town - Spacing Toronto
We still don’t know when the Eglinton Crosstown LRT will open. It could be any day – the testing is all done. Or it could be many weeks away, given its history – there are still processes to go throug...
spacing.ca
January 20, 2026 at 4:33 PM
New issue! Issue 73 explores Eglinton Avenue, Toronto's "prime rib" from east to west, as it awaits its new transit line spacing.ca/toronto/2026...
If you spend any amount of time using microsoft copilot you will understand why hes worried.

AI boom could falter without wider adoption, Microsoft chief Satya Nadella warns

AI boom could falter without wider adoption, Microsoft chief Satya Nadella warns
Big tech boss tells delegates at Davos that broader global use is essential if technology is to deliver lasting growth
www.irishtimes.com
January 20, 2026 at 2:36 PM
If you spend any amount of time using microsoft copilot you will understand why hes worried.
Reposted by Tom Weatherburn

Love good charts & maps? 👀
#DataViz Weekly is back with new data viz picks worth a look:
> Time with others @flowingdata.com
> NYC parking lots housing potential @tdubolyou.bsky.social
> China's rise in trade @ourworldindata.org
> AI questions beyond tech earnings @bloomberg.com
See it on our blog.
#DataViz Weekly is back with new data viz picks worth a look:
> Time with others @flowingdata.com
> NYC parking lots housing potential @tdubolyou.bsky.social
> China's rise in trade @ourworldindata.org
> AI questions beyond tech earnings @bloomberg.com
See it on our blog.

December 22, 2025 at 12:32 PM
Love good charts & maps? 👀
#DataViz Weekly is back with new data viz picks worth a look:
> Time with others @flowingdata.com
> NYC parking lots housing potential @tdubolyou.bsky.social
> China's rise in trade @ourworldindata.org
> AI questions beyond tech earnings @bloomberg.com
See it on our blog.
#DataViz Weekly is back with new data viz picks worth a look:
> Time with others @flowingdata.com
> NYC parking lots housing potential @tdubolyou.bsky.social
> China's rise in trade @ourworldindata.org
> AI questions beyond tech earnings @bloomberg.com
See it on our blog.
I voted for Tobi over Thiel but I dont think he’ll win

🚨 ROUND TWO STARTS NOW 🚨
We’re down to the final 16 contestants as you decide who will be this year’s Worst Person In Tech!
Each day of this week new matchups will drop until we choose the winner on Friday.
🗳️ Cast your ballot: twsu.forms.app/wpit25-round...
We’re down to the final 16 contestants as you decide who will be this year’s Worst Person In Tech!
Each day of this week new matchups will drop until we choose the winner on Friday.
🗳️ Cast your ballot: twsu.forms.app/wpit25-round...

December 16, 2025 at 10:55 PM
I voted for Tobi over Thiel but I dont think he’ll win
Reposted by Tom Weatherburn

Black Americans navigated Jim Crow through guides like the Green Books by sharing their experiences. Know a Green Book establishment? Share your memories, and upload photos or documents. Your contribution makes the archive complete. greenbookproject.osu.edu #GreenBookProject #CommunityMap
#EconSky
#EconSky
December 12, 2025 at 2:02 PM
Black Americans navigated Jim Crow through guides like the Green Books by sharing their experiences. Know a Green Book establishment? Share your memories, and upload photos or documents. Your contribution makes the archive complete. greenbookproject.osu.edu #GreenBookProject #CommunityMap
#EconSky
#EconSky
Reposted by Tom Weatherburn

The tragedy of this province is that we have all the things conceivably needed to be one of the greatest places to live on earth, but our governing class is relentlessly obsessed with mediocrity.
December 11, 2025 at 6:28 PM
The tragedy of this province is that we have all the things conceivably needed to be one of the greatest places to live on earth, but our governing class is relentlessly obsessed with mediocrity.
Reposted by Tom Weatherburn

It's fitting that the cover on AI mindlessly apes an earlier creation and also displaces workers while elevating Silicon Valley plutocrats.


December 12, 2025 at 3:40 AM
It's fitting that the cover on AI mindlessly apes an earlier creation and also displaces workers while elevating Silicon Valley plutocrats.
Reposted by Tom Weatherburn

I want to stress again that California is not in a situation where it's gaining tech jobs at a slower rate than the rest of the country (like 2021/2022), but is outright losing tech jobs as the rest of the US gains
Cali is down 75k tech jobs from peak & nearly 20k from pre-COVID
Cali is down 75k tech jobs from peak & nearly 20k from pre-COVID

December 11, 2025 at 4:28 PM
I want to stress again that California is not in a situation where it's gaining tech jobs at a slower rate than the rest of the country (like 2021/2022), but is outright losing tech jobs as the rest of the US gains
Cali is down 75k tech jobs from peak & nearly 20k from pre-COVID
Cali is down 75k tech jobs from peak & nearly 20k from pre-COVID
Reposted by Tom Weatherburn

Big new blogpost!
My guide to data visualization, which includes a very long table of contents, tons of charts, and more.
--> Why data visualization matters and how to make charts more effective, clear, transparent, and sometimes, beautiful.
www.scientificdiscovery.dev/p/salonis-gu...
My guide to data visualization, which includes a very long table of contents, tons of charts, and more.
--> Why data visualization matters and how to make charts more effective, clear, transparent, and sometimes, beautiful.
www.scientificdiscovery.dev/p/salonis-gu...

December 9, 2025 at 8:28 PM
Big new blogpost!
My guide to data visualization, which includes a very long table of contents, tons of charts, and more.
--> Why data visualization matters and how to make charts more effective, clear, transparent, and sometimes, beautiful.
www.scientificdiscovery.dev/p/salonis-gu...
My guide to data visualization, which includes a very long table of contents, tons of charts, and more.
--> Why data visualization matters and how to make charts more effective, clear, transparent, and sometimes, beautiful.
www.scientificdiscovery.dev/p/salonis-gu...

Reposted by Tom Weatherburn

Imagining that the climate battle is about *information* -- that those who have good information will act; that those who aren't acting must be lacking information -- has been utterly disastrous for decades now, but advocates & pols can't seem to break out of it.

Many Fighting Climate Change Worry They Are Losing the Information War
www.nytimes.com
November 30, 2025 at 8:19 PM
Imagining that the climate battle is about *information* -- that those who have good information will act; that those who aren't acting must be lacking information -- has been utterly disastrous for decades now, but advocates & pols can't seem to break out of it.
Reposted by Tom Weatherburn
Meta halted internal research that purportedly showed (young) people who stopped using Facebook became less depressed and anxious, according to an unredacted legal filing released on Friday. www.cnbc.com/2025/11/23/m...

Meta halted internal research suggesting social media harm, court filing alleges
Meta is alleged to have halted internal research suggesting social media harm, according to court documents.
www.cnbc.com
November 24, 2025 at 12:31 AM
Meta halted internal research that purportedly showed (young) people who stopped using Facebook became less depressed and anxious, according to an unredacted legal filing released on Friday. www.cnbc.com/2025/11/23/m...
I’m not sure he understands it’s quite helpful for the LPC when American Fascists mimic the rhetoric of our Conservative Party.


November 21, 2025 at 8:08 PM
I’m not sure he understands it’s quite helpful for the LPC when American Fascists mimic the rhetoric of our Conservative Party.
Increasingly find myself listening to @drfeifei.bsky.social as a source of credible (understatement!) and insightful info about AI. This episode of @lennysan.bsky.social’s podcast is a great example.
open.spotify.com/episode/35Aa...
open.spotify.com/episode/35Aa...

The Godmother of AI on jobs, robots & why world models are next | Dr. Fei-Fei Li
Spotify video
open.spotify.com
November 20, 2025 at 5:18 PM
Increasingly find myself listening to @drfeifei.bsky.social as a source of credible (understatement!) and insightful info about AI. This episode of @lennysan.bsky.social’s podcast is a great example.
open.spotify.com/episode/35Aa...
open.spotify.com/episode/35Aa...
Reposted by Tom Weatherburn

It's not a foolproof plan but every political debate from now on should be a Normal Guy competition. Ask them to describe grocery shopping in detail. Talk about what it's like to have a friend
November 19, 2025 at 2:13 AM
It's not a foolproof plan but every political debate from now on should be a Normal Guy competition. Ask them to describe grocery shopping in detail. Talk about what it's like to have a friend