Smitha
@smithaaa.bsky.social
Data analyst, Story teller, musician!
My resume just got a soundtrack! 🎶📊 Who needs bullet points when data can sing its own story?😂
Do give it a listen!
#SunoAI #AI #Resume #DataAnalyst #Data
suno.com/song/76739be...
Do give it a listen!
#SunoAI #AI #Resume #DataAnalyst #Data
suno.com/song/76739be...

🎵 Listen to Data Love Symphony on Suno
Indian classical music, happy, uplifting, female, tabla, melodious
song. Listen and make your own with Suno.
suno.com
March 28, 2025 at 9:31 AM
My resume just got a soundtrack! 🎶📊 Who needs bullet points when data can sing its own story?😂
Do give it a listen!
#SunoAI #AI #Resume #DataAnalyst #Data
suno.com/song/76739be...
Do give it a listen!
#SunoAI #AI #Resume #DataAnalyst #Data
suno.com/song/76739be...
Reposted by Smitha

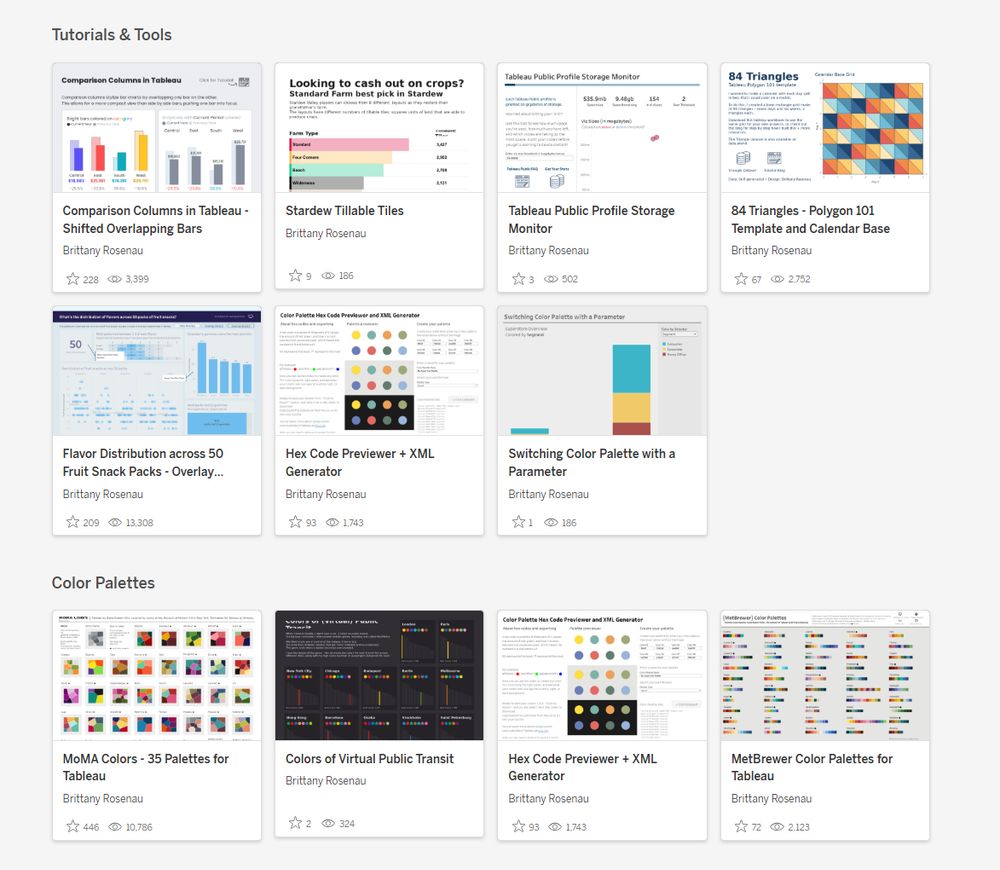
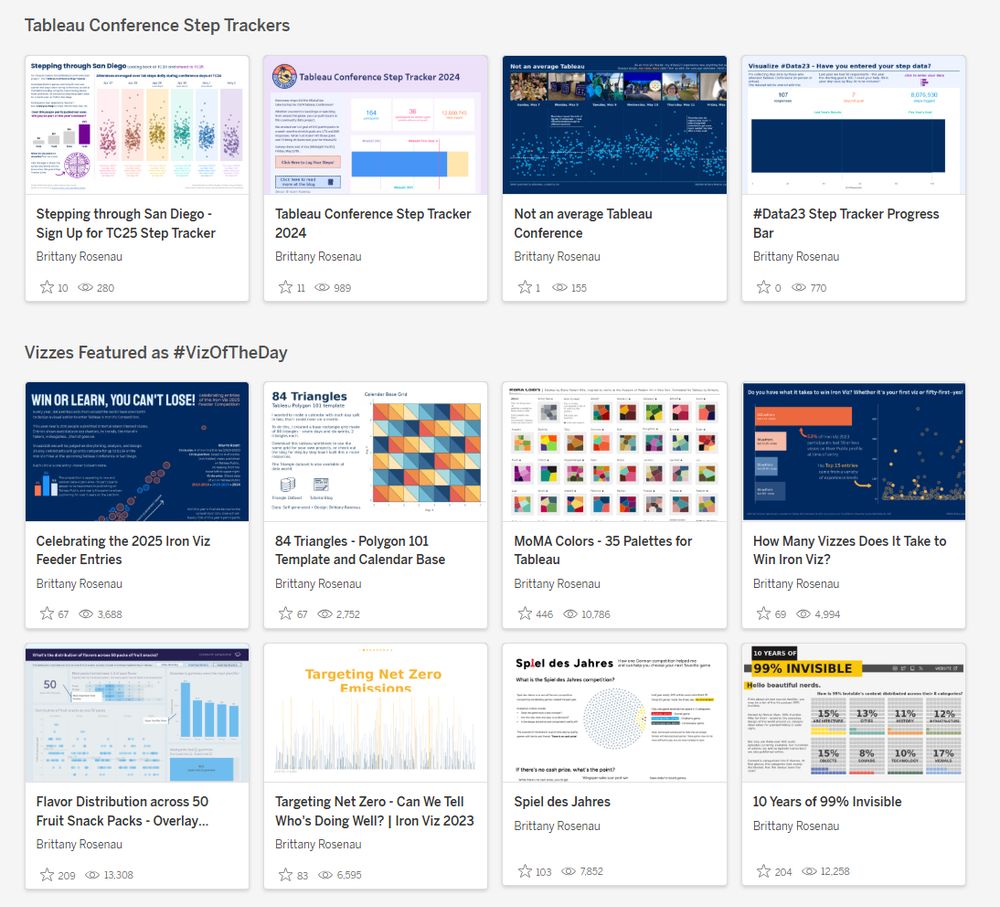
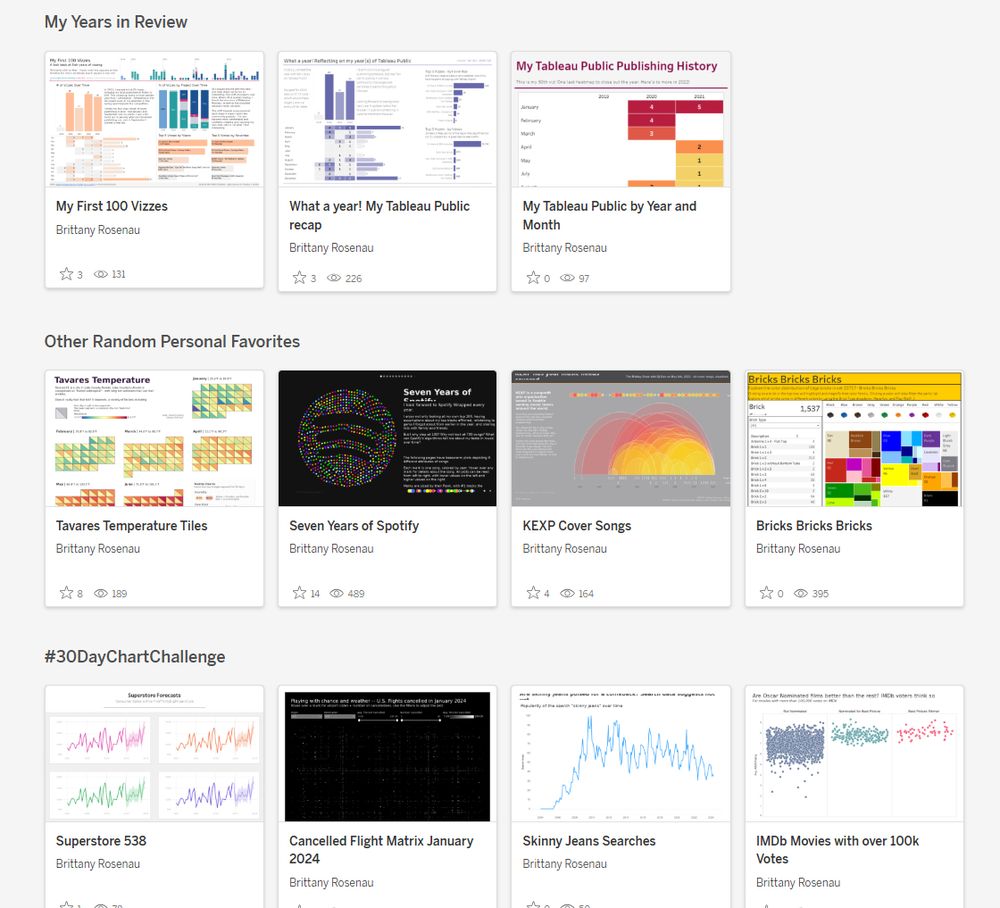
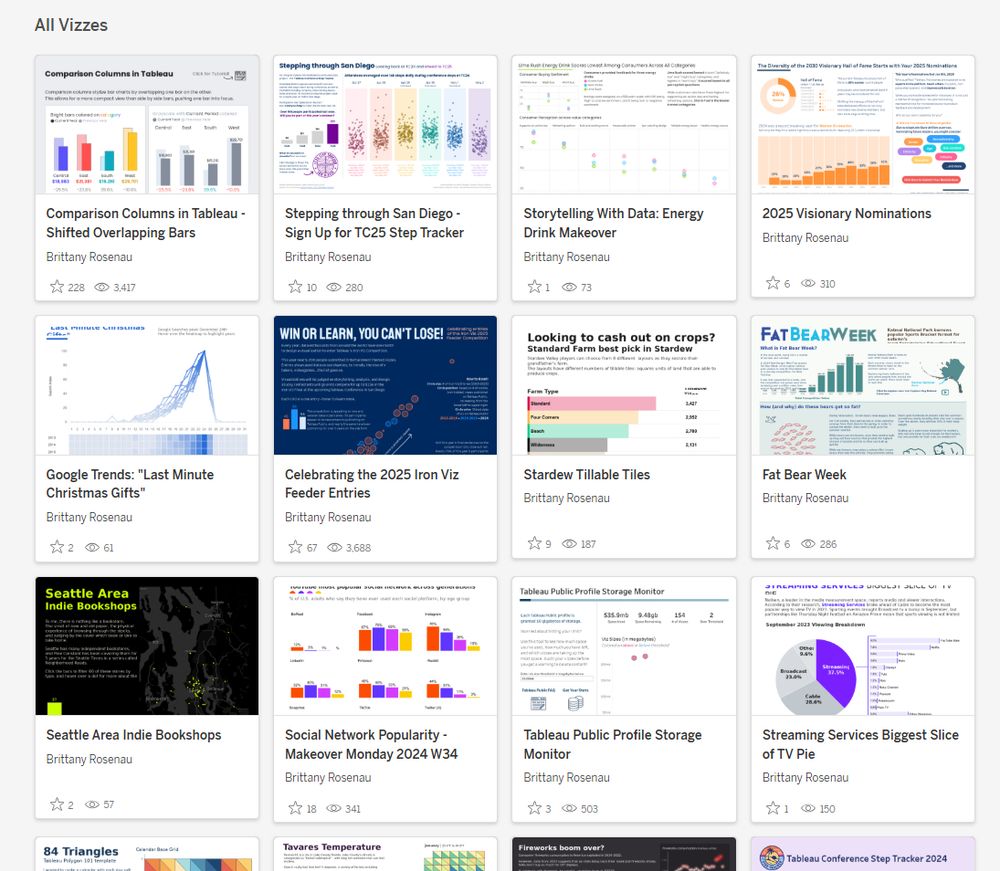
it's the little things - excited to FINALLY have manual control over categories on my Tableau Public profile!
March 4, 2025 at 3:43 AM
it's the little things - excited to FINALLY have manual control over categories on my Tableau Public profile!
March 17, 2025 at 12:03 PM
March 17, 2025 at 12:02 PM
Reposted by Smitha

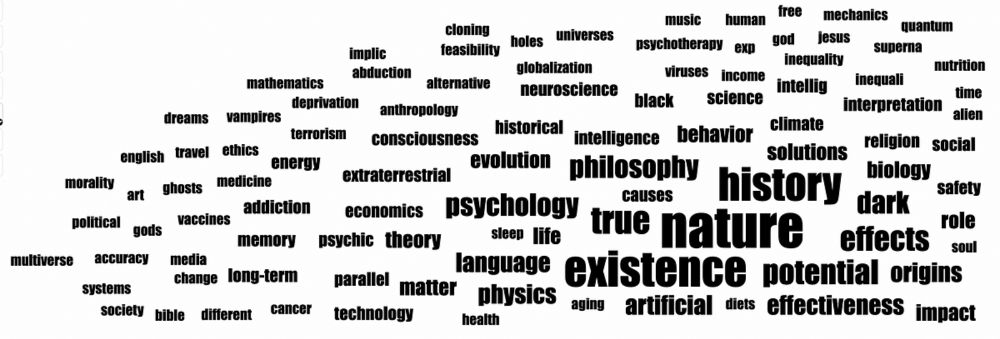
Apropos of our conversation about GenAI and data visualization, here's that time I asked it a bunch of questions and it hallucinated a bunch of results and I charted them. #dataviz
medium.com/p/10845753c1fa
medium.com/p/10845753c1fa
You Might Be Uncertain About ChatGPT but Have You Ever Wondered What ChatGPT is Uncertain About?
Like all of you, I’ve been intrigued by OpenAI’s ChatGPT. I’ve asked it questions about lime trees and ethics and DBT and come away…
medium.com
November 18, 2024 at 3:14 PM
Apropos of our conversation about GenAI and data visualization, here's that time I asked it a bunch of questions and it hallucinated a bunch of results and I charted them. #dataviz
medium.com/p/10845753c1fa
medium.com/p/10845753c1fa
Reposted by Smitha
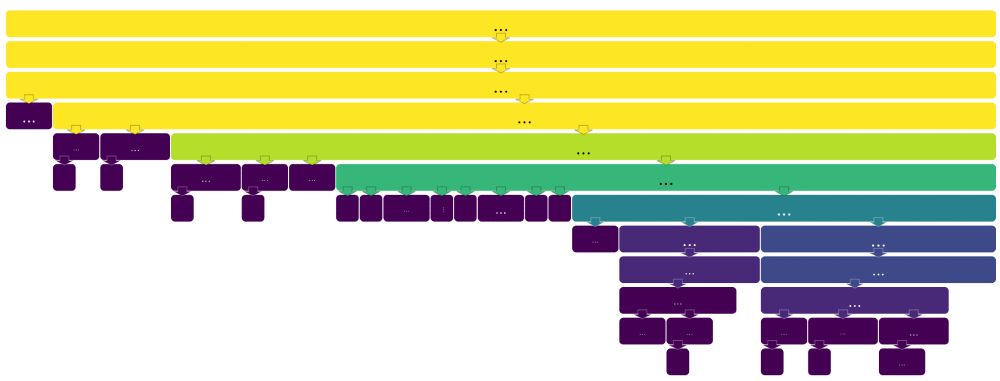
I like how this turned out for visualizing branching funnels. Very much like a flame graph (which is in a way a branching funnel) but I think the arrows, gaps & rounded edges help to differentiate it. I know the old approach was to project it radially as a sunburst but that confuses people. #dataviz
November 14, 2024 at 3:53 AM
I like how this turned out for visualizing branching funnels. Very much like a flame graph (which is in a way a branching funnel) but I think the arrows, gaps & rounded edges help to differentiate it. I know the old approach was to project it radially as a sunburst but that confuses people. #dataviz
Reposted by Smitha

📊 "Dashboards are not just tools for data discovery; they are also for facilitating communication among people."
In Clare Harvey's latest review, she dives into Data Visualization with Microsoft Power BI by Alex Kolokolov and Maxim Zelensky.
nightingaledvs.com/review-data-...
In Clare Harvey's latest review, she dives into Data Visualization with Microsoft Power BI by Alex Kolokolov and Maxim Zelensky.
nightingaledvs.com/review-data-...
Review: Data Visualization with Microsoft Power BI: How to Design Savvy Dashboards - Nightingale
Design dashboards with 'Data Visualization with Microsoft Power BI,' a practical guide for business analysts by Kolokolov and Zelensky.
nightingaledvs.com
November 12, 2024 at 3:58 PM
📊 "Dashboards are not just tools for data discovery; they are also for facilitating communication among people."
In Clare Harvey's latest review, she dives into Data Visualization with Microsoft Power BI by Alex Kolokolov and Maxim Zelensky.
nightingaledvs.com/review-data-...
In Clare Harvey's latest review, she dives into Data Visualization with Microsoft Power BI by Alex Kolokolov and Maxim Zelensky.
nightingaledvs.com/review-data-...
Reposted by Smitha

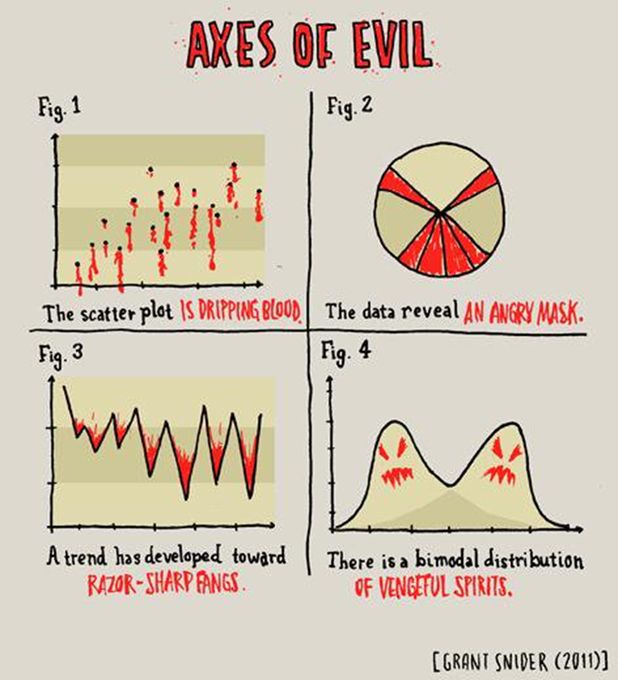
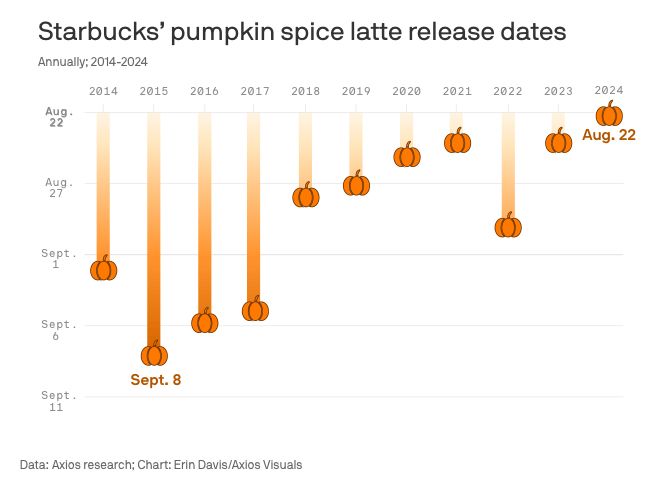
For no reason whatsoever, please enjoy this PSL chart by @erindataviz.bsky.social. 📊
August 21, 2024 at 4:46 PM
For no reason whatsoever, please enjoy this PSL chart by @erindataviz.bsky.social. 📊