Tyler Simko
banner
simko.bsky.social
Tyler Simko
@simko.bsky.social

State & local politics + computational social science.

tylersimko.com

Political science 29%
Economics 19%
The big Democratic wins of the 2025 elections will shift political dynamics and strategies in the coming year. For key takeaways, read our Q&A with UM political scientist Tyler Simko @simko.bsky.social, elections analyst for CBS.

cpsblog.isr.umich.edu?p=3516
Unexpected Margins: Analysis of the 2025 Elections
Expert Q&A with takeaways and predictions drawn from the 2025 elections with CBS elections analyst and University of Michigan political scientist Tyler Simko
cpsblog.isr.umich.edu

Dense, high Hispanic counties like Hudson also point against the ‘24 red shift constituting a lasting “new” NJ. Cities like Perth Amboy saw large ‘24 Trump shifts, but supported Sherrill on Tuesday with overwhelming margins.

Read more from me and @kabirkhanna.bsky.social for #CBSDataDesk🍎 below!
NJ's bluest counties saw biggest turnout increases, propelling landslide

Three densest counties saw largest jumps from '21:
Hudson (Jersey City), Essex (Newark), Union
>30% increase in total vote
>30-pt Democratic margin

High-profile local races helped, e.g., Jersey City mayoral w/ former gov

1/2

Reposted by Tyler Simko

NYC map shaded by vote margin!

We collected very granular precinct data and aggregated it to neighborhoods people actually recognize

Bushwick, Flushing, Upper West Side, etc.

datawrapper.dwcdn.net/Wrd72/

H/T @mitelectionlab.bsky.social @chriskenny.bsky.social @corymccartan.com @simko.bsky.social
2025 NYC Mayoral Race by Neighborhood
CBS News estimates of how different parts of the city voted
datawrapper.dwcdn.net

Reposted by Tyler Simko

Mamdani's win by NYC neighborhood: datawrapper.dwcdn.net/Wrd72/4/

Hover over map to see our estimates...

#CBSDataDesk🍎
2025 NYC Mayoral Race by Neighborhood
datawrapper.dwcdn.net

Reposted by Tyler Simko

Here at the CBS News data desk with @chriskenny.bsky.social and @simko.bsky.social! Looking at the VA numbers
New from Fordham, the Wallace Foundation, @dmhouston.bsky.social & Michael Hartney:

Who’s on Board? School Boards and Political Representation in an Age of Conflict fordhaminstitute.org/national/res...
Who’s on Board? School Boards and Political Representation in an Age of Conflict
School boards have become ground zero for America’s education culture wars, with fiery debates over race, gender, curriculum, and pandemic policies making national headlines. But beyond the noise, how...
fordhaminstitute.org

Thanks so much @stano.bsky.social !! Yes, will definitely post a public draft here when we have it ready.

Reposted by Tyler Simko

👀 Local governments often take "symbolic" stances on issues where they hold no authority or jurisdiction. @simko.bsky.social and Taran Samarth examine the dynamics and purpose of "symbolic representation" by studying the response of US local governments to the ongoing Israel-Hamas war. #APSA2025

Echoing @mirya.bsky.social, thanks David!! We’re super grateful for your interest.

Trump’s proposed rush job Census isn’t just immoral and regressive—it will harm communities across the country and compromise data quality: @chriskenny.bsky.social and I in @thehill.com today:

thehill.com/opinion/camp...
Trump’s proposed snap Census won’t get him the seats he wants
A new Census would likely diminish political representation for Republican areas.
thehill.com

Reposted by Tyler Simko

Do you use tract boundaries in your research? Jake Brown, @simko.bsky.social, and I have a new working paper (osf.io/preprints/so...): Any Way You Slice It: Racial Segregation Statistics are Robust to Aggregation Bias

We show that tract-level segregation is robust to MAUP using simulation methods.
OSF
osf.io

Reposted by Tyler Simko

"shifts in political geography and gerrymandering reduced the number of highly competitive districts by over 25% [from 2010 to 2020], with geographic polarization driving most of the decline."
Timely WP from our ALARM project team: we generated over 200k simulated maps for the 2010 cycle, to compare against our existing 2020 simulations. This lets us disentangle changes in gerrymandering from changes in political geography!

alarm-redist.org/papers/ggpre...

Great article, and a good example of the continuing value of public, open source research tools (we published these simulations in 2022). When new claims and arguments arise, anyone can use existing resources to examine them.
NYT used our ALARM project redistricting simulations to talk about geographic bias against the parties and what counts as "fair" in redistricting!

www.nytimes.com/interactive/...
Is Massachusetts a Gerrymandered State?
Can you recognize a gerrymander?
www.nytimes.com

Reposted by Tyler Simko

NYT used our ALARM project redistricting simulations to talk about geographic bias against the parties and what counts as "fair" in redistricting!

www.nytimes.com/interactive/...
Is Massachusetts a Gerrymandered State?
Can you recognize a gerrymander?
www.nytimes.com

Thanks so much, and yes! Will shoot you an email now.

Thanks so much @sjacks26.bsky.social!! We’re really excited by this, really hoping the data can be useful for other things exactly like this.
You may have noticed things are happening fast in the world of redistricting…

I along with @maxwellpalmer.com and @simko.bsky.social wrote an article last week (though published today) that analyzes the changes to the congressional district map in Texas, and particularly San Antonio.
Republicans are seeking to create a durable gerrymander in Texas
Short-term tactical gains in Texas could ultimately yield a race to the bottom.
www.expressnews.com

Thanks for reading David!! What a nice surprise to hear from you. Hope all is well and we can catch up soon.

Reposted by Tyler Simko

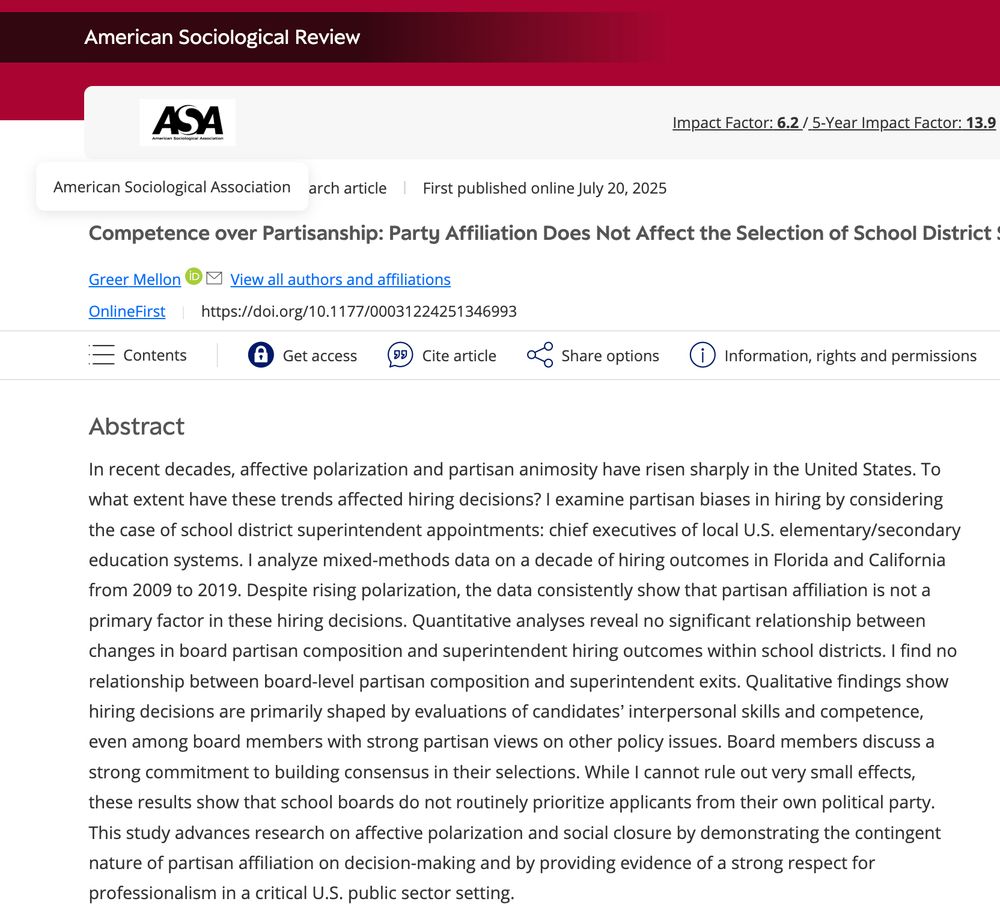
In our polarized political environment, I’m excited to share my new ASR publication: “Competence over Partisanship: Party Affiliation Does Not Affect the Selection of School District Superintendents”. journals.sagepub.com/doi/10.1177/...

Reposted by Tyler Simko

Texas was already arguably the biggest Republican gerrymander in the nation, according to this PNAS paper by @chriskenny.bsky.social @corymccartan.com @simko.bsky.social @shirokuriwaki.bsky.social www.pnas.org/doi/abs/10.1...

Reposted by Tyler Simko

Reposted by Tyler Simko

Reposted by Tyler Simko
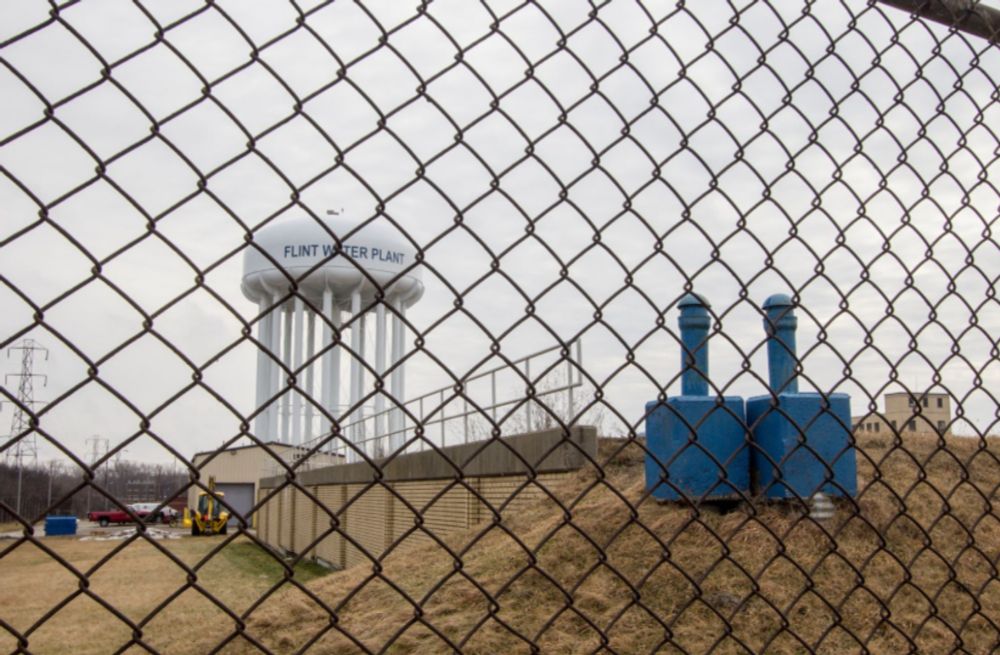
Is government suspicion based on real lived experiences and historic harm? #ISRNextGeneration scholar Franshelly Martinez-Ortiz writes on the case of Michigan, where events like the Flint Water Crisis give rise to lasting mistrust. @maraceci.bsky.social #MPSA2025 ➡️
cpsblog.isr.umich.edu?p=3434
In Michigan, conspiracy thinking can be rooted in real historic harm
Conspiracy thinking may result from paranoia or misinformation -- but it's often rooted actual harms and well-earned mistrust in government.
cpsblog.isr.umich.edu

Reposted by Tyler Simko

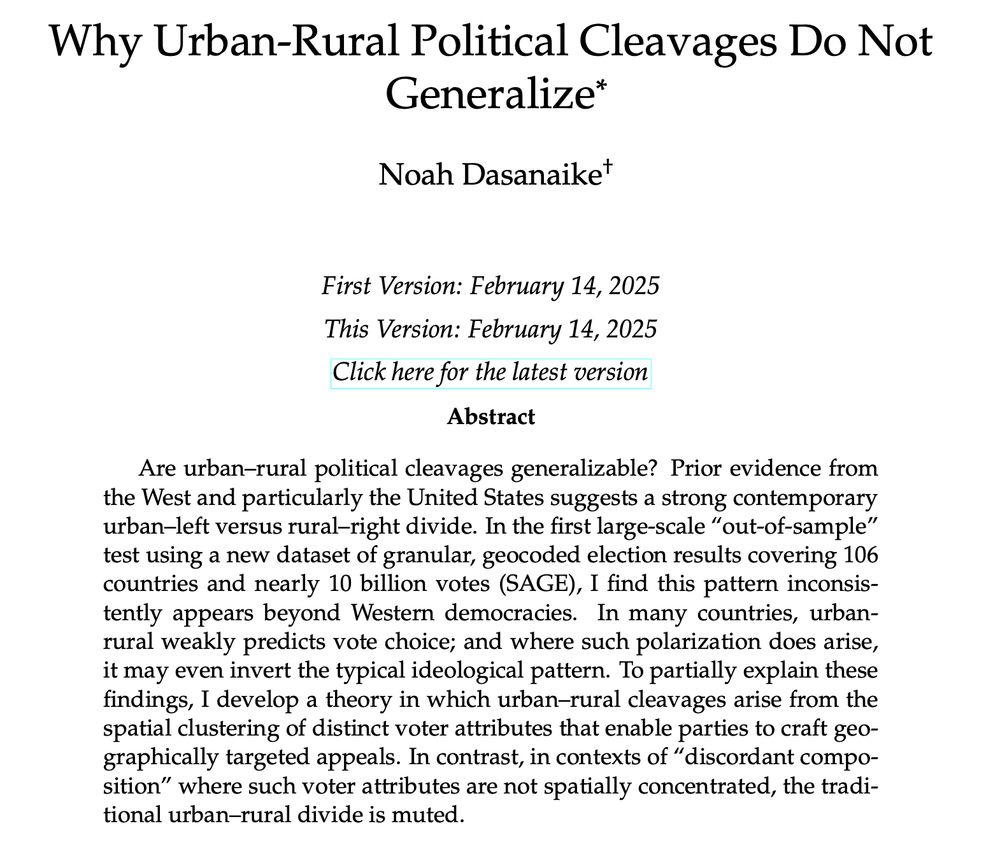
Urban–rural cleavages are seen as a defining political divide. But does this polarization hold worldwide? My new working paper tests this question using an original dataset of granular, geocoded election returns from 106 countries (polling station-level in 70). (1/8)

This sounds amazing. The summary is like one of these Facebook targeted t-shirt ads, but aimed at my research interests.