


Seabed 2030
@seabed2030.bsky.social
A global initiative by the Nippon Foundation-GEBCO in relentless pursuit of achieving a complete map of the ocean floor by 2030 Endorsed by the UN Ocean Decade
Looking ahead to 2026, it’s clear that #AI will be a central thread of discussion in ocean science.
So here's a primer on how it is already beginning to transform how we acquire, interpret, and apply bathymetric data > making surveys faster and more cost-effective, and accelerating impact.
So here's a primer on how it is already beginning to transform how we acquire, interpret, and apply bathymetric data > making surveys faster and more cost-effective, and accelerating impact.


January 28, 2026 at 3:47 PM
Looking ahead to 2026, it’s clear that #AI will be a central thread of discussion in ocean science.
So here's a primer on how it is already beginning to transform how we acquire, interpret, and apply bathymetric data > making surveys faster and more cost-effective, and accelerating impact.
So here's a primer on how it is already beginning to transform how we acquire, interpret, and apply bathymetric data > making surveys faster and more cost-effective, and accelerating impact.
🗂️ Working towards a complete map of the seabed doesn’t mean starting from scratch.
In fact, a large volume of #bathymetric data already exists - but much of it remains inaccessible or not yet widely discoverable.
Why? A few common factors play a role:
In fact, a large volume of #bathymetric data already exists - but much of it remains inaccessible or not yet widely discoverable.
Why? A few common factors play a role:

January 23, 2026 at 1:43 PM
🗂️ Working towards a complete map of the seabed doesn’t mean starting from scratch.
In fact, a large volume of #bathymetric data already exists - but much of it remains inaccessible or not yet widely discoverable.
Why? A few common factors play a role:
In fact, a large volume of #bathymetric data already exists - but much of it remains inaccessible or not yet widely discoverable.
Why? A few common factors play a role:
🌊 Did you know that #seafloor maps play a critical role in tsunami prediction?
Bathymetry plays a foundational role in tsunami simulations, influencing wave propagation and arrival times that inform evacuation planning and early warning efforts.
Bathymetry plays a foundational role in tsunami simulations, influencing wave propagation and arrival times that inform evacuation planning and early warning efforts.
January 21, 2026 at 10:35 AM
🌊 Did you know that #seafloor maps play a critical role in tsunami prediction?
Bathymetry plays a foundational role in tsunami simulations, influencing wave propagation and arrival times that inform evacuation planning and early warning efforts.
Bathymetry plays a foundational role in tsunami simulations, influencing wave propagation and arrival times that inform evacuation planning and early warning efforts.
🤔 Ever heard of “isobaths”?
If you’ve looked at a bathymetric chart, you’ve seen them - even if you didn’t know the name.
⭕️ Isobaths are contour lines that connect points of equal depth on the seafloor, much like topographic contours on land maps connect points of equal elevation.
If you’ve looked at a bathymetric chart, you’ve seen them - even if you didn’t know the name.
⭕️ Isobaths are contour lines that connect points of equal depth on the seafloor, much like topographic contours on land maps connect points of equal elevation.

January 16, 2026 at 9:03 AM
🤔 Ever heard of “isobaths”?
If you’ve looked at a bathymetric chart, you’ve seen them - even if you didn’t know the name.
⭕️ Isobaths are contour lines that connect points of equal depth on the seafloor, much like topographic contours on land maps connect points of equal elevation.
If you’ve looked at a bathymetric chart, you’ve seen them - even if you didn’t know the name.
⭕️ Isobaths are contour lines that connect points of equal depth on the seafloor, much like topographic contours on land maps connect points of equal elevation.
👀 Can you identify this #underwater feature?
HINT: It's the longest mountain range on Earth.
Yet you’ve probably never seen it - because most of it lies beneath around 2,500 metres of ocean water.
HINT: It's the longest mountain range on Earth.
Yet you’ve probably never seen it - because most of it lies beneath around 2,500 metres of ocean water.


January 14, 2026 at 11:51 AM
👀 Can you identify this #underwater feature?
HINT: It's the longest mountain range on Earth.
Yet you’ve probably never seen it - because most of it lies beneath around 2,500 metres of ocean water.
HINT: It's the longest mountain range on Earth.
Yet you’ve probably never seen it - because most of it lies beneath around 2,500 metres of ocean water.
The ocean floor isn't static. From tectonic shifts to storm-driven sediment flows, it’s always changing.
⏳ In some places, sudden events can shift the seafloor by metres in moments - while in others, change happens millimetre by millimetre over millennia.
Swipe to learn more ➡️
⏳ In some places, sudden events can shift the seafloor by metres in moments - while in others, change happens millimetre by millimetre over millennia.
Swipe to learn more ➡️


January 12, 2026 at 4:07 PM
The ocean floor isn't static. From tectonic shifts to storm-driven sediment flows, it’s always changing.
⏳ In some places, sudden events can shift the seafloor by metres in moments - while in others, change happens millimetre by millimetre over millennia.
Swipe to learn more ➡️
⏳ In some places, sudden events can shift the seafloor by metres in moments - while in others, change happens millimetre by millimetre over millennia.
Swipe to learn more ➡️


January 12, 2026 at 12:42 PM
The ocean floor isn't static. From tectonic shifts to storm-driven sediment flows, it’s always changing.
⏳ In some places, sudden events can shift the seafloor by metres in moments - while in others, change happens millimetre by millimetre over millennia.
Swipe to learn more ➡️
⏳ In some places, sudden events can shift the seafloor by metres in moments - while in others, change happens millimetre by millimetre over millennia.
Swipe to learn more ➡️

✨Happy New Year from Seabed 2030!
As 2026 begins, our work to support a complete and openly available map of the #oceanfloor continues.
From climate research and ocean stewardship to marine planning and hazard assessment, access to accurate seabed information is becoming ever more important.
As 2026 begins, our work to support a complete and openly available map of the #oceanfloor continues.
From climate research and ocean stewardship to marine planning and hazard assessment, access to accurate seabed information is becoming ever more important.

January 1, 2026 at 9:02 AM
✨Happy New Year from Seabed 2030!
As 2026 begins, our work to support a complete and openly available map of the #oceanfloor continues.
From climate research and ocean stewardship to marine planning and hazard assessment, access to accurate seabed information is becoming ever more important.
As 2026 begins, our work to support a complete and openly available map of the #oceanfloor continues.
From climate research and ocean stewardship to marine planning and hazard assessment, access to accurate seabed information is becoming ever more important.
Mapping the #seafloor is a collective effort, and everyone can play a role in advancing this global mission.
Whether you work in:
🏢 Government
📈 Industry
🔍 Research
🌐 Non-profit
💳 Philanthropy
...or are an individual with a passion for the ocean, there is a place for you in the community.
Whether you work in:
🏢 Government
📈 Industry
🔍 Research
🌐 Non-profit
💳 Philanthropy
...or are an individual with a passion for the ocean, there is a place for you in the community.

December 30, 2025 at 9:02 AM
Mapping the #seafloor is a collective effort, and everyone can play a role in advancing this global mission.
Whether you work in:
🏢 Government
📈 Industry
🔍 Research
🌐 Non-profit
💳 Philanthropy
...or are an individual with a passion for the ocean, there is a place for you in the community.
Whether you work in:
🏢 Government
📈 Industry
🔍 Research
🌐 Non-profit
💳 Philanthropy
...or are an individual with a passion for the ocean, there is a place for you in the community.
🙏 As the year draws to a close, we’d like to take a moment to thank everyone across the ocean mapping community.
From technical partners and academic institutions to intergovernmental organisations and citizen scientists, the mission to map the ocean floor is a truly collective effort.
From technical partners and academic institutions to intergovernmental organisations and citizen scientists, the mission to map the ocean floor is a truly collective effort.
December 26, 2025 at 9:03 AM
🙏 As the year draws to a close, we’d like to take a moment to thank everyone across the ocean mapping community.
From technical partners and academic institutions to intergovernmental organisations and citizen scientists, the mission to map the ocean floor is a truly collective effort.
From technical partners and academic institutions to intergovernmental organisations and citizen scientists, the mission to map the ocean floor is a truly collective effort.
Despite major technological advances and international efforts, large areas of the world’s seabed remain poorly mapped - and access to detailed seabed information is uneven.
Swipe to learn how policy can help close these knowledge gaps ➡️
Swipe to learn how policy can help close these knowledge gaps ➡️


December 24, 2025 at 2:57 PM
Despite major technological advances and international efforts, large areas of the world’s seabed remain poorly mapped - and access to detailed seabed information is uneven.
Swipe to learn how policy can help close these knowledge gaps ➡️
Swipe to learn how policy can help close these knowledge gaps ➡️
Despite major technological advances and international efforts, large areas of the world’s #seabed remain poorly mapped - and access to detailed seabed information is uneven.
Swipe to learn how policy can help close these knowledge gaps ➡️
Swipe to learn how policy can help close these knowledge gaps ➡️


December 24, 2025 at 2:46 PM
Despite major technological advances and international efforts, large areas of the world’s #seabed remain poorly mapped - and access to detailed seabed information is uneven.
Swipe to learn how policy can help close these knowledge gaps ➡️
Swipe to learn how policy can help close these knowledge gaps ➡️
Here’s a quick ocean-mapping challenge for our community:
❓Can you guess what this underwater feature is?
Hint: It holds a Guinness World Record.
✍️ Leave your answer in the comments
👉 Slide to find out if you're right
❓Can you guess what this underwater feature is?
Hint: It holds a Guinness World Record.
✍️ Leave your answer in the comments
👉 Slide to find out if you're right


December 19, 2025 at 11:31 AM
Here’s a quick ocean-mapping challenge for our community:
❓Can you guess what this underwater feature is?
Hint: It holds a Guinness World Record.
✍️ Leave your answer in the comments
👉 Slide to find out if you're right
❓Can you guess what this underwater feature is?
Hint: It holds a Guinness World Record.
✍️ Leave your answer in the comments
👉 Slide to find out if you're right
🎧 Our last podcast episode of the year has landed!
As 2025 draws to a close, Head of Partnerships Stephen Hall sits down to explore how cutting-edge technology is transforming how we collect and share seafloor data with two expert guests:
As 2025 draws to a close, Head of Partnerships Stephen Hall sits down to explore how cutting-edge technology is transforming how we collect and share seafloor data with two expert guests:

December 18, 2025 at 9:28 AM
🎧 Our last podcast episode of the year has landed!
As 2025 draws to a close, Head of Partnerships Stephen Hall sits down to explore how cutting-edge technology is transforming how we collect and share seafloor data with two expert guests:
As 2025 draws to a close, Head of Partnerships Stephen Hall sits down to explore how cutting-edge technology is transforming how we collect and share seafloor data with two expert guests:
🤔 Did you know that many nations do not have their own hydrographic office? This is where global ocean-mapping efforts play an important supporting role.

December 15, 2025 at 1:24 PM
🤔 Did you know that many nations do not have their own hydrographic office? This is where global ocean-mapping efforts play an important supporting role.


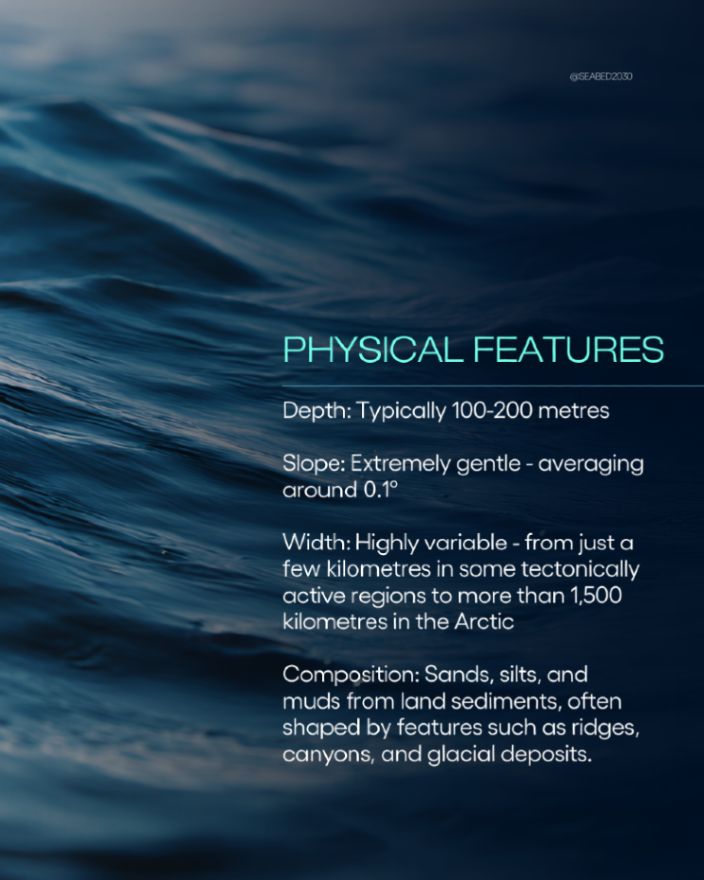
👀 The #ocean’s surface reveals only a fraction of the world beneath.
What lies below is a complex landscape of ridges, plains, valleys, and volcanic features shaped by Earth’s geological and ecological processes.
What lies below is a complex landscape of ridges, plains, valleys, and volcanic features shaped by Earth’s geological and ecological processes.


December 3, 2025 at 1:15 PM
👀 The #ocean’s surface reveals only a fraction of the world beneath.
What lies below is a complex landscape of ridges, plains, valleys, and volcanic features shaped by Earth’s geological and ecological processes.
What lies below is a complex landscape of ridges, plains, valleys, and volcanic features shaped by Earth’s geological and ecological processes.
🗺️ Most people presume the ocean is already mapped.
📍Even checking Google Maps can give that impression: the ocean appears covered in smooth blue shapes that look like detailed topographic features.
Yet most of these are not based on direct measurements.
📍Even checking Google Maps can give that impression: the ocean appears covered in smooth blue shapes that look like detailed topographic features.
Yet most of these are not based on direct measurements.

December 2, 2025 at 2:11 PM
🗺️ Most people presume the ocean is already mapped.
📍Even checking Google Maps can give that impression: the ocean appears covered in smooth blue shapes that look like detailed topographic features.
Yet most of these are not based on direct measurements.
📍Even checking Google Maps can give that impression: the ocean appears covered in smooth blue shapes that look like detailed topographic features.
Yet most of these are not based on direct measurements.
Then ➡️ Now: From hand-drawn ocean depths to digital precision!
Left: An 1885 bathymetric compilation crafted through detailed soundings and artistic skill (courtesy of NOAA)
Right: Modern mapping with thousands of data points per second (GEBCO grid)
Left: An 1885 bathymetric compilation crafted through detailed soundings and artistic skill (courtesy of NOAA)
Right: Modern mapping with thousands of data points per second (GEBCO grid)


November 28, 2025 at 3:04 PM
Then ➡️ Now: From hand-drawn ocean depths to digital precision!
Left: An 1885 bathymetric compilation crafted through detailed soundings and artistic skill (courtesy of NOAA)
Right: Modern mapping with thousands of data points per second (GEBCO grid)
Left: An 1885 bathymetric compilation crafted through detailed soundings and artistic skill (courtesy of NOAA)
Right: Modern mapping with thousands of data points per second (GEBCO grid)
Then ➡️ Now: From hand-drawn ocean depths to digital precision!
Left: An 1885 bathymetric compilation crafted through detailed soundings and artistic skill (courtesy of #NOAA)
Right: Modern multi-beam sonar mapping with thousands of data points per second (GEBCO grid)
Left: An 1885 bathymetric compilation crafted through detailed soundings and artistic skill (courtesy of #NOAA)
Right: Modern multi-beam sonar mapping with thousands of data points per second (GEBCO grid)
November 28, 2025 at 2:36 PM
Then ➡️ Now: From hand-drawn ocean depths to digital precision!
Left: An 1885 bathymetric compilation crafted through detailed soundings and artistic skill (courtesy of #NOAA)
Right: Modern multi-beam sonar mapping with thousands of data points per second (GEBCO grid)
Left: An 1885 bathymetric compilation crafted through detailed soundings and artistic skill (courtesy of #NOAA)
Right: Modern multi-beam sonar mapping with thousands of data points per second (GEBCO grid)
🤔 Looking for the latest version of the #GEBCO map?
The 2025 GEBCO bathymetric grid is available to download here:
🔗 https://www.gebco.net/data-products/gridded-bathymetry-data
The grid shows areas of the seafloor considered mapped - now covering 27.3% of the world's ocean floor.
The 2025 GEBCO bathymetric grid is available to download here:
🔗 https://www.gebco.net/data-products/gridded-bathymetry-data
The grid shows areas of the seafloor considered mapped - now covering 27.3% of the world's ocean floor.

November 24, 2025 at 10:02 AM
🤔 Looking for the latest version of the #GEBCO map?
The 2025 GEBCO bathymetric grid is available to download here:
🔗 https://www.gebco.net/data-products/gridded-bathymetry-data
The grid shows areas of the seafloor considered mapped - now covering 27.3% of the world's ocean floor.
The 2025 GEBCO bathymetric grid is available to download here:
🔗 https://www.gebco.net/data-products/gridded-bathymetry-data
The grid shows areas of the seafloor considered mapped - now covering 27.3% of the world's ocean floor.
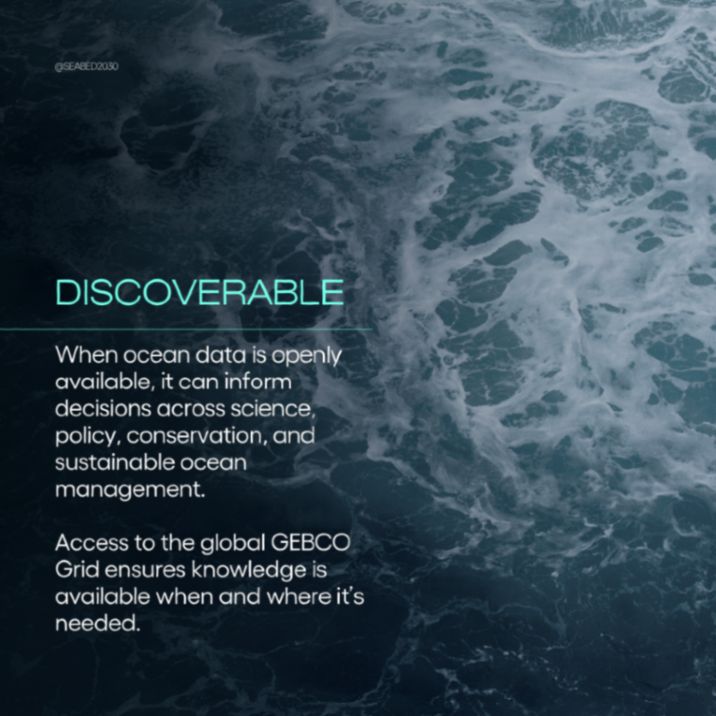
Our mission is not just to inspire a complete map of the #oceanfloor - it’s to help ensure that knowledge of the ocean is accessible to all.
Swipe to learn why 👇
Swipe to learn why 👇


November 17, 2025 at 9:03 AM
Our mission is not just to inspire a complete map of the #oceanfloor - it’s to help ensure that knowledge of the ocean is accessible to all.
Swipe to learn why 👇
Swipe to learn why 👇
🤖 Robots. They’re one of the biggest game-changers in ocean mapping.
Autonomous Underwater Vehicles (AUVs) and Remotely Operated Vehicles (ROVs) are expanding our ability to map and study the #seafloor with greater reach and precision than ever before.
Autonomous Underwater Vehicles (AUVs) and Remotely Operated Vehicles (ROVs) are expanding our ability to map and study the #seafloor with greater reach and precision than ever before.

November 14, 2025 at 3:27 PM
🤖 Robots. They’re one of the biggest game-changers in ocean mapping.
Autonomous Underwater Vehicles (AUVs) and Remotely Operated Vehicles (ROVs) are expanding our ability to map and study the #seafloor with greater reach and precision than ever before.
Autonomous Underwater Vehicles (AUVs) and Remotely Operated Vehicles (ROVs) are expanding our ability to map and study the #seafloor with greater reach and precision than ever before.
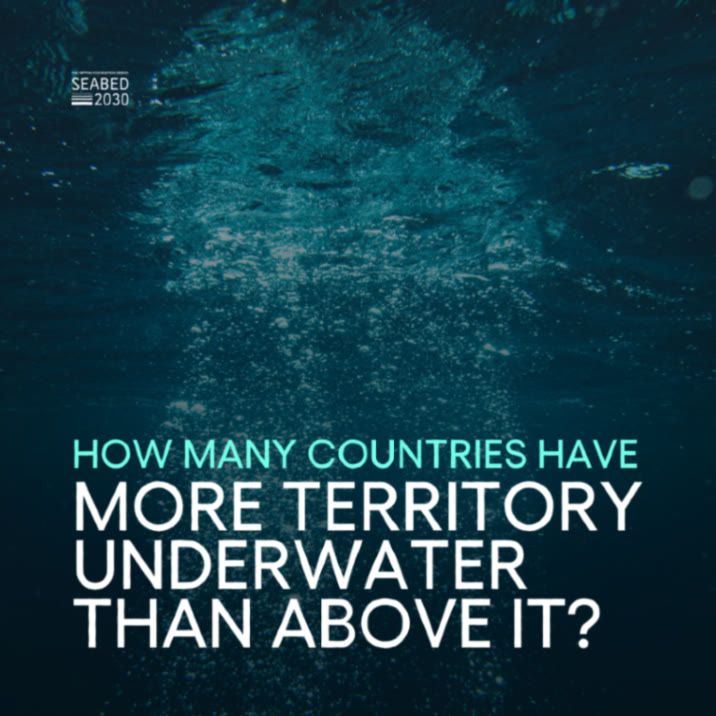
🌊 Did you know that many countries have more territory underwater than above it?
🇬🇧 United Kingdom: around 28x more ocean than land
🇫🇷 France: around 21x more ocean than land
🇳🇿 New Zealand: around 15x more ocean than land
🇯🇵 Japan: around 12x more ocean than land
🇬🇧 United Kingdom: around 28x more ocean than land
🇫🇷 France: around 21x more ocean than land
🇳🇿 New Zealand: around 15x more ocean than land
🇯🇵 Japan: around 12x more ocean than land
November 12, 2025 at 2:13 PM
🌊 Did you know that many countries have more territory underwater than above it?
🇬🇧 United Kingdom: around 28x more ocean than land
🇫🇷 France: around 21x more ocean than land
🇳🇿 New Zealand: around 15x more ocean than land
🇯🇵 Japan: around 12x more ocean than land
🇬🇧 United Kingdom: around 28x more ocean than land
🇫🇷 France: around 21x more ocean than land
🇳🇿 New Zealand: around 15x more ocean than land
🇯🇵 Japan: around 12x more ocean than land