


Dirk Burkhardt
@dirkburkhardt.bsky.social
Researcher in #VisualAnalytics, #DataScience and #InformationVisualization
Reposted by Dirk Burkhardt

Having fun with #wikipedia data. Plotted Belarusian places with foundation or first mention date marked (6.5% in total, somewhat 1.5k out of 23k). The uneven regional distribution of the existing data is striking, with the highest ratio in the Homyel region (37%)
#wip #D3js #Svelte #datavis
#wip #D3js #Svelte #datavis
December 10, 2025 at 12:16 PM
Having fun with #wikipedia data. Plotted Belarusian places with foundation or first mention date marked (6.5% in total, somewhat 1.5k out of 23k). The uneven regional distribution of the existing data is striking, with the highest ratio in the Homyel region (37%)
#wip #D3js #Svelte #datavis
#wip #D3js #Svelte #datavis
I always love when media uses alternative visualization metaphors that makes it better understandable what the numbers represent. The WSJ is a great example, here to understand the huge amount of power abuse of the president and for whose.


December 13, 2025 at 7:57 PM
I always love when media uses alternative visualization metaphors that makes it better understandable what the numbers represent. The WSJ is a great example, here to understand the huge amount of power abuse of the president and for whose.
Smart way to compare multiple entities in regards of the different aspects. #dataviz #dataanalysis #data #visualization #visual #visualanalytics

This is interesting — a recent study of mode share (the % share of transportation trips by car, transit, walking, biking etc) relative to city size and income levels in almost 800 cities in 61 countries. Interesting results. HT @davidzipper.bsky.social
www.sciencedirect.com/science/arti...
www.sciencedirect.com/science/arti...

December 10, 2025 at 8:24 PM
Smart way to compare multiple entities in regards of the different aspects. #dataviz #dataanalysis #data #visualization #visual #visualanalytics
Reposted by Dirk Burkhardt
Here is the HUXt model visualization of all the CMEs currently being tracked. The Sun is at the center. The Earth is the black dot to the right. There are two CME direct hits in the M8.1+M1.1 and M2.4 (assuming the CMEs combine) CME, and there is one glancing blow in the X1.1 CME.
December 8, 2025 at 7:35 PM
Here is the HUXt model visualization of all the CMEs currently being tracked. The Sun is at the center. The Earth is the black dot to the right. There are two CME direct hits in the M8.1+M1.1 and M2.4 (assuming the CMEs combine) CME, and there is one glancing blow in the X1.1 CME.
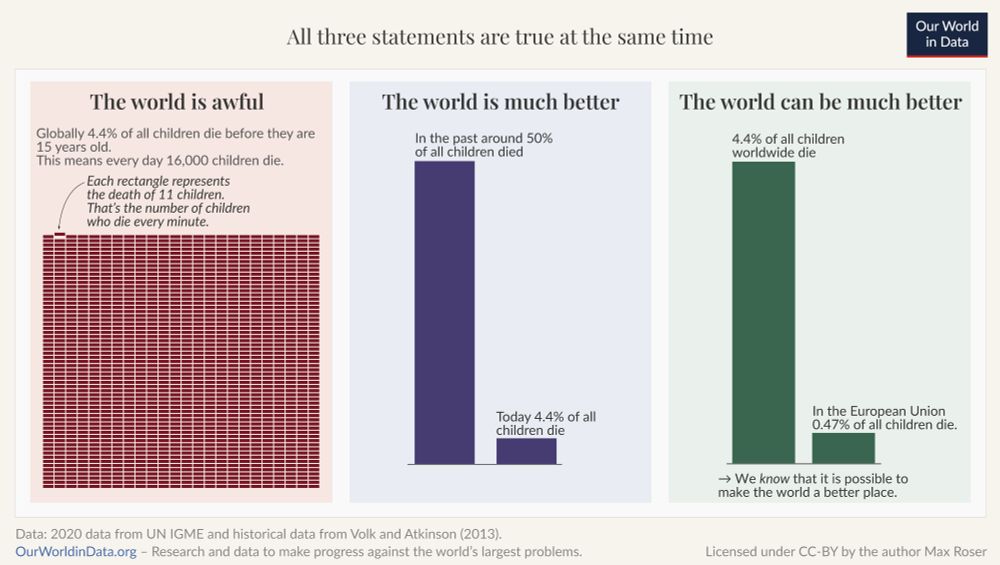
A chart is just a chart is just a chart... Sometimes a chart can represent a sceptic or optimistic view, even it shows the same data - demanding on what story should be told. 💡

The world is awful. The world is much better. The world can be much better.
All three statements are true at the same time. Understanding this is key to solving big global problems.
We believe data & research can help us understand both the problems we face & the progress that’s possible. 🧵
All three statements are true at the same time. Understanding this is key to solving big global problems.
We believe data & research can help us understand both the problems we face & the progress that’s possible. 🧵
December 5, 2025 at 5:48 PM
A chart is just a chart is just a chart... Sometimes a chart can represent a sceptic or optimistic view, even it shows the same data - demanding on what story should be told. 💡
Little joke about math and Xmas… Yeah, I know, it's pretty low.😅

Here is a godawful joke in chart form to ruin your Christmas season 🤪🎄

December 4, 2025 at 11:21 PM
Little joke about math and Xmas… Yeah, I know, it's pretty low.😅
Ever wanted to understand how fast China became the biggest exporter of cars worldwide? A visual chart simulation sketches the development and how it tremendously changed in the last recent years. 📊👩💻

In nur 5 Jahren hat China den Automobilmarkt übernommen und ist uns parallel beim E-Auto davon gerast.
Dass Kanzler Merz allen ernstes davon spricht, dass wir 2035 noch "hocheffiziente Verbrenner" verkaufen, macht es noch verrückter.
Dass Kanzler Merz allen ernstes davon spricht, dass wir 2035 noch "hocheffiziente Verbrenner" verkaufen, macht es noch verrückter.
December 4, 2025 at 11:18 PM
Ever wanted to understand how fast China became the biggest exporter of cars worldwide? A visual chart simulation sketches the development and how it tremendously changed in the last recent years. 📊👩💻
Reposted by Dirk Burkhardt

The main problem is that space telescopes in Low Earth Orbit share the similar orbits as the telecommunication satellites.
Here we show a simplified representation of the increased orbital crowding between 1958 (Sputnik) and the projected satellite population at the end of the next decade.
Here we show a simplified representation of the increased orbital crowding between 1958 (Sputnik) and the projected satellite population at the end of the next decade.
December 4, 2025 at 2:02 AM
The main problem is that space telescopes in Low Earth Orbit share the similar orbits as the telecommunication satellites.
Here we show a simplified representation of the increased orbital crowding between 1958 (Sputnik) and the projected satellite population at the end of the next decade.
Here we show a simplified representation of the increased orbital crowding between 1958 (Sputnik) and the projected satellite population at the end of the next decade.

The open data team of the European Comission has published "a comprehensive guide to unlock your data’s potential" which considers all scientifically aspect to create sufficient data visualisations. 📊📈
data.europa.eu/apps/data-vi...
#DataViz #data #visualisation #visual #analytics #graph
data.europa.eu/apps/data-vi...
#DataViz #data #visualisation #visual #analytics #graph
November 8, 2023 at 4:05 PM
The open data team of the European Comission has published "a comprehensive guide to unlock your data’s potential" which considers all scientifically aspect to create sufficient data visualisations. 📊📈
data.europa.eu/apps/data-vi...
#DataViz #data #visualisation #visual #analytics #graph
data.europa.eu/apps/data-vi...
#DataViz #data #visualisation #visual #analytics #graph
Reposted by Dirk Burkhardt

This remarkable ice shelf-ocean model is the first to include tides and the shape of cavities beneath ice shelves, allowing visualisation of small-scale ocean process that transport heat to ice shelves at a resolution of just 2km, right around #Antarctica.
youtu.be/jF1ZTACRrww?...
youtu.be/jF1ZTACRrww?...

High Resolution Simulation of Melting Antarctic Ice
The Antarctic ice sheet and the Southern Ocean are tightly connected. Ocean currents carry heat and salinity around the Antarctic continent. Researchers from...
youtu.be
November 7, 2023 at 11:28 PM
This remarkable ice shelf-ocean model is the first to include tides and the shape of cavities beneath ice shelves, allowing visualisation of small-scale ocean process that transport heat to ice shelves at a resolution of just 2km, right around #Antarctica.
youtu.be/jF1ZTACRrww?...
youtu.be/jF1ZTACRrww?...