


Ihar Yanouski
@iharyanouski.bsky.social
Freelance data visualization designer and #D3js developer based in Mensk, Belarus. Open for hire worldwide #datavis @ yanouski.com
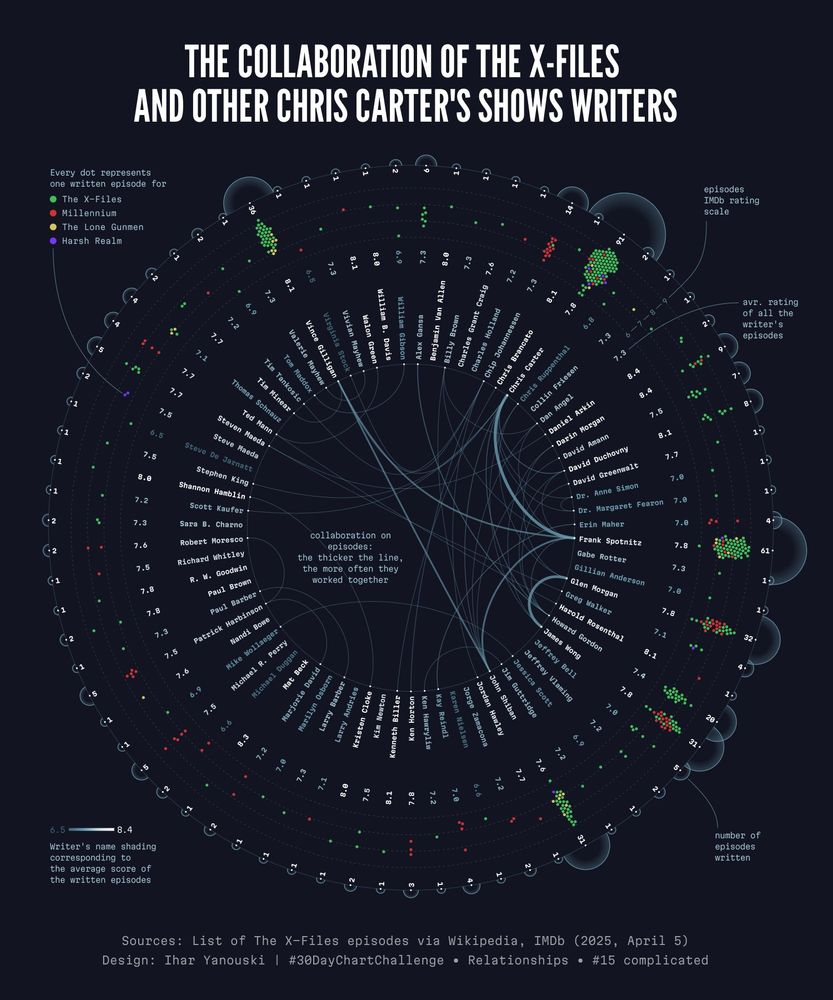
For the purpose of more practicing with #D3js and #Svelte made an interactive version of one of the previous infographics:
yanouski.com/projects/xfi...
#datavis #datavisualization #informationdesign #xfiles #tv
yanouski.com/projects/xfi...
#datavis #datavisualization #informationdesign #xfiles #tv

Every Writer of Chris Carter's TV Shows | Ihar Yanouski
Interactive data visualization is dedicated to the TV shows created by Chris Carter: The X-Files, Millennium, Harsh Realm, The Lone Gunmen, and The After. It features a comprehensive list of all scree...
yanouski.com
October 23, 2025 at 12:06 PM
For the purpose of more practicing with #D3js and #Svelte made an interactive version of one of the previous infographics:
yanouski.com/projects/xfi...
#datavis #datavisualization #informationdesign #xfiles #tv
yanouski.com/projects/xfi...
#datavis #datavisualization #informationdesign #xfiles #tv
Reposted by Ihar Yanouski

- feel welcome to share -
I'm looking for long and short term #datascience #datavis #frontent work.
I am best at making web based interactive data analysis tools, but also do backend, data science, APIs, UX, and frontend development.
Find my portfolio here: miskaknapek.eu
I'm looking for long and short term #datascience #datavis #frontent work.
I am best at making web based interactive data analysis tools, but also do backend, data science, APIs, UX, and frontend development.
Find my portfolio here: miskaknapek.eu
miska knapek - demo reel 2024
YouTube video by miska knapek
www.youtube.com
May 2, 2025 at 8:30 AM
- feel welcome to share -
I'm looking for long and short term #datascience #datavis #frontent work.
I am best at making web based interactive data analysis tools, but also do backend, data science, APIs, UX, and frontend development.
Find my portfolio here: miskaknapek.eu
I'm looking for long and short term #datascience #datavis #frontent work.
I am best at making web based interactive data analysis tools, but also do backend, data science, APIs, UX, and frontend development.
Find my portfolio here: miskaknapek.eu
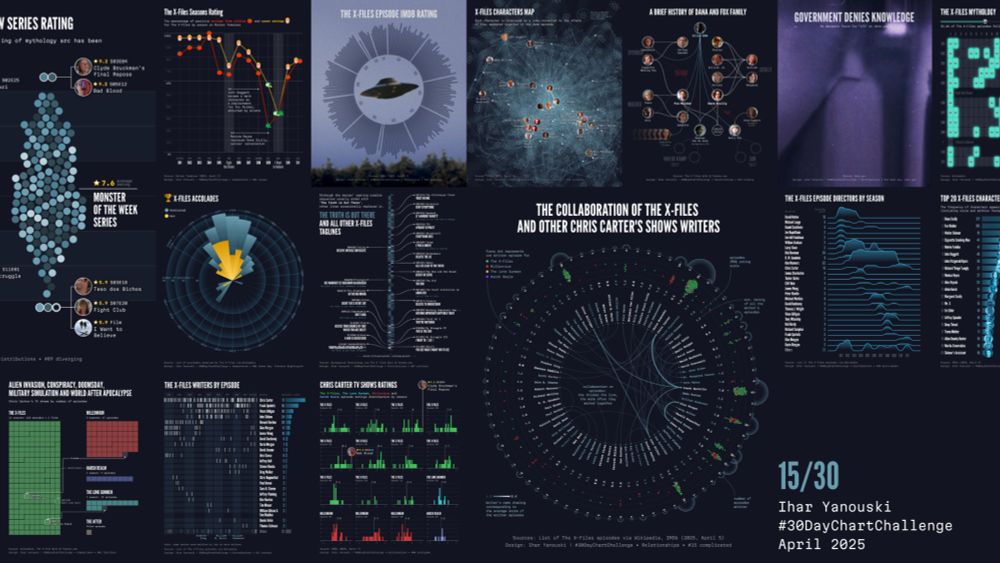
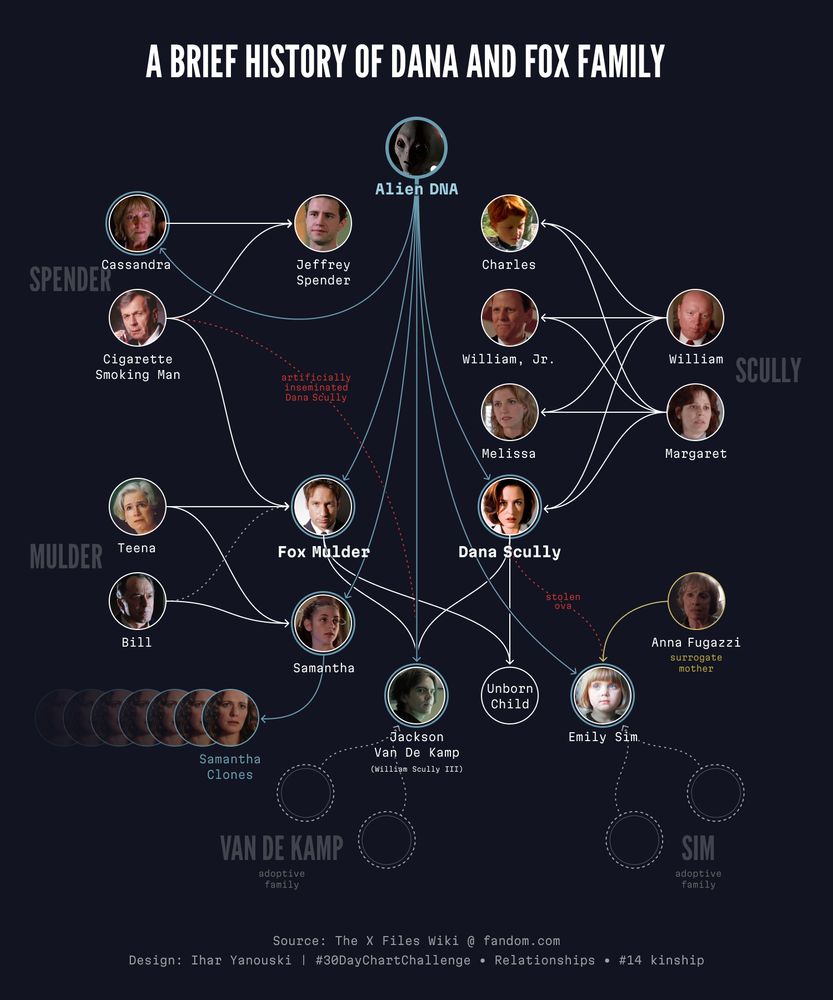
#30DayChartChallenge is over, happy to make 15/30 😌
Many thanks to the organizers and all the participants 👏
You can find all my contributions here: yanouski.com/work/30-day-...
Conspiracy mode deactivated 🛸
#xfiles #dataviz #datavisualization
Many thanks to the organizers and all the participants 👏
You can find all my contributions here: yanouski.com/work/30-day-...
Conspiracy mode deactivated 🛸
#xfiles #dataviz #datavisualization
The X-Files Infographics | Ihar Yanouski
A series of infographics about The X-Files TV show designed as part of the #30DayChartChallenge in April 2025
yanouski.com
May 1, 2025 at 1:21 PM
#30DayChartChallenge is over, happy to make 15/30 😌
Many thanks to the organizers and all the participants 👏
You can find all my contributions here: yanouski.com/work/30-day-...
Conspiracy mode deactivated 🛸
#xfiles #dataviz #datavisualization
Many thanks to the organizers and all the participants 👏
You can find all my contributions here: yanouski.com/work/30-day-...
Conspiracy mode deactivated 🛸
#xfiles #dataviz #datavisualization
April 21, 2025 at 10:40 AM
April 17, 2025 at 4:23 PM
April 15, 2025 at 6:52 PM
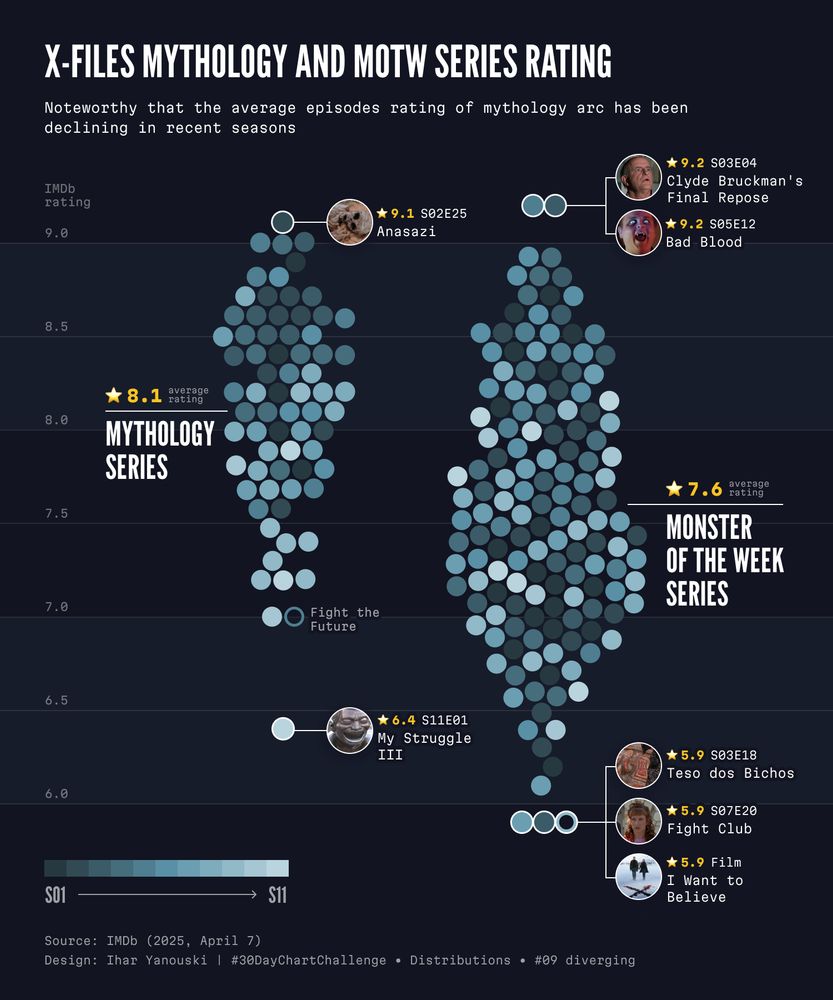
April 12, 2025 at 6:33 PM
April 12, 2025 at 7:22 AM
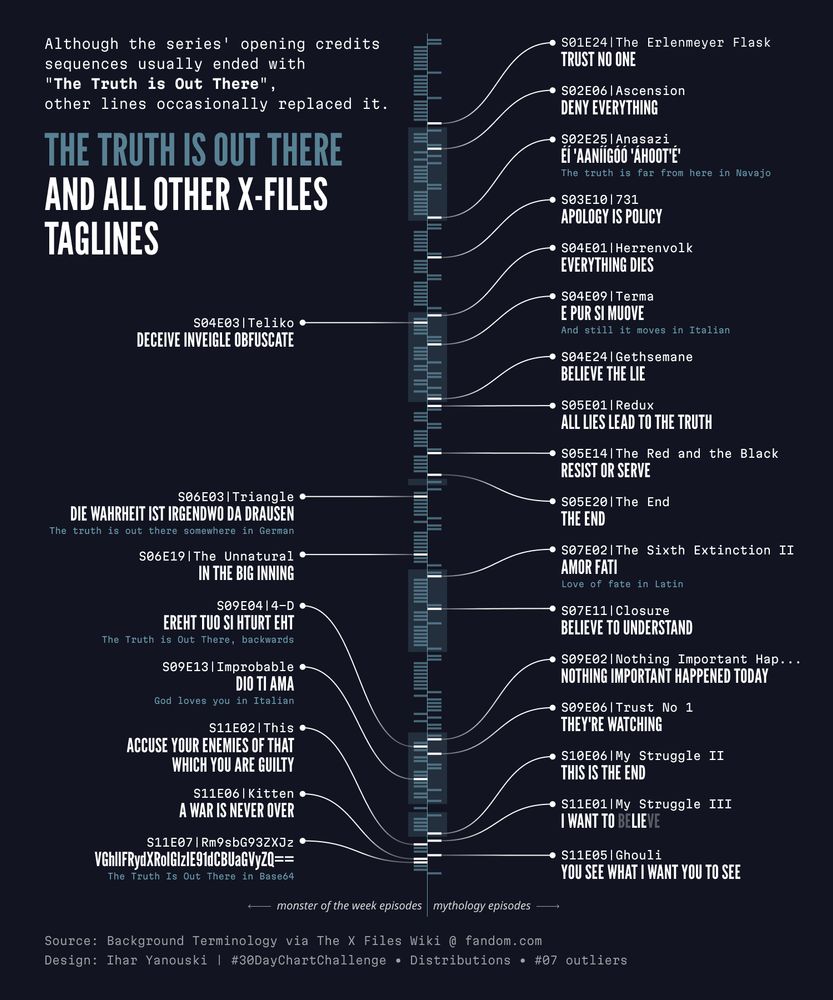
April 11, 2025 at 6:29 PM
April 10, 2025 at 12:27 PM
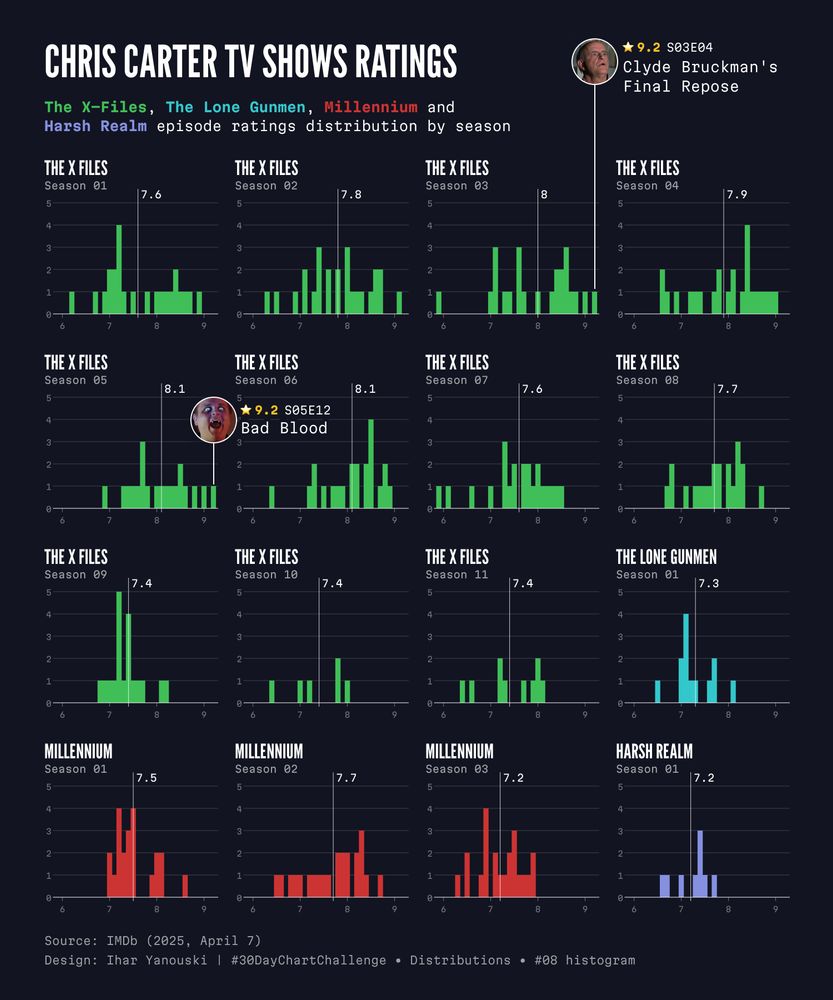
April 8, 2025 at 10:46 AM
April 7, 2025 at 12:28 PM
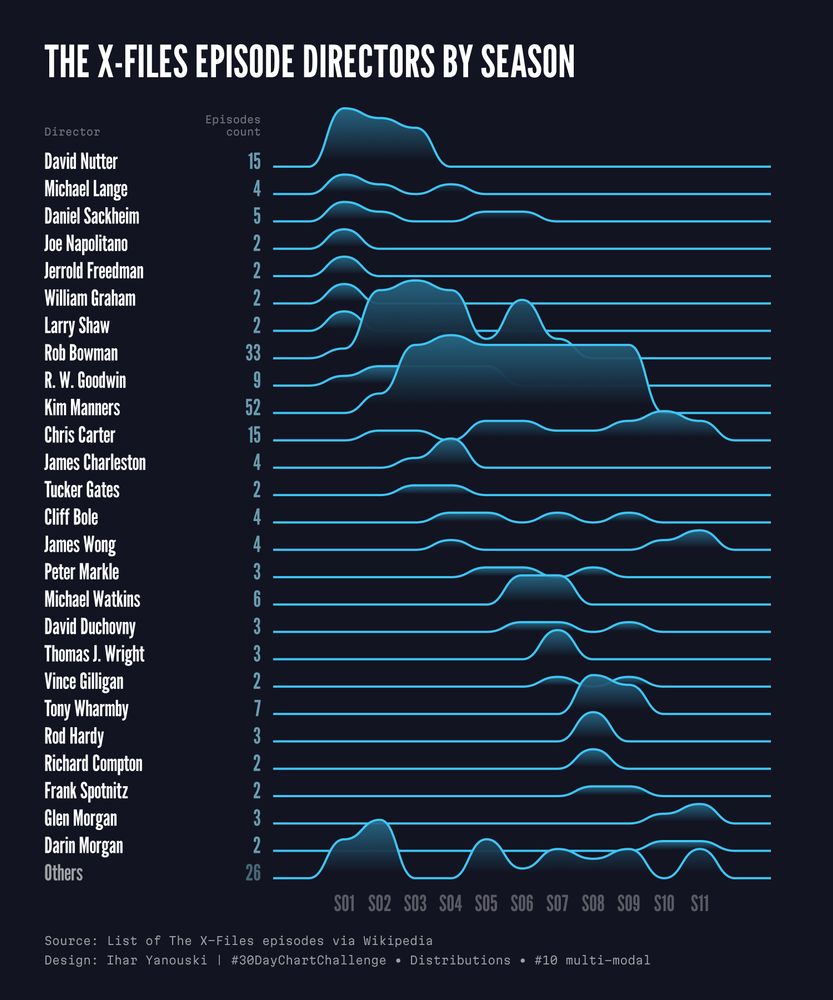
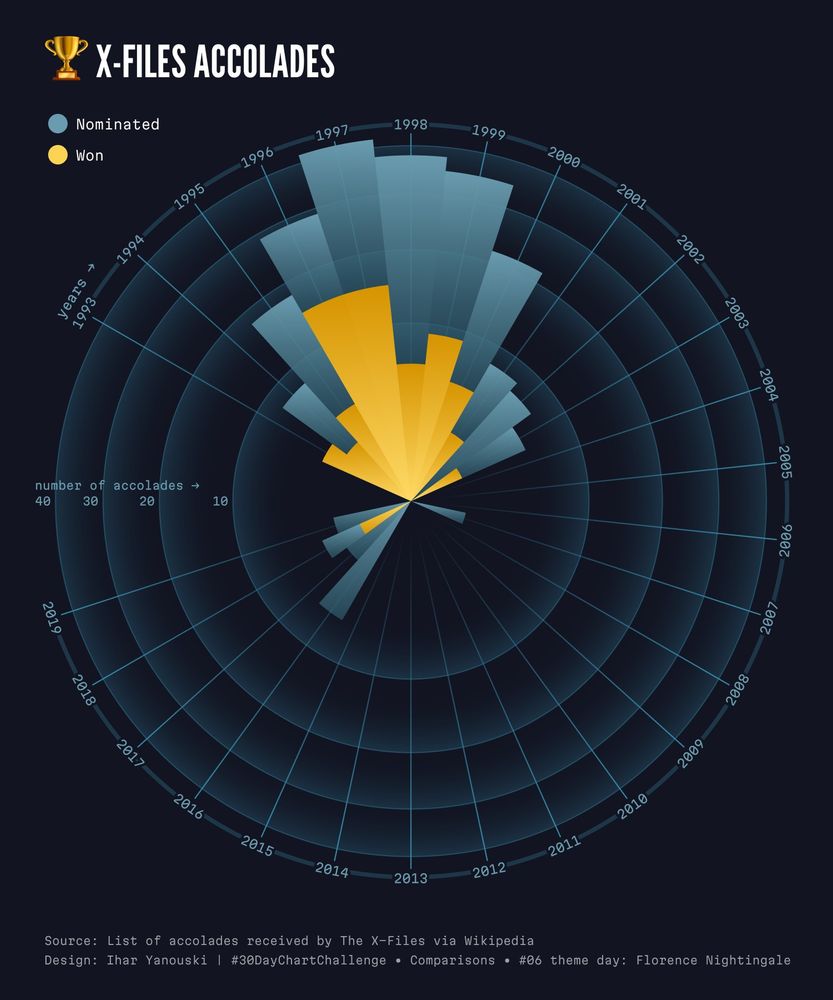
#30DayChartChallenge Day 6. theme day: Florence Nightingale
#TheXFiles #xfiles #dataviz #d3js #svelte
#TheXFiles #xfiles #dataviz #d3js #svelte
April 6, 2025 at 12:59 PM
#30DayChartChallenge Day 6. theme day: Florence Nightingale
#TheXFiles #xfiles #dataviz #d3js #svelte
#TheXFiles #xfiles #dataviz #d3js #svelte
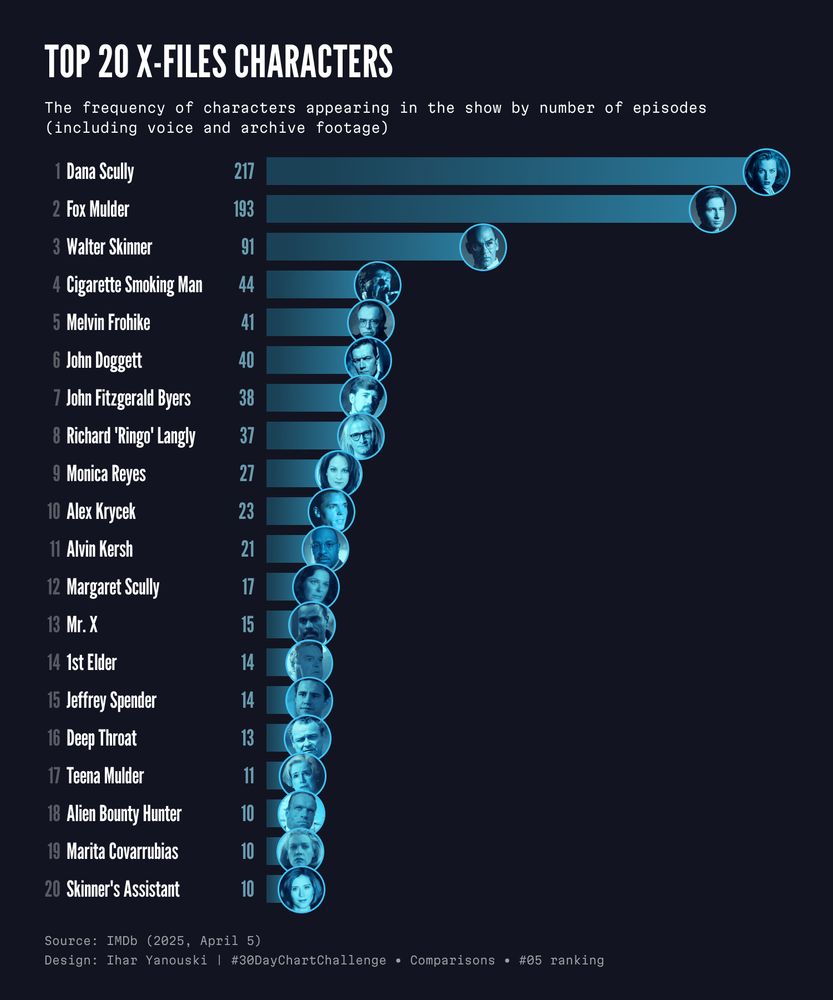
April 5, 2025 at 2:28 PM

April 4, 2025 at 5:00 PM

April 3, 2025 at 6:34 PM


April 1, 2025 at 7:32 PM


Meanwhile, I'm finally taking the Svelte + D3 intro tour. I knew it would be fun and I wasn't wrong 😌
@higsch.com many thanks for your videos and starter pack!
@higsch.com many thanks for your videos and starter pack!
December 12, 2024 at 5:55 PM
Meanwhile, I'm finally taking the Svelte + D3 intro tour. I knew it would be fun and I wasn't wrong 😌
@higsch.com many thanks for your videos and starter pack!
@higsch.com many thanks for your videos and starter pack!
Legendary podcast show returns in text version 😲

T'is the season to wrap up your projects, so…
here's a little write-up on an extensive
🎵 audio → ✏️ transcription
journey with @miskaknapek.bsky.social for the Data Stories podcast!
observablehq.com/@moritzstefa...
here's a little write-up on an extensive
🎵 audio → ✏️ transcription
journey with @miskaknapek.bsky.social for the Data Stories podcast!
observablehq.com/@moritzstefa...
Data Stories Podcast: Transcriptions
Data Stories is a podcast on data, visualization, and the many ways data affects our lives. Hosted by Enrico Bertini and Moritz Stefaner, the podcast gathered ** guests** in ** episodes**, totalling...
observablehq.com
December 12, 2024 at 5:36 PM
Legendary podcast show returns in text version 😲
Welcome all new followers!
I'm a local history enthusiast and freelance information designer. Making #dataviz mainly for survey results presentation and analytical reports, also passionate with crafting #D3js custom interactives at yanouski.com
I'm a local history enthusiast and freelance information designer. Making #dataviz mainly for survey results presentation and analytical reports, also passionate with crafting #D3js custom interactives at yanouski.com

November 17, 2024 at 3:36 PM
Welcome all new followers!
I'm a local history enthusiast and freelance information designer. Making #dataviz mainly for survey results presentation and analytical reports, also passionate with crafting #D3js custom interactives at yanouski.com
I'm a local history enthusiast and freelance information designer. Making #dataviz mainly for survey results presentation and analytical reports, also passionate with crafting #D3js custom interactives at yanouski.com
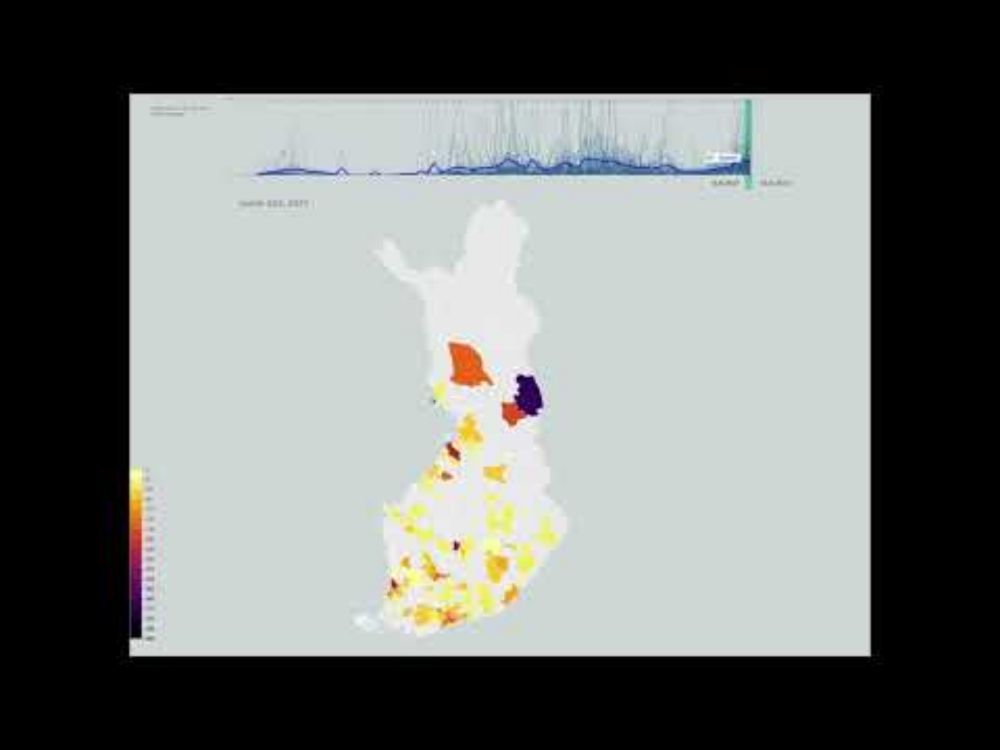
Okay, I'm back with my second try to start here some blogging.
And since I got on Bluesky thanks to #30DayChartChallenge, this is a good opportunity to share my submission for the 2024 challenge. Some half a year after it ended 😐
And since I got on Bluesky thanks to #30DayChartChallenge, this is a good opportunity to share my submission for the 2024 challenge. Some half a year after it ended 😐

October 2, 2024 at 3:30 PM
Okay, I'm back with my second try to start here some blogging.
And since I got on Bluesky thanks to #30DayChartChallenge, this is a good opportunity to share my submission for the 2024 challenge. Some half a year after it ended 😐
And since I got on Bluesky thanks to #30DayChartChallenge, this is a good opportunity to share my submission for the 2024 challenge. Some half a year after it ended 😐
Hi there!
(just a courtesy mic check post)
(just a courtesy mic check post)
March 12, 2024 at 1:46 PM
Hi there!
(just a courtesy mic check post)
(just a courtesy mic check post)