


IAndLoveAndData
@deepsha.bsky.social
Data Scientist | RStats | Observable | knitter by night
Reposted by IAndLoveAndData

New {paletteer} release dropped over the weekend! 159 color palettes have been added from vangogh, ButterflyColors, MoMAColors, PrettyCols, waRhol, MexBrewer, and ltc. Bringing the total to 2759 palettes from 75 different packages 🎨 #rstats
github.com/EmilHvitfeld...
github.com/EmilHvitfeld...


January 22, 2024 at 10:15 PM
New {paletteer} release dropped over the weekend! 159 color palettes have been added from vangogh, ButterflyColors, MoMAColors, PrettyCols, waRhol, MexBrewer, and ltc. Bringing the total to 2759 palettes from 75 different packages 🎨 #rstats
github.com/EmilHvitfeld...
github.com/EmilHvitfeld...
Took a break from social during vacation, which was easier than I thought it’d be 🙂 But as promised here’s the part two of the article of fine tuning your chatbot with #Python and #OpenAI where I actually feed it customer queries! Hope you enjoy.
blog.gopenai.com/in-depth-gui...
blog.gopenai.com/in-depth-gui...
January 2, 2024 at 6:49 PM
Took a break from social during vacation, which was easier than I thought it’d be 🙂 But as promised here’s the part two of the article of fine tuning your chatbot with #Python and #OpenAI where I actually feed it customer queries! Hope you enjoy.
blog.gopenai.com/in-depth-gui...
blog.gopenai.com/in-depth-gui...
It was really fun to create a customer service chatbot with #OpenAI and #Python. Here's the first in-depth setup article on the steps and I am excited to for the next one - Fine tuning it with actual customer service support query dataset.

In-depth Guide to Building a Fine-Tuned Customer Service Chatbot with Python and OpenAI — Part...
Laying the Groundwork: From Basic Setup to Conversational AI chatbot
medium.com
December 14, 2023 at 9:48 PM
Reposted by IAndLoveAndData

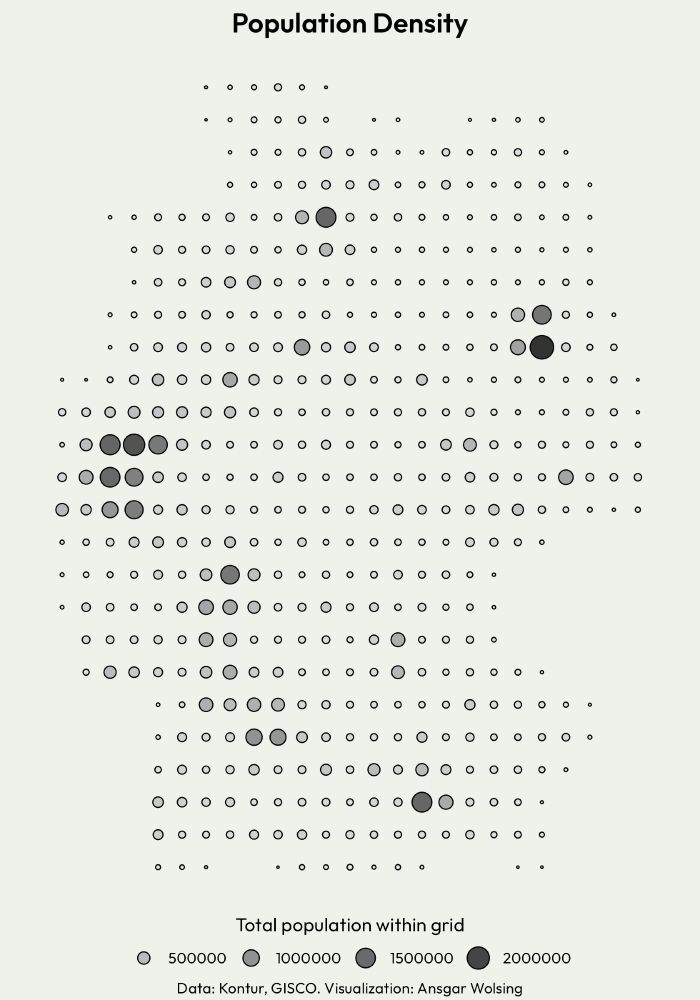
Population density, you ask?
November 30, 2023 at 7:30 PM
Population density, you ask?
#30DayMapChallenge - That’s a wrap folks. These challenges are so helpful to learn new things and most importantly to find that amazing community of support and growth.
@observablehq collection of all plots: observablehq.com/collection/@...
@observablehq collection of all plots: observablehq.com/collection/@...

November 30, 2023 at 6:40 PM
#30DayMapChallenge - That’s a wrap folks. These challenges are so helpful to learn new things and most importantly to find that amazing community of support and growth.
@observablehq collection of all plots: observablehq.com/collection/@...
@observablehq collection of all plots: observablehq.com/collection/@...
Day 30 - #30DayMapChallenge coming to a close with my favorite… the rail network in Europe, so I plotted the densest one!
@observablehq code: observablehq.com/d/3387899f31...
@observablehq code: observablehq.com/d/3387899f31...

November 30, 2023 at 6:14 AM
Day 30 - #30DayMapChallenge coming to a close with my favorite… the rail network in Europe, so I plotted the densest one!
@observablehq code: observablehq.com/d/3387899f31...
@observablehq code: observablehq.com/d/3387899f31...
Day 29 - population #30DayMapChallenge - the stark difference in Washington county land area and population concentration
@observablehq notebook: observablehq.com/d/e862d99f7f...
@observablehq notebook: observablehq.com/d/e862d99f7f...


November 29, 2023 at 5:49 AM
Day 29 - population #30DayMapChallenge - the stark difference in Washington county land area and population concentration
@observablehq notebook: observablehq.com/d/e862d99f7f...
@observablehq notebook: observablehq.com/d/e862d99f7f...
Day 28: chart or map #30DayMapChallenge This right here is the reason I leave for work at 6:30 as after that even 5 min delay in leaving leads to additional 15 min delay in arrival!
@observablehq plot: observablehq.com/d/4649e9509a...
@observablehq plot: observablehq.com/d/4649e9509a...

November 28, 2023 at 6:14 AM
Day 28: chart or map #30DayMapChallenge This right here is the reason I leave for work at 6:30 as after that even 5 min delay in leaving leads to additional 15 min delay in arrival!
@observablehq plot: observablehq.com/d/4649e9509a...
@observablehq plot: observablehq.com/d/4649e9509a...
Day 24: B&W #30DayMapChallenge Washington state, where are the people coming from and leaving to.
@observablehq code: observablehq.com/d/aac5c362ca...
@observablehq code: observablehq.com/d/aac5c362ca...

November 24, 2023 at 5:41 AM
Day 24: B&W #30DayMapChallenge Washington state, where are the people coming from and leaving to.
@observablehq code: observablehq.com/d/aac5c362ca...
@observablehq code: observablehq.com/d/aac5c362ca...
Day 23: 3D #30DayMapChallenge Diamond production across the globe. You can play the animation in the notebook.
@observablehq notebook: observablehq.com/d/f493efcdc8...
@observablehq notebook: observablehq.com/d/f493efcdc8...

November 23, 2023 at 6:21 AM
Day 23: 3D #30DayMapChallenge Diamond production across the globe. You can play the animation in the notebook.
@observablehq notebook: observablehq.com/d/f493efcdc8...
@observablehq notebook: observablehq.com/d/f493efcdc8...
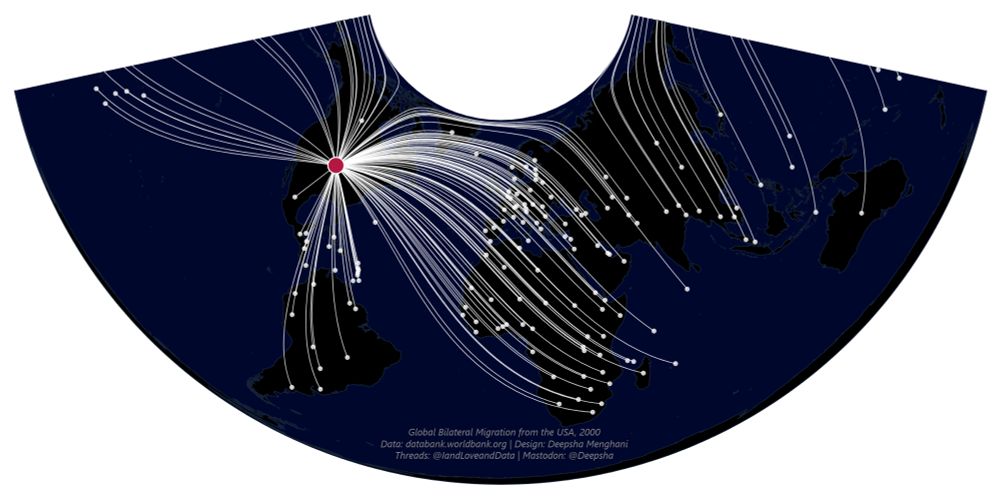
Day 22: North is not always up. Bilateral Migration map of US replicated with a conic equal area projection really tripped me up. But it’s pretty to look at. #30DayMapChallenge
@observablehq notebook: observablehq.com/d/a548d4c4fc...
@observablehq notebook: observablehq.com/d/a548d4c4fc...
November 22, 2023 at 9:38 PM
Day 22: North is not always up. Bilateral Migration map of US replicated with a conic equal area projection really tripped me up. But it’s pretty to look at. #30DayMapChallenge
@observablehq notebook: observablehq.com/d/a548d4c4fc...
@observablehq notebook: observablehq.com/d/a548d4c4fc...
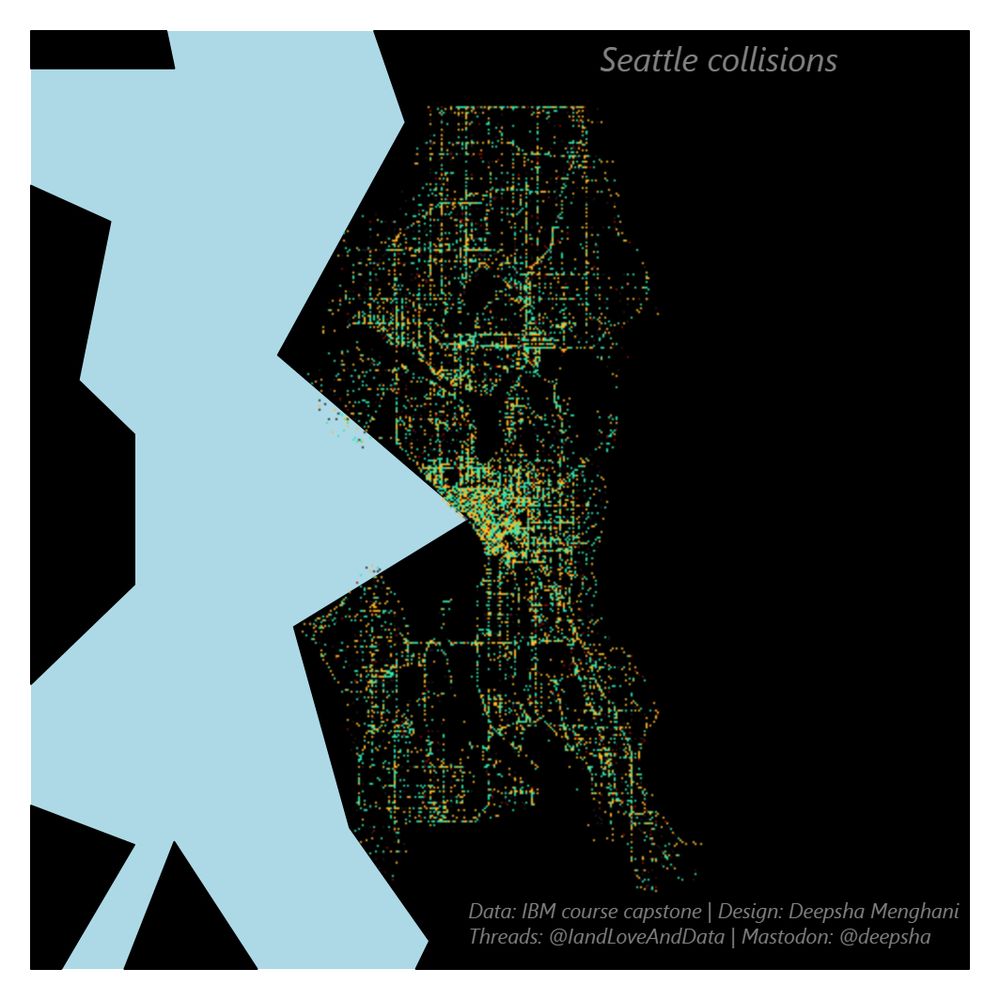
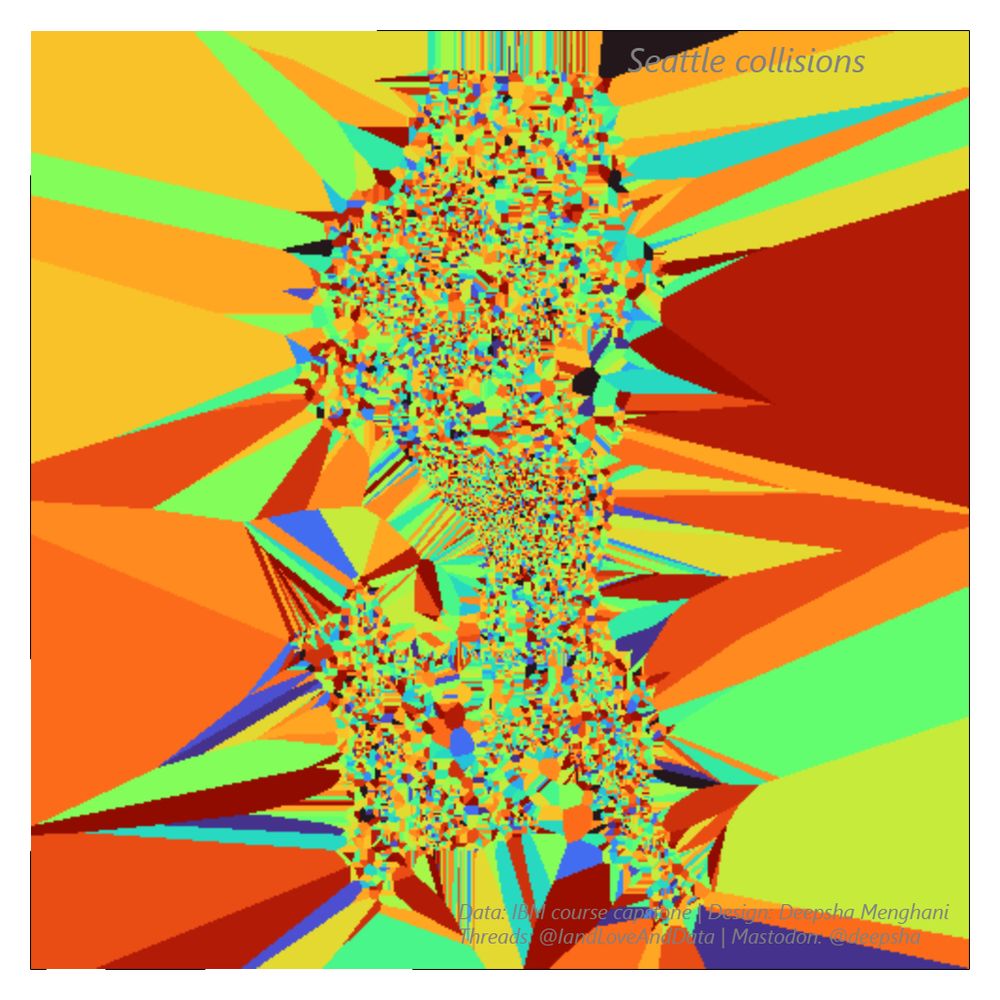
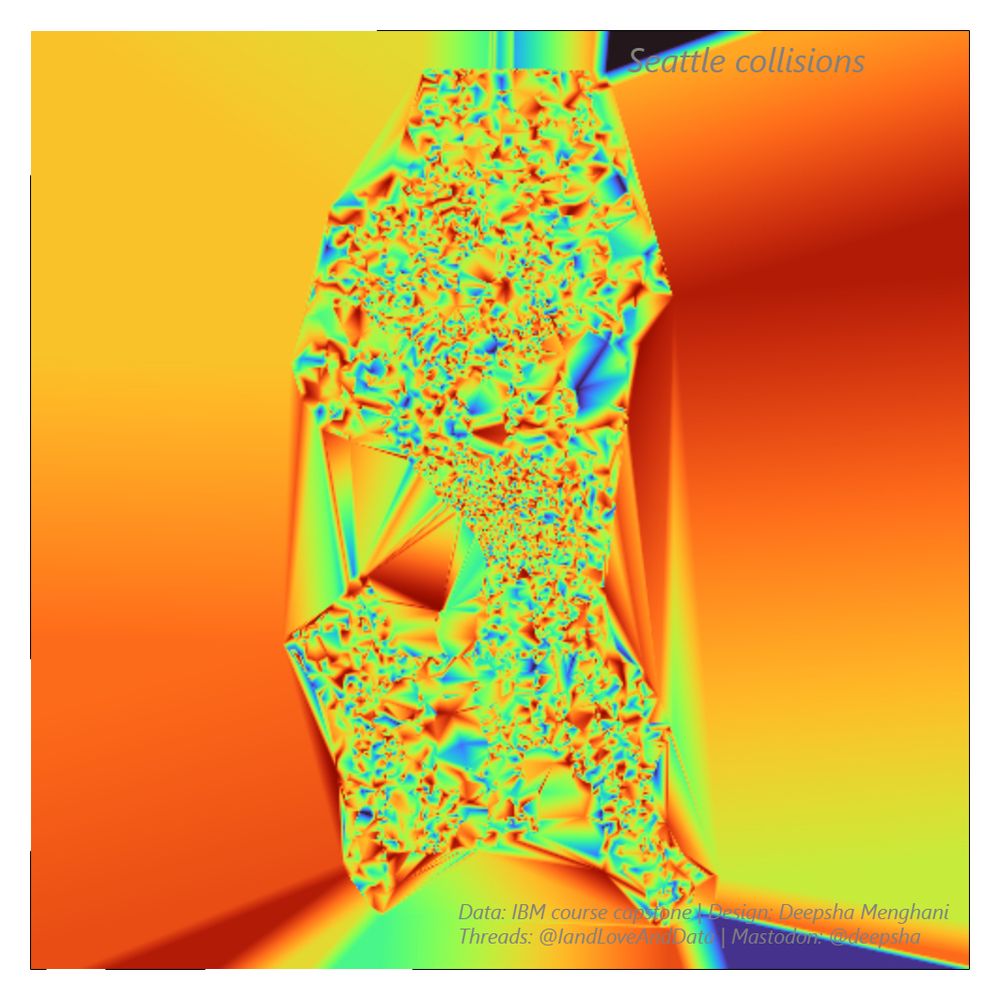
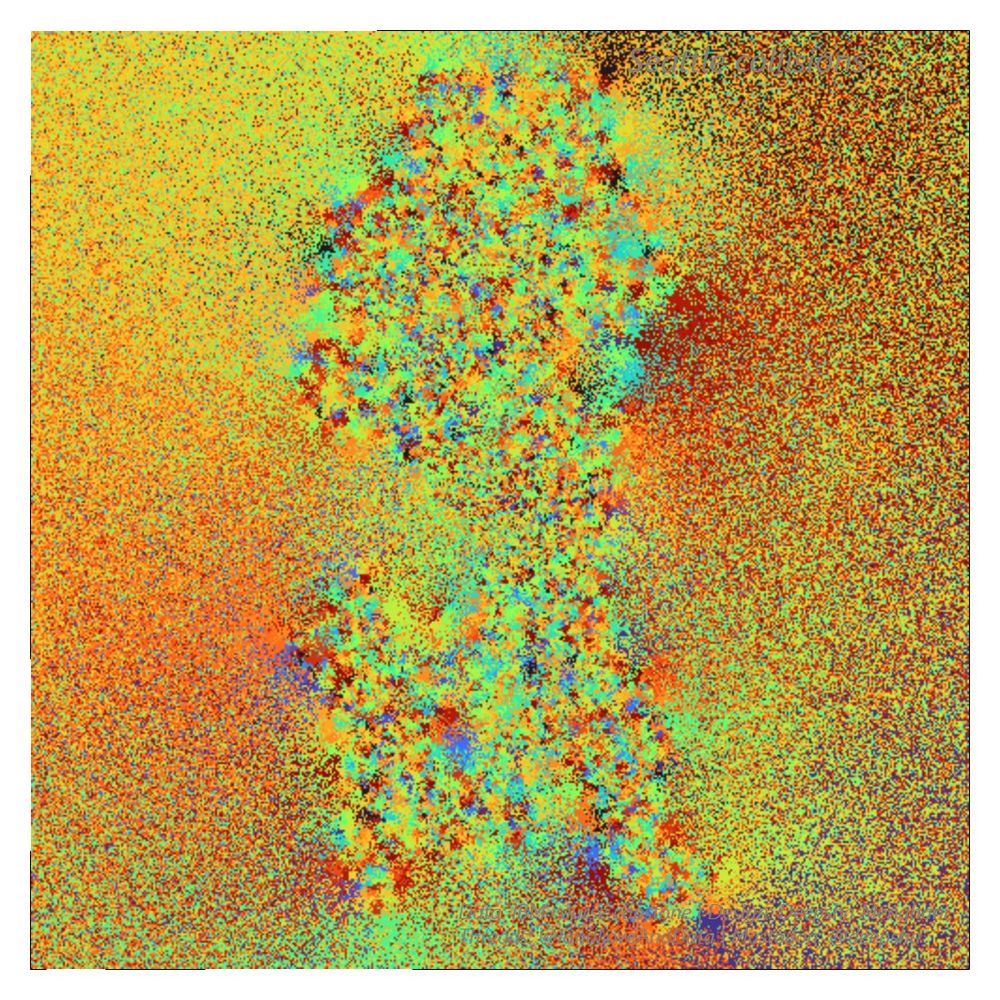
Day 21: Raster - #30DayMapChallenge I made accidental art trying to play with the raster options in @observablehq Plot using Seattle collision data. There is definitely a concentration.
Code: observablehq.com/d/9eff375d45...
Code: observablehq.com/d/9eff375d45...
November 22, 2023 at 4:00 AM
Day 21: Raster - #30DayMapChallenge I made accidental art trying to play with the raster options in @observablehq Plot using Seattle collision data. There is definitely a concentration.
Code: observablehq.com/d/9eff375d45...
Code: observablehq.com/d/9eff375d45...
Reposted by IAndLoveAndData

We are thrilled to announce that the latest version of sparklyr is on CRAN. sparklyr is the popular and powerful #RStats interface for #Apache #Spark, including Spark clusters hosted in #Databricks.
Learn more in the blog post: posit.co/blog/databri...
Learn more in the blog post: posit.co/blog/databri...

Next-generation access to Databricks clusters in RStudio with sparklyr and pysparklyr - Posit
Sparklyr is the popular and powerful R interface for Apache Spark, including Spark clusters hosted in Databricks. The latest version introduces a new backend hosted in the companion pysparklyr package...
posit.co
November 21, 2023 at 4:50 PM
We are thrilled to announce that the latest version of sparklyr is on CRAN. sparklyr is the popular and powerful #RStats interface for #Apache #Spark, including Spark clusters hosted in #Databricks.
Learn more in the blog post: posit.co/blog/databri...
Learn more in the blog post: posit.co/blog/databri...
Day 20 - outdoors #30DayMapChallenge - I learned states in US have state amphibians and Washington’s amphibian - Pacific chorus, was advocated for by fourth graders! You can toggle between the two and hover to see name of amphibian by state.
@observablehq - observablehq.com/d/40a49c6edf...
@observablehq - observablehq.com/d/40a49c6edf...


November 21, 2023 at 4:23 AM
Day 20 - outdoors #30DayMapChallenge - I learned states in US have state amphibians and Washington’s amphibian - Pacific chorus, was advocated for by fourth graders! You can toggle between the two and hover to see name of amphibian by state.
@observablehq - observablehq.com/d/40a49c6edf...
@observablehq - observablehq.com/d/40a49c6edf...
Reposted by IAndLoveAndData

Great idea! Thank you Francis for including me 😊
Maybe we keep this going? Let’s repost with people we admire in the data viz world. Some of mine:
@cedscherer.bsky.social
@karaman.is
@deepsha.bsky.social
@ansgarw.bsky.social
@nrennie.bsky.social
@visualisingdata.bsky.social
@fil.rezo.net
Maybe we keep this going? Let’s repost with people we admire in the data viz world. Some of mine:
@cedscherer.bsky.social
@karaman.is
@deepsha.bsky.social
@ansgarw.bsky.social
@nrennie.bsky.social
@visualisingdata.bsky.social
@fil.rezo.net

Let’s do this again.
8 dataviz accounts to follow here because they post and engage.
@jacquelinefehr.bsky.social
@datavisfriendly.bsky.social
@albertocairo.bsky.social
@spandl.bsky.social
@joemurph.bsky.social
@tanyashapiro.bsky.social
@seblammers.bsky.social
@jessicahullman.bsky.social
8 dataviz accounts to follow here because they post and engage.
@jacquelinefehr.bsky.social
@datavisfriendly.bsky.social
@albertocairo.bsky.social
@spandl.bsky.social
@joemurph.bsky.social
@tanyashapiro.bsky.social
@seblammers.bsky.social
@jessicahullman.bsky.social
November 19, 2023 at 7:13 PM
Great idea! Thank you Francis for including me 😊
Maybe we keep this going? Let’s repost with people we admire in the data viz world. Some of mine:
@cedscherer.bsky.social
@karaman.is
@deepsha.bsky.social
@ansgarw.bsky.social
@nrennie.bsky.social
@visualisingdata.bsky.social
@fil.rezo.net
Maybe we keep this going? Let’s repost with people we admire in the data viz world. Some of mine:
@cedscherer.bsky.social
@karaman.is
@deepsha.bsky.social
@ansgarw.bsky.social
@nrennie.bsky.social
@visualisingdata.bsky.social
@fil.rezo.net
Day 18 - Atmosphere - #30DayMapChallenge
Canada wind turbines show a visible bump around mid 2000s. You can see the animation in the notebook.
@observablehq code: observablehq.com/d/c6f5c06973...
Canada wind turbines show a visible bump around mid 2000s. You can see the animation in the notebook.
@observablehq code: observablehq.com/d/c6f5c06973...

November 18, 2023 at 5:29 PM
Day 18 - Atmosphere - #30DayMapChallenge
Canada wind turbines show a visible bump around mid 2000s. You can see the animation in the notebook.
@observablehq code: observablehq.com/d/c6f5c06973...
Canada wind turbines show a visible bump around mid 2000s. You can see the animation in the notebook.
@observablehq code: observablehq.com/d/c6f5c06973...
Reposted by IAndLoveAndData

#30DayMapChallenge 🗺️ | Day 17 | Flow
some arrows to show the largest population moves between states
code: github.com/curatedmess/...
#rstats
some arrows to show the largest population moves between states
code: github.com/curatedmess/...
#rstats

November 17, 2023 at 11:22 AM
#30DayMapChallenge 🗺️ | Day 17 | Flow
some arrows to show the largest population moves between states
code: github.com/curatedmess/...
#rstats
some arrows to show the largest population moves between states
code: github.com/curatedmess/...
#rstats

November 17, 2023 at 7:23 AM
Day 16 - Oceania - #30DayMapChallenge - where are the numbats! Numbats are unfortunately considered endangered today.
@observablehq notebook: observablehq.com/d/42af72caab...
@observablehq notebook: observablehq.com/d/42af72caab...

November 16, 2023 at 5:28 PM
Day 16 - Oceania - #30DayMapChallenge - where are the numbats! Numbats are unfortunately considered endangered today.
@observablehq notebook: observablehq.com/d/42af72caab...
@observablehq notebook: observablehq.com/d/42af72caab...
Day 14 - Europe, hydro energy distribution with Norway topping the chart.
@observablehq code: observablehq.com/d/9aeb73c82f...
@observablehq code: observablehq.com/d/9aeb73c82f...

November 15, 2023 at 6:36 AM
Day 14 - Europe, hydro energy distribution with Norway topping the chart.
@observablehq code: observablehq.com/d/9aeb73c82f...
@observablehq code: observablehq.com/d/9aeb73c82f...
Day 13 - Choropleth #30DayMapChallenge Political rights in Africa for the year 2020.
@observablehq notebook: observablehq.com/d/6c6d57b119...
This is the notebook that taught me to create this viz with very detailed instructions by Allison Horst and Paul Buffa - observablehq.com/@observableh...
@observablehq notebook: observablehq.com/d/6c6d57b119...
This is the notebook that taught me to create this viz with very detailed instructions by Allison Horst and Paul Buffa - observablehq.com/@observableh...

November 14, 2023 at 4:24 AM
Day 13 - Choropleth #30DayMapChallenge Political rights in Africa for the year 2020.
@observablehq notebook: observablehq.com/d/6c6d57b119...
This is the notebook that taught me to create this viz with very detailed instructions by Allison Horst and Paul Buffa - observablehq.com/@observableh...
@observablehq notebook: observablehq.com/d/6c6d57b119...
This is the notebook that taught me to create this viz with very detailed instructions by Allison Horst and Paul Buffa - observablehq.com/@observableh...
Day 12 South America - #30DayMapChallenge - This is my fav animation created because when I started I didn’t expect it to reveal such a beautiful pattern. Click “play” in the notebook for the animated pattern.
@observablehq code: observablehq.com/d/62f92bdd6e...
@observablehq code: observablehq.com/d/62f92bdd6e...

November 12, 2023 at 7:37 AM
Day 12 South America - #30DayMapChallenge - This is my fav animation created because when I started I didn’t expect it to reveal such a beautiful pattern. Click “play” in the notebook for the animated pattern.
@observablehq code: observablehq.com/d/62f92bdd6e...
@observablehq code: observablehq.com/d/62f92bdd6e...
Day 11 - retro - #30DayMapChallenge mapping a retro theme with a very recent data survey from stackoverflow about developer compensation in Europe.
@observablehq code: observablehq.com/d/28f2d06910...
@observablehq code: observablehq.com/d/28f2d06910...

November 11, 2023 at 7:21 AM
Day 11 - retro - #30DayMapChallenge mapping a retro theme with a very recent data survey from stackoverflow about developer compensation in Europe.
@observablehq code: observablehq.com/d/28f2d06910...
@observablehq code: observablehq.com/d/28f2d06910...
Day 10 - North America - I’ve been wanting to learn to make a US chart map with @observablehq Plot and todays #30DayMapChallenge combined perfectly with this weeks #tidytuesday to make that happen. I couldn’t decide between the two versions though!
Code: observablehq.com/d/f970cc6784...
Code: observablehq.com/d/f970cc6784...


November 10, 2023 at 6:40 AM
Day 10 - North America - I’ve been wanting to learn to make a US chart map with @observablehq Plot and todays #30DayMapChallenge combined perfectly with this weeks #tidytuesday to make that happen. I couldn’t decide between the two versions though!
Code: observablehq.com/d/f970cc6784...
Code: observablehq.com/d/f970cc6784...
Day 9 - hexagons #30DayMapChallenge
The state with the most tornadoes, and the parts of it that have been impacted by them based on frequency of tornadoes in the region of Texas.
@observablehq code: observablehq.com/d/d0f5edf1d6...
The state with the most tornadoes, and the parts of it that have been impacted by them based on frequency of tornadoes in the region of Texas.
@observablehq code: observablehq.com/d/d0f5edf1d6...

November 9, 2023 at 6:23 AM
Day 9 - hexagons #30DayMapChallenge
The state with the most tornadoes, and the parts of it that have been impacted by them based on frequency of tornadoes in the region of Texas.
@observablehq code: observablehq.com/d/d0f5edf1d6...
The state with the most tornadoes, and the parts of it that have been impacted by them based on frequency of tornadoes in the region of Texas.
@observablehq code: observablehq.com/d/d0f5edf1d6...