


Ryan
@ryanahart.bsky.social
Husband | Dad | Runner | Worker @slalom ... here exploring data visualization as a creative outlet ... All opinions are my own
#30DayChartChallenge | April 2024 - Day 20 | correlation
A 📊 chart showing the relationship between 3PT attempts and FT attempts...as a casual NBA fan, seems intuitive that this might be negatively correlated.
code: github.com/curatedmess/...
#ggplot2 #rstats #dataviz
A 📊 chart showing the relationship between 3PT attempts and FT attempts...as a casual NBA fan, seems intuitive that this might be negatively correlated.
code: github.com/curatedmess/...
#ggplot2 #rstats #dataviz

April 21, 2024 at 12:04 AM
#30DayChartChallenge | April 2024 - Day 20 | correlation
A 📊 chart showing the relationship between 3PT attempts and FT attempts...as a casual NBA fan, seems intuitive that this might be negatively correlated.
code: github.com/curatedmess/...
#ggplot2 #rstats #dataviz
A 📊 chart showing the relationship between 3PT attempts and FT attempts...as a casual NBA fan, seems intuitive that this might be negatively correlated.
code: github.com/curatedmess/...
#ggplot2 #rstats #dataviz
#30DayChartChallenge | April 2024 - Day 19 | dinosaurs
A 📊showing the timeline of albums released by the English rock band, T.Rex 🦖
code: github.com/curatedmess/...
#ggplot2 #rstats #dataviz
A 📊showing the timeline of albums released by the English rock band, T.Rex 🦖
code: github.com/curatedmess/...
#ggplot2 #rstats #dataviz

April 20, 2024 at 12:14 AM
#30DayChartChallenge | April 2024 - Day 19 | dinosaurs
A 📊showing the timeline of albums released by the English rock band, T.Rex 🦖
code: github.com/curatedmess/...
#ggplot2 #rstats #dataviz
A 📊showing the timeline of albums released by the English rock band, T.Rex 🦖
code: github.com/curatedmess/...
#ggplot2 #rstats #dataviz
#30DayChartChallenge | April 2024 - Day 18 | Asian Development Bank (data day)
Playing catch up for yesterday....A📊showing financed amounts in South Asia for 2023.
code: github.com/curatedmess/...
#ggplot2 #rstats #dataviz
Playing catch up for yesterday....A📊showing financed amounts in South Asia for 2023.
code: github.com/curatedmess/...
#ggplot2 #rstats #dataviz

April 19, 2024 at 12:09 PM
#30DayChartChallenge | April 2024 - Day 18 | Asian Development Bank (data day)
Playing catch up for yesterday....A📊showing financed amounts in South Asia for 2023.
code: github.com/curatedmess/...
#ggplot2 #rstats #dataviz
Playing catch up for yesterday....A📊showing financed amounts in South Asia for 2023.
code: github.com/curatedmess/...
#ggplot2 #rstats #dataviz
#30DayChartChallenge | April 2024 - Day 17 | networks
A 📊 showing word association with ChatGPT.
code: github.com/curatedmess/...
#ggplot2 #rstats #dataviz
A 📊 showing word association with ChatGPT.
code: github.com/curatedmess/...
#ggplot2 #rstats #dataviz

April 17, 2024 at 10:53 PM
#30DayChartChallenge | April 2024 - Day 17 | networks
A 📊 showing word association with ChatGPT.
code: github.com/curatedmess/...
#ggplot2 #rstats #dataviz
A 📊 showing word association with ChatGPT.
code: github.com/curatedmess/...
#ggplot2 #rstats #dataviz
#30DayChartChallenge | April 2024 - Day 16 | weather
A 📊 showing the 75 years of high/low temps in Charlotte for a random day, April 13.
code: github.com/curatedmess/...
#ggplot2 #rstats #dataviz
A 📊 showing the 75 years of high/low temps in Charlotte for a random day, April 13.
code: github.com/curatedmess/...
#ggplot2 #rstats #dataviz

April 16, 2024 at 6:37 PM
#30DayChartChallenge | April 2024 - Day 16 | weather
A 📊 showing the 75 years of high/low temps in Charlotte for a random day, April 13.
code: github.com/curatedmess/...
#ggplot2 #rstats #dataviz
A 📊 showing the 75 years of high/low temps in Charlotte for a random day, April 13.
code: github.com/curatedmess/...
#ggplot2 #rstats #dataviz
#30DayChartChallenge | April 2024 - Day 15 | historical
A 📊 showing a multi-generational family playing professional baseball in MLB for a combined 58 years
code: github.com/curatedmess/...
#ggplot2 #rstats #dataviz
A 📊 showing a multi-generational family playing professional baseball in MLB for a combined 58 years
code: github.com/curatedmess/...
#ggplot2 #rstats #dataviz

April 15, 2024 at 12:13 PM
#30DayChartChallenge | April 2024 - Day 15 | historical
A 📊 showing a multi-generational family playing professional baseball in MLB for a combined 58 years
code: github.com/curatedmess/...
#ggplot2 #rstats #dataviz
A 📊 showing a multi-generational family playing professional baseball in MLB for a combined 58 years
code: github.com/curatedmess/...
#ggplot2 #rstats #dataviz
#30DayChartChallenge | April 2024 - Day 14 | heat map
A 📊chart showing Google Trends , last 90 days for search term = "Brunch"
code: github.com/curatedmess/...
#ggplot2 #rstats #dataviz
A 📊chart showing Google Trends , last 90 days for search term = "Brunch"
code: github.com/curatedmess/...
#ggplot2 #rstats #dataviz

April 14, 2024 at 10:47 AM
#30DayChartChallenge | April 2024 - Day 14 | heat map
A 📊chart showing Google Trends , last 90 days for search term = "Brunch"
code: github.com/curatedmess/...
#ggplot2 #rstats #dataviz
A 📊chart showing Google Trends , last 90 days for search term = "Brunch"
code: github.com/curatedmess/...
#ggplot2 #rstats #dataviz
#30DayChartChallenge | April 2024 - Day 13 | Family
A 📊 chart showing the Lego brick colors for the Minecraft theme. Legos and Minecraft are big with my family. #TidyTuesday data set from week # 36, 2022.
code: github.com/curatedmess/...
#ggplot2 #rstats #dataviz
A 📊 chart showing the Lego brick colors for the Minecraft theme. Legos and Minecraft are big with my family. #TidyTuesday data set from week # 36, 2022.
code: github.com/curatedmess/...
#ggplot2 #rstats #dataviz

April 13, 2024 at 10:43 AM
#30DayChartChallenge | April 2024 - Day 13 | Family
A 📊 chart showing the Lego brick colors for the Minecraft theme. Legos and Minecraft are big with my family. #TidyTuesday data set from week # 36, 2022.
code: github.com/curatedmess/...
#ggplot2 #rstats #dataviz
A 📊 chart showing the Lego brick colors for the Minecraft theme. Legos and Minecraft are big with my family. #TidyTuesday data set from week # 36, 2022.
code: github.com/curatedmess/...
#ggplot2 #rstats #dataviz
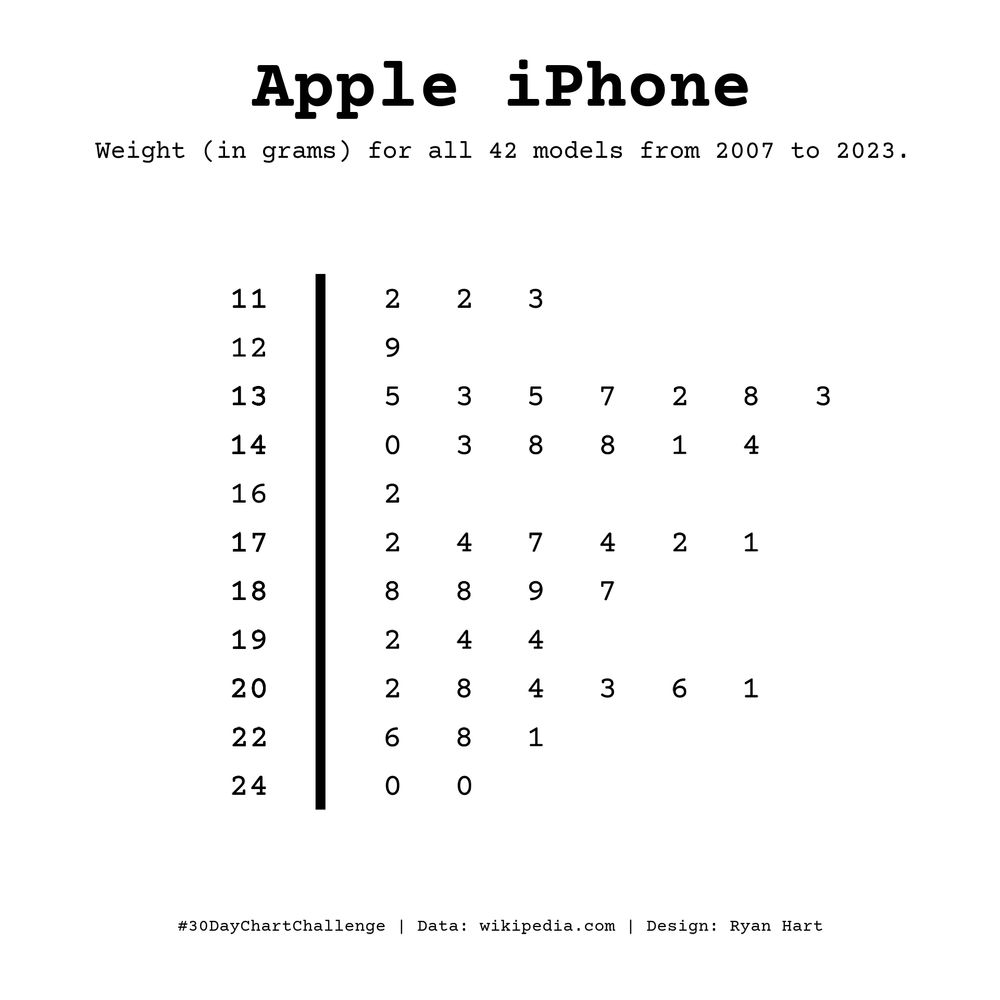
#30DayChartChallenge | April 2024 - Day 11 | Mobile Friendly
Distribution of the iPhone weights throughout it's evolution 📊 (iPhone Gen 1 to iPhone 15s)
code: github.com/curatedmess/...
#ggplot2 #rstats #dataviz
Distribution of the iPhone weights throughout it's evolution 📊 (iPhone Gen 1 to iPhone 15s)
code: github.com/curatedmess/...
#ggplot2 #rstats #dataviz
April 11, 2024 at 10:29 AM
#30DayChartChallenge | April 2024 - Day 11 | Mobile Friendly
Distribution of the iPhone weights throughout it's evolution 📊 (iPhone Gen 1 to iPhone 15s)
code: github.com/curatedmess/...
#ggplot2 #rstats #dataviz
Distribution of the iPhone weights throughout it's evolution 📊 (iPhone Gen 1 to iPhone 15s)
code: github.com/curatedmess/...
#ggplot2 #rstats #dataviz
#30DayChartChallenge | April 2024 - Day 10 | Physical
A 📊 distribution of Iron Mike's fight durations for his professional boxing career. I can't think anything more physical than stepping in a ring with Tyson.
code: github.com/curatedmess/...
#ggplot2 #rstats #dataviz
A 📊 distribution of Iron Mike's fight durations for his professional boxing career. I can't think anything more physical than stepping in a ring with Tyson.
code: github.com/curatedmess/...
#ggplot2 #rstats #dataviz

April 10, 2024 at 1:53 PM
#30DayChartChallenge | April 2024 - Day 10 | Physical
A 📊 distribution of Iron Mike's fight durations for his professional boxing career. I can't think anything more physical than stepping in a ring with Tyson.
code: github.com/curatedmess/...
#ggplot2 #rstats #dataviz
A 📊 distribution of Iron Mike's fight durations for his professional boxing career. I can't think anything more physical than stepping in a ring with Tyson.
code: github.com/curatedmess/...
#ggplot2 #rstats #dataviz
#30DayChartChallenge | April 2024 - Day 9 | Major/Minor
Messi goals 📊
"I am also aware that I went to a minor league, but a lot happens because of the way one faces it and competes." said Messi to Star+ about Miami.
code: github.com/curatedmess/...
#ggplot2 #rstats #dataviz
Messi goals 📊
"I am also aware that I went to a minor league, but a lot happens because of the way one faces it and competes." said Messi to Star+ about Miami.
code: github.com/curatedmess/...
#ggplot2 #rstats #dataviz

April 9, 2024 at 10:35 AM
#30DayChartChallenge | April 2024 - Day 9 | Major/Minor
Messi goals 📊
"I am also aware that I went to a minor league, but a lot happens because of the way one faces it and competes." said Messi to Star+ about Miami.
code: github.com/curatedmess/...
#ggplot2 #rstats #dataviz
Messi goals 📊
"I am also aware that I went to a minor league, but a lot happens because of the way one faces it and competes." said Messi to Star+ about Miami.
code: github.com/curatedmess/...
#ggplot2 #rstats #dataviz
#30DayChartChallenge | April 2024 - Day 8 | Circular
A 📊 showing Caitlin Clark's career points as the all-time NCAA scoring leader from Iowa, utilizing a uniform distribution of random numbers to plot the basketballs.
code: github.com/curatedmess/...
#ggplot2 #rstats #dataviz
A 📊 showing Caitlin Clark's career points as the all-time NCAA scoring leader from Iowa, utilizing a uniform distribution of random numbers to plot the basketballs.
code: github.com/curatedmess/...
#ggplot2 #rstats #dataviz

April 8, 2024 at 10:38 AM
#30DayChartChallenge | April 2024 - Day 8 | Circular
A 📊 showing Caitlin Clark's career points as the all-time NCAA scoring leader from Iowa, utilizing a uniform distribution of random numbers to plot the basketballs.
code: github.com/curatedmess/...
#ggplot2 #rstats #dataviz
A 📊 showing Caitlin Clark's career points as the all-time NCAA scoring leader from Iowa, utilizing a uniform distribution of random numbers to plot the basketballs.
code: github.com/curatedmess/...
#ggplot2 #rstats #dataviz
#30DayChartChallenge | April 2024 - Day 7 | Hazards
A 📊 about lightening events in North Carolina, U.S.A using FEMA's National Risk Index data.
code: github.com/curatedmess/...
#ggplot2 #rstats #dataviz
A 📊 about lightening events in North Carolina, U.S.A using FEMA's National Risk Index data.
code: github.com/curatedmess/...
#ggplot2 #rstats #dataviz

April 7, 2024 at 12:17 PM
#30DayChartChallenge | April 2024 - Day 7 | Hazards
A 📊 about lightening events in North Carolina, U.S.A using FEMA's National Risk Index data.
code: github.com/curatedmess/...
#ggplot2 #rstats #dataviz
A 📊 about lightening events in North Carolina, U.S.A using FEMA's National Risk Index data.
code: github.com/curatedmess/...
#ggplot2 #rstats #dataviz
#30DayChartChallenge | April 2024 - Day 6 | OECD
A 📊 at self-reported sick days. What's odd is that the US saw a significant increase in 2019 (+ 3.4 days) ending a declining trend.
code: github.com/curatedmess/...
#ggplot2 #rstats #dataviz
A 📊 at self-reported sick days. What's odd is that the US saw a significant increase in 2019 (+ 3.4 days) ending a declining trend.
code: github.com/curatedmess/...
#ggplot2 #rstats #dataviz

April 6, 2024 at 9:18 AM
#30DayChartChallenge | April 2024 - Day 6 | OECD
A 📊 at self-reported sick days. What's odd is that the US saw a significant increase in 2019 (+ 3.4 days) ending a declining trend.
code: github.com/curatedmess/...
#ggplot2 #rstats #dataviz
A 📊 at self-reported sick days. What's odd is that the US saw a significant increase in 2019 (+ 3.4 days) ending a declining trend.
code: github.com/curatedmess/...
#ggplot2 #rstats #dataviz
#30DayChartChallenge | April 2024 - Day 5 | Diverging
A 📊 Looking at the split of my runs from the last four years before or after 7 AM. Also, only ran six times after noon...I guess I'm more of a morning person.
code: github.com/curatedmess/...
#ggplot2 #rstats #dataviz
A 📊 Looking at the split of my runs from the last four years before or after 7 AM. Also, only ran six times after noon...I guess I'm more of a morning person.
code: github.com/curatedmess/...
#ggplot2 #rstats #dataviz

April 5, 2024 at 10:28 AM
#30DayChartChallenge | April 2024 - Day 5 | Diverging
A 📊 Looking at the split of my runs from the last four years before or after 7 AM. Also, only ran six times after noon...I guess I'm more of a morning person.
code: github.com/curatedmess/...
#ggplot2 #rstats #dataviz
A 📊 Looking at the split of my runs from the last four years before or after 7 AM. Also, only ran six times after noon...I guess I'm more of a morning person.
code: github.com/curatedmess/...
#ggplot2 #rstats #dataviz
Reposted by Ryan

#30DayChartChallenge | #Day4 | Waffle
This one went a bit over my 30 minute limit!
✨made 100 squares
✨distributed columns and rows
✨broke the loop into pre vs post threshold
glitch.com/edit/#!/04-o...
This one went a bit over my 30 minute limit!
✨made 100 squares
✨distributed columns and rows
✨broke the loop into pre vs post threshold
glitch.com/edit/#!/04-o...

April 4, 2024 at 1:04 PM
#30DayChartChallenge | #Day4 | Waffle
This one went a bit over my 30 minute limit!
✨made 100 squares
✨distributed columns and rows
✨broke the loop into pre vs post threshold
glitch.com/edit/#!/04-o...
This one went a bit over my 30 minute limit!
✨made 100 squares
✨distributed columns and rows
✨broke the loop into pre vs post threshold
glitch.com/edit/#!/04-o...
Reposted by Ryan

For the "Waffle" prompt on Day 4 of the #30DayChartChallenge, I revisited a data set on Bob Ross painting colours - and made a waffle chart with a hand-drawn effect using {roughsf}! 📊 🧇
#RStats #DataViz
#RStats #DataViz

April 4, 2024 at 12:58 PM
For the "Waffle" prompt on Day 4 of the #30DayChartChallenge, I revisited a data set on Bob Ross painting colours - and made a waffle chart with a hand-drawn effect using {roughsf}! 📊 🧇
#RStats #DataViz
#RStats #DataViz
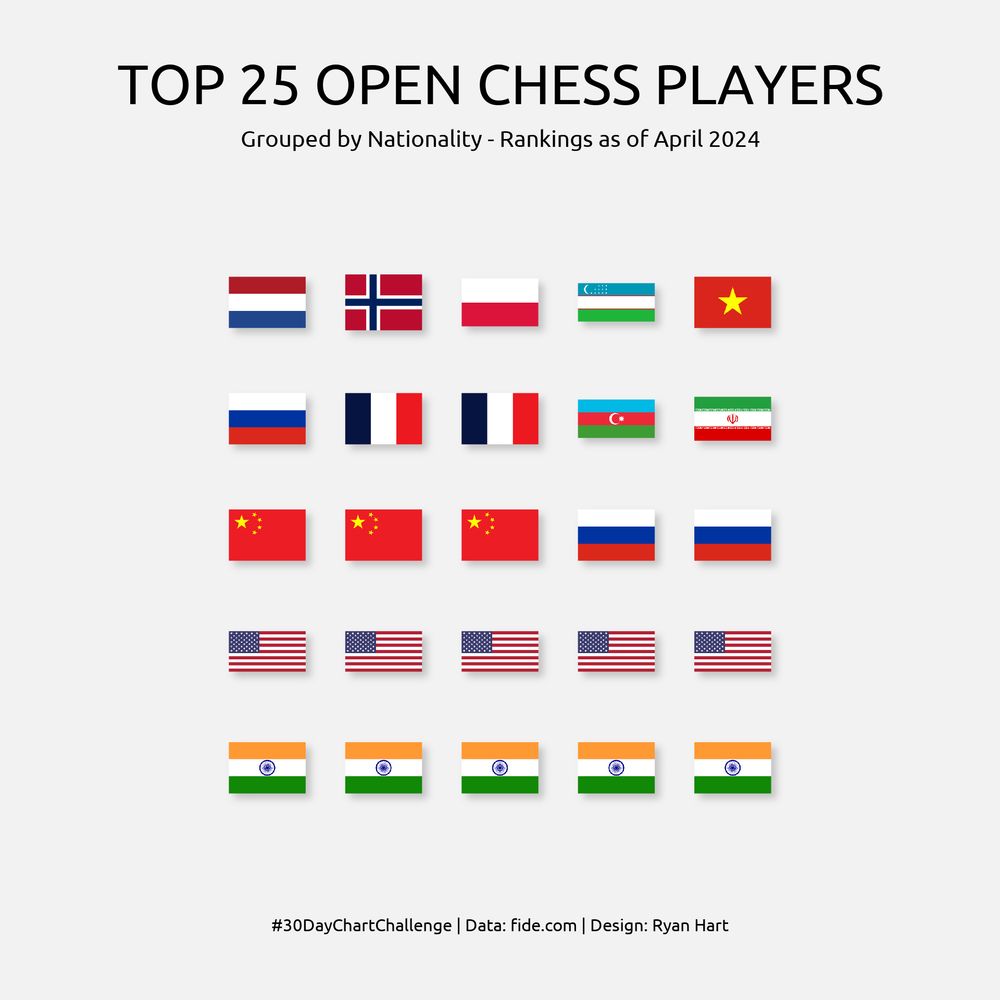
#30DayChartChallenge | April 2024 - Day 4 | Waffle
A waffle 📊 of sorts. 72% of the world's leading chess players have compatriots among the top 25 ranks.
code: github.com/curatedmess/...
#ggplot2 #rstats #dataviz
A waffle 📊 of sorts. 72% of the world's leading chess players have compatriots among the top 25 ranks.
code: github.com/curatedmess/...
#ggplot2 #rstats #dataviz
April 4, 2024 at 10:38 AM
#30DayChartChallenge | April 2024 - Day 4 | Waffle
A waffle 📊 of sorts. 72% of the world's leading chess players have compatriots among the top 25 ranks.
code: github.com/curatedmess/...
#ggplot2 #rstats #dataviz
A waffle 📊 of sorts. 72% of the world's leading chess players have compatriots among the top 25 ranks.
code: github.com/curatedmess/...
#ggplot2 #rstats #dataviz
#30DayChartChallenge | April 2024 - Day 3 | Makeover
Old enough to remember MTV's Pimp my Ride? A 📊 about the types of vehicles that got a makeover over the six seasons of the show.
code: github.com/curatedmess/...
#ggplot #rstats #dataviz
Old enough to remember MTV's Pimp my Ride? A 📊 about the types of vehicles that got a makeover over the six seasons of the show.
code: github.com/curatedmess/...
#ggplot #rstats #dataviz

April 3, 2024 at 10:39 AM
#30DayChartChallenge | April 2024 - Day 3 | Makeover
Old enough to remember MTV's Pimp my Ride? A 📊 about the types of vehicles that got a makeover over the six seasons of the show.
code: github.com/curatedmess/...
#ggplot #rstats #dataviz
Old enough to remember MTV's Pimp my Ride? A 📊 about the types of vehicles that got a makeover over the six seasons of the show.
code: github.com/curatedmess/...
#ggplot #rstats #dataviz
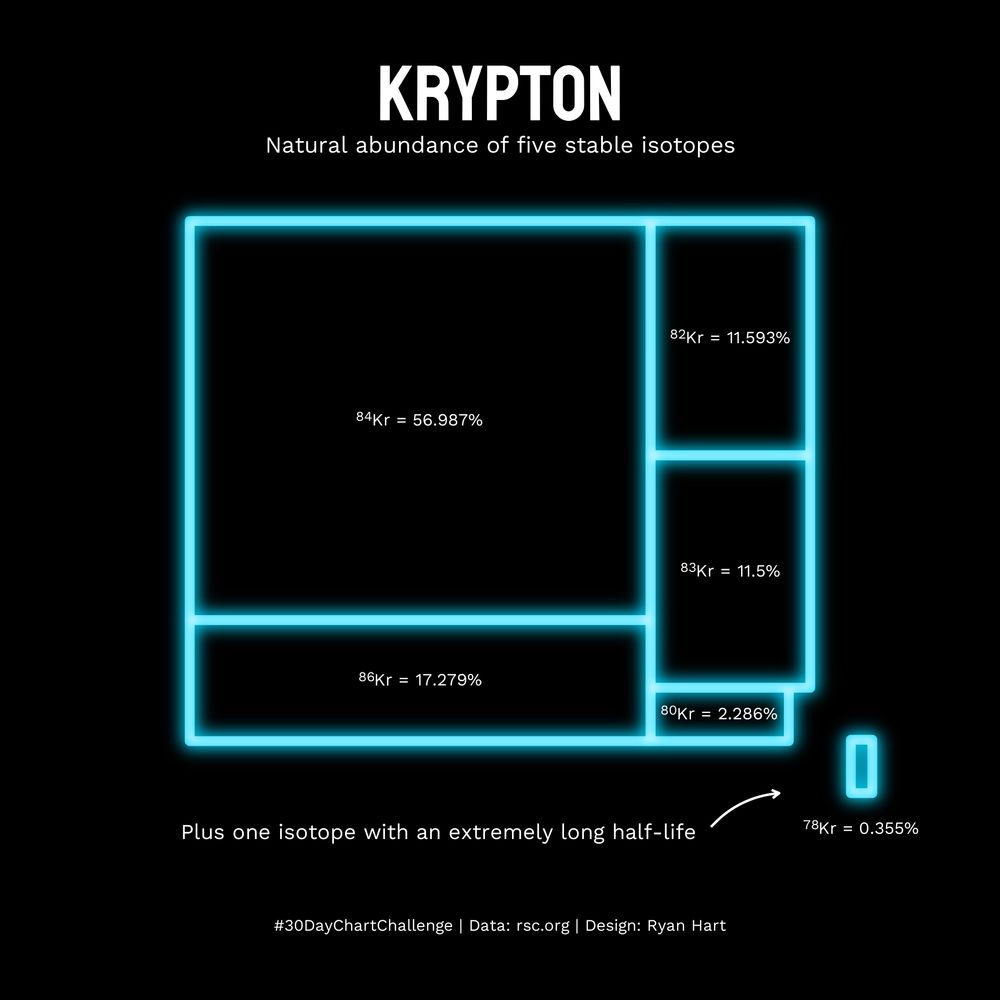
#30DayChartChallenge | April 2024 - Day 2 | neo
a 📊 of the isotopes of Krypton, a rare gas element that can be used to make neo(n) lights
code: github.com/curatedmess/...
#ggplot #rstats #dataviz
a 📊 of the isotopes of Krypton, a rare gas element that can be used to make neo(n) lights
code: github.com/curatedmess/...
#ggplot #rstats #dataviz
April 2, 2024 at 10:39 AM
#30DayChartChallenge | April 2024 - Day 2 | neo
a 📊 of the isotopes of Krypton, a rare gas element that can be used to make neo(n) lights
code: github.com/curatedmess/...
#ggplot #rstats #dataviz
a 📊 of the isotopes of Krypton, a rare gas element that can be used to make neo(n) lights
code: github.com/curatedmess/...
#ggplot #rstats #dataviz
#30DayChartChallenge | April 2024 - Day 1 | part-to-whole
a 📊 about lyrics from the band, Gorillaz
code: github.com/curatedmess/...
#ggplot #rstats #dataviz
a 📊 about lyrics from the band, Gorillaz
code: github.com/curatedmess/...
#ggplot #rstats #dataviz

April 1, 2024 at 10:37 AM
#30DayChartChallenge | April 2024 - Day 1 | part-to-whole
a 📊 about lyrics from the band, Gorillaz
code: github.com/curatedmess/...
#ggplot #rstats #dataviz
a 📊 about lyrics from the band, Gorillaz
code: github.com/curatedmess/...
#ggplot #rstats #dataviz
Reposted by Ryan
11 days left ⏳ until the #30DayChartChallenge kicks off. Are you really prepared? 😁📊📈📉
Here are all the prompts for the 30 days.
More info on Github:
github.com/30DayChartCh...
Let us know if you have any further questions! 🙂
#dataviz
Here are all the prompts for the 30 days.
More info on Github:
github.com/30DayChartCh...
Let us know if you have any further questions! 🙂
#dataviz

March 20, 2024 at 8:27 PM
11 days left ⏳ until the #30DayChartChallenge kicks off. Are you really prepared? 😁📊📈📉
Here are all the prompts for the 30 days.
More info on Github:
github.com/30DayChartCh...
Let us know if you have any further questions! 🙂
#dataviz
Here are all the prompts for the 30 days.
More info on Github:
github.com/30DayChartCh...
Let us know if you have any further questions! 🙂
#dataviz
#TidyTuesday | Week 12 | X-Men Mutant Moneyball
A family of mutants. 📊
code: github.com/curatedmess/...
#rstats #dataviz #r4ds #ggplot2
A family of mutants. 📊
code: github.com/curatedmess/...
#rstats #dataviz #r4ds #ggplot2

March 20, 2024 at 7:42 PM
#TidyTuesday | Week 12 | X-Men Mutant Moneyball
A family of mutants. 📊
code: github.com/curatedmess/...
#rstats #dataviz #r4ds #ggplot2
A family of mutants. 📊
code: github.com/curatedmess/...
#rstats #dataviz #r4ds #ggplot2
100 digits on #PiDay
tried out the new coord_radial() in #ggplot2
code: github.com/curatedmess/...
#rstats #dataviz
tried out the new coord_radial() in #ggplot2
code: github.com/curatedmess/...
#rstats #dataviz

March 15, 2024 at 1:01 AM
100 digits on #PiDay
tried out the new coord_radial() in #ggplot2
code: github.com/curatedmess/...
#rstats #dataviz
tried out the new coord_radial() in #ggplot2
code: github.com/curatedmess/...
#rstats #dataviz