


IAndLoveAndData
@deepsha.bsky.social
Data Scientist | RStats | Observable | knitter by night
#30DayMapChallenge - That’s a wrap folks. These challenges are so helpful to learn new things and most importantly to find that amazing community of support and growth.
@observablehq collection of all plots: observablehq.com/collection/@...
@observablehq collection of all plots: observablehq.com/collection/@...

November 30, 2023 at 6:40 PM
#30DayMapChallenge - That’s a wrap folks. These challenges are so helpful to learn new things and most importantly to find that amazing community of support and growth.
@observablehq collection of all plots: observablehq.com/collection/@...
@observablehq collection of all plots: observablehq.com/collection/@...
Day 30 - #30DayMapChallenge coming to a close with my favorite… the rail network in Europe, so I plotted the densest one!
@observablehq code: observablehq.com/d/3387899f31...
@observablehq code: observablehq.com/d/3387899f31...

November 30, 2023 at 6:14 AM
Day 30 - #30DayMapChallenge coming to a close with my favorite… the rail network in Europe, so I plotted the densest one!
@observablehq code: observablehq.com/d/3387899f31...
@observablehq code: observablehq.com/d/3387899f31...
Day 29 - population #30DayMapChallenge - the stark difference in Washington county land area and population concentration
@observablehq notebook: observablehq.com/d/e862d99f7f...
@observablehq notebook: observablehq.com/d/e862d99f7f...


November 29, 2023 at 5:49 AM
Day 29 - population #30DayMapChallenge - the stark difference in Washington county land area and population concentration
@observablehq notebook: observablehq.com/d/e862d99f7f...
@observablehq notebook: observablehq.com/d/e862d99f7f...
Day 28: chart or map #30DayMapChallenge This right here is the reason I leave for work at 6:30 as after that even 5 min delay in leaving leads to additional 15 min delay in arrival!
@observablehq plot: observablehq.com/d/4649e9509a...
@observablehq plot: observablehq.com/d/4649e9509a...

November 28, 2023 at 6:14 AM
Day 28: chart or map #30DayMapChallenge This right here is the reason I leave for work at 6:30 as after that even 5 min delay in leaving leads to additional 15 min delay in arrival!
@observablehq plot: observablehq.com/d/4649e9509a...
@observablehq plot: observablehq.com/d/4649e9509a...
Day 24: B&W #30DayMapChallenge Washington state, where are the people coming from and leaving to.
@observablehq code: observablehq.com/d/aac5c362ca...
@observablehq code: observablehq.com/d/aac5c362ca...

November 24, 2023 at 5:41 AM
Day 24: B&W #30DayMapChallenge Washington state, where are the people coming from and leaving to.
@observablehq code: observablehq.com/d/aac5c362ca...
@observablehq code: observablehq.com/d/aac5c362ca...
Day 23: 3D #30DayMapChallenge Diamond production across the globe. You can play the animation in the notebook.
@observablehq notebook: observablehq.com/d/f493efcdc8...
@observablehq notebook: observablehq.com/d/f493efcdc8...

November 23, 2023 at 6:21 AM
Day 23: 3D #30DayMapChallenge Diamond production across the globe. You can play the animation in the notebook.
@observablehq notebook: observablehq.com/d/f493efcdc8...
@observablehq notebook: observablehq.com/d/f493efcdc8...
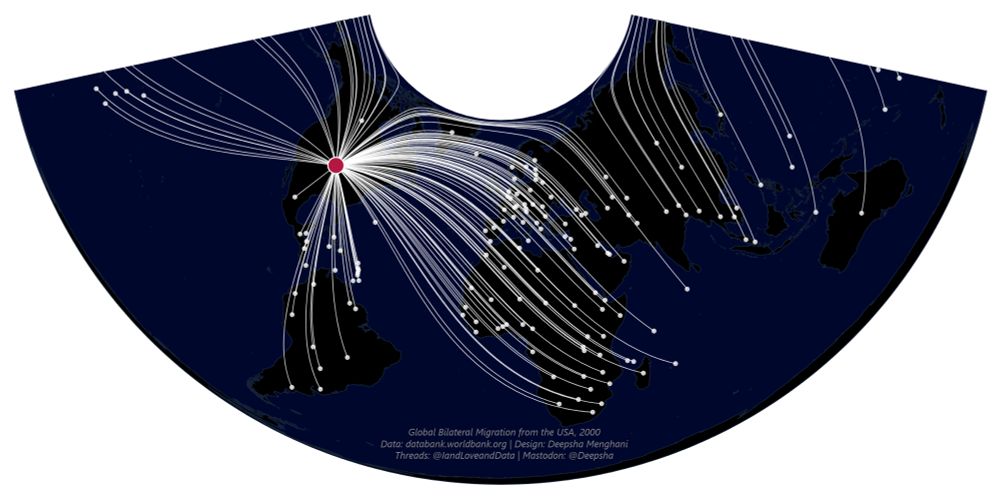
Day 22: North is not always up. Bilateral Migration map of US replicated with a conic equal area projection really tripped me up. But it’s pretty to look at. #30DayMapChallenge
@observablehq notebook: observablehq.com/d/a548d4c4fc...
@observablehq notebook: observablehq.com/d/a548d4c4fc...
November 22, 2023 at 9:38 PM
Day 22: North is not always up. Bilateral Migration map of US replicated with a conic equal area projection really tripped me up. But it’s pretty to look at. #30DayMapChallenge
@observablehq notebook: observablehq.com/d/a548d4c4fc...
@observablehq notebook: observablehq.com/d/a548d4c4fc...
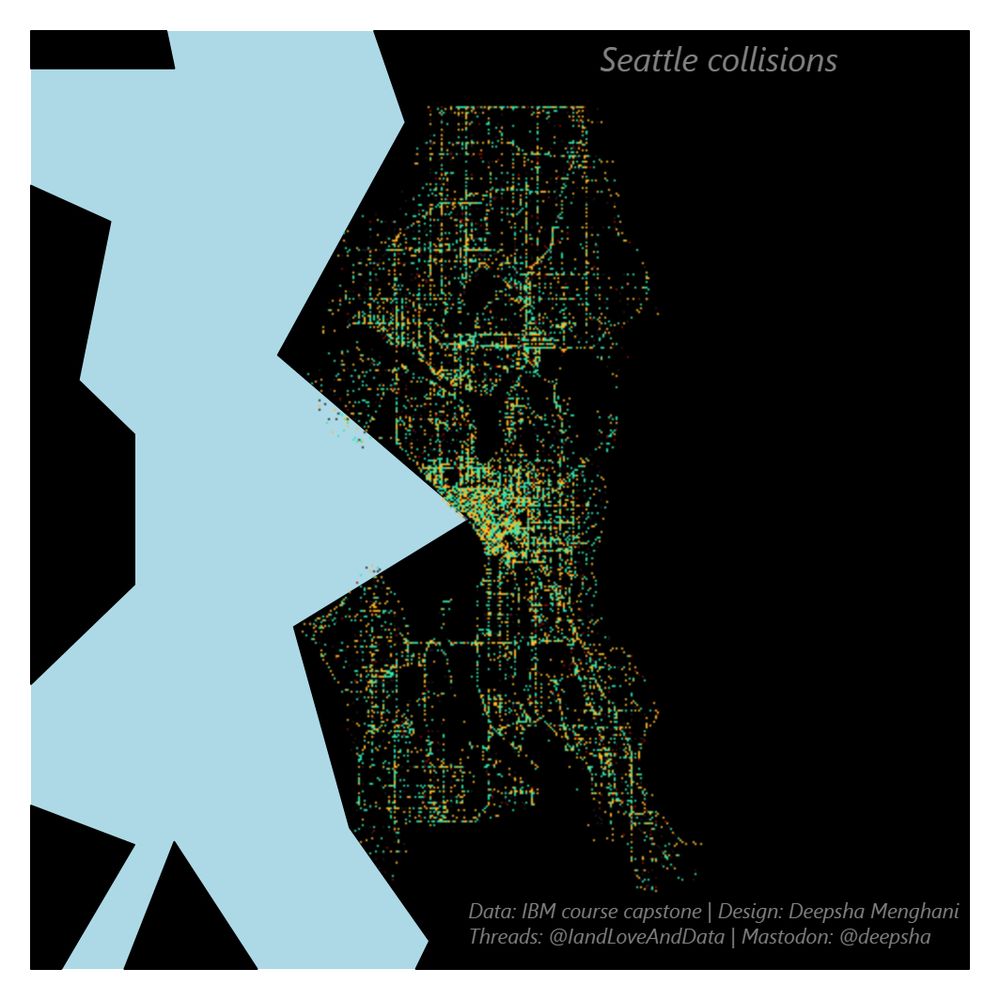
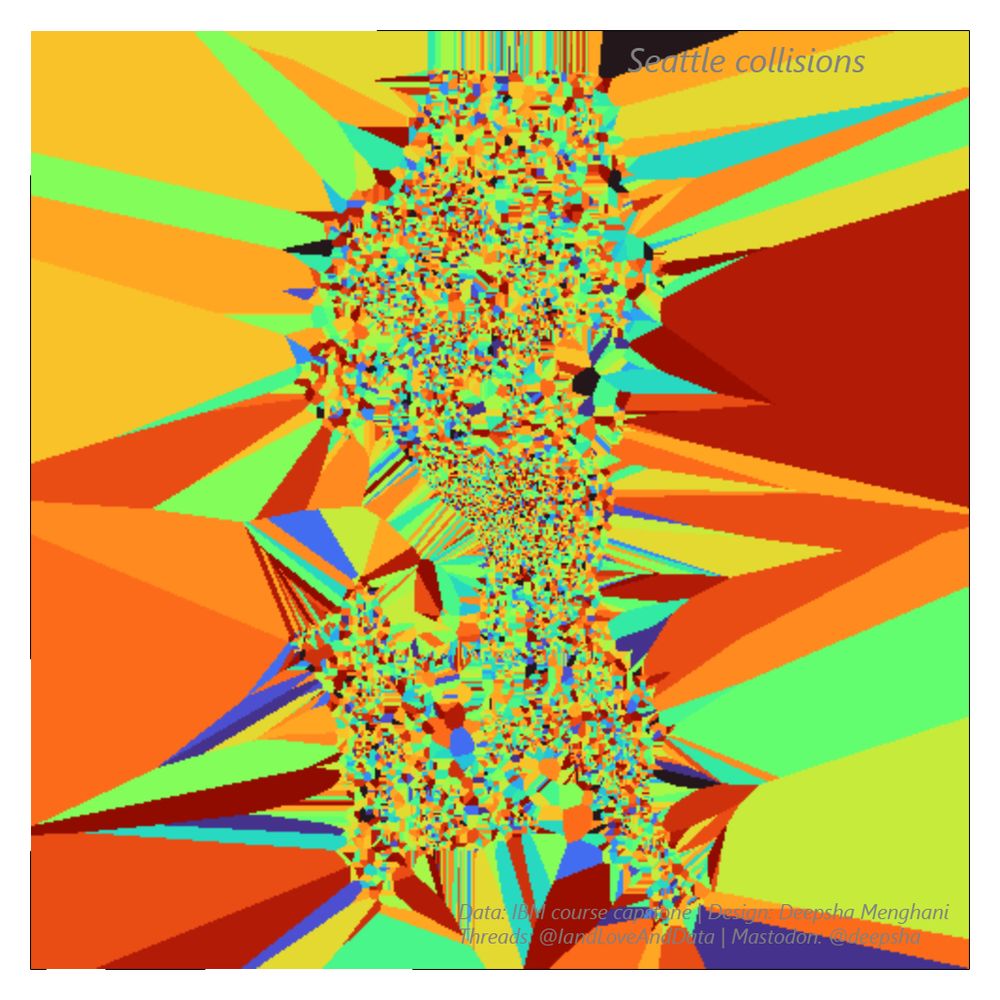
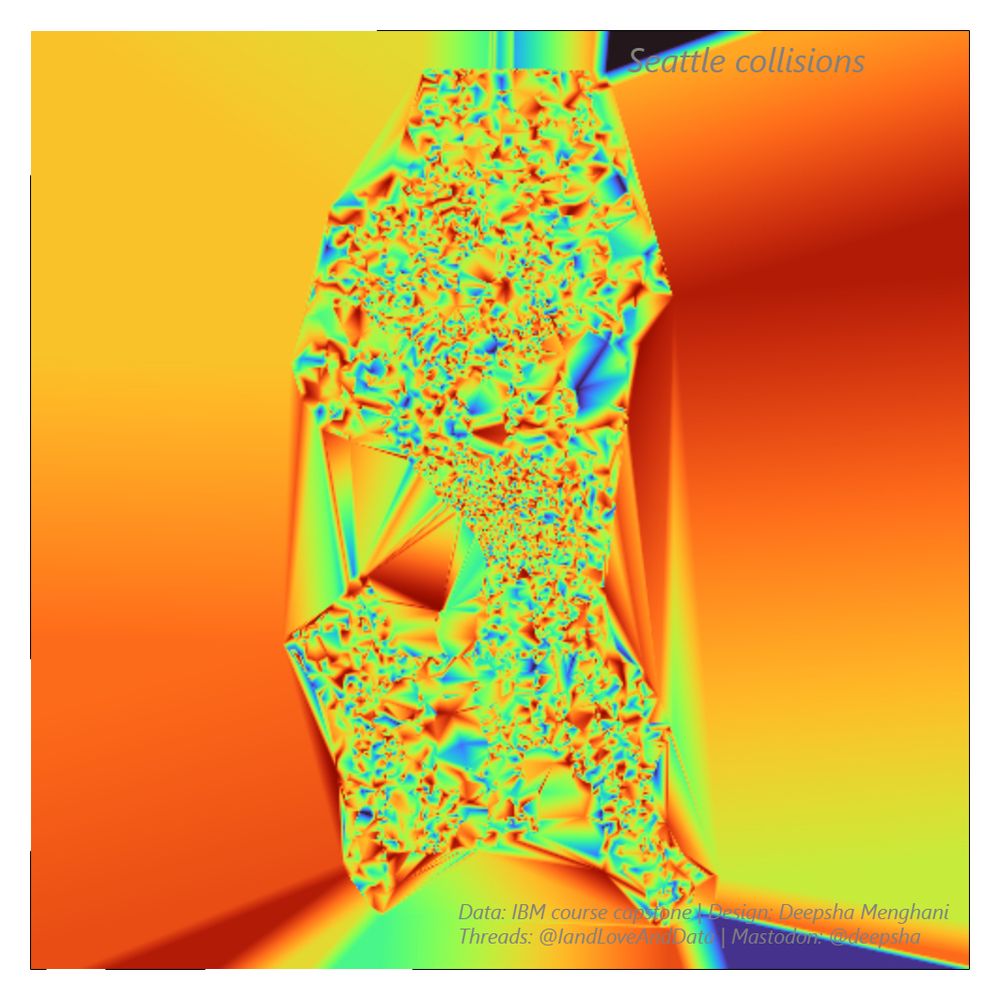
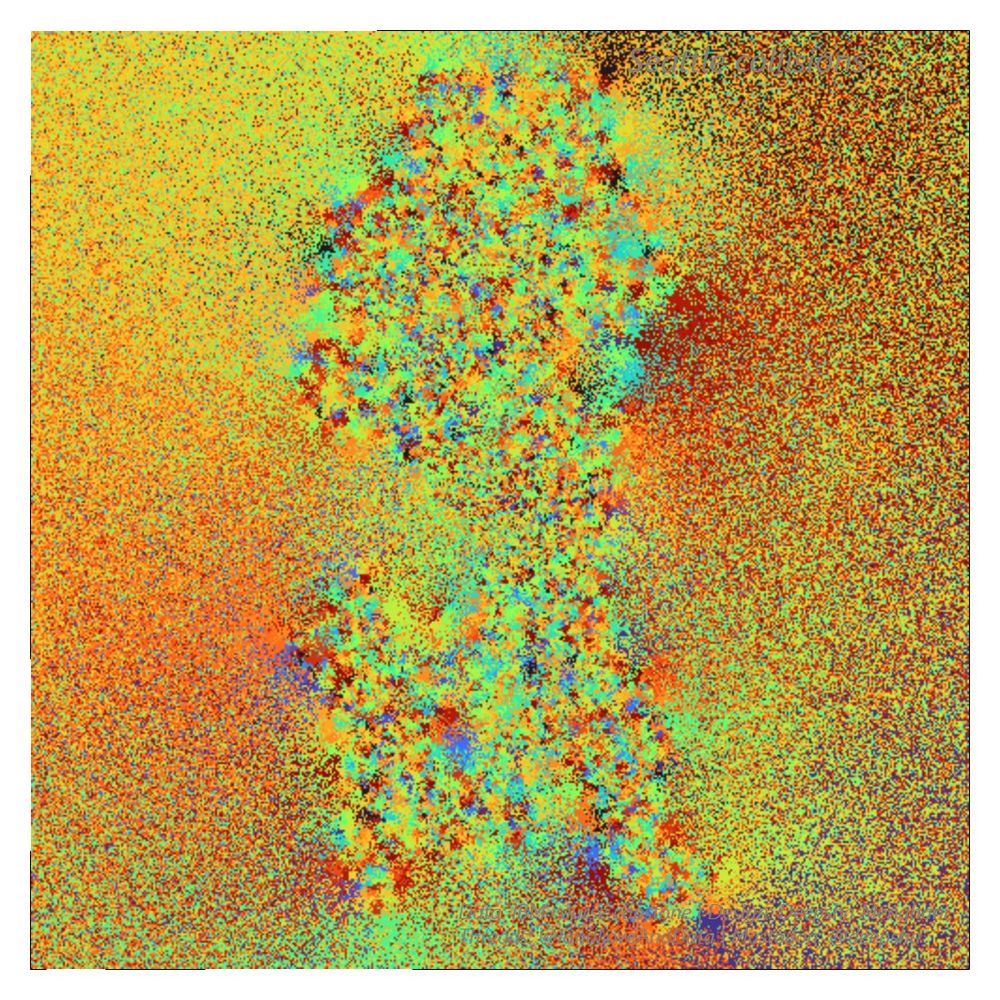
Day 21: Raster - #30DayMapChallenge I made accidental art trying to play with the raster options in @observablehq Plot using Seattle collision data. There is definitely a concentration.
Code: observablehq.com/d/9eff375d45...
Code: observablehq.com/d/9eff375d45...
November 22, 2023 at 4:00 AM
Day 21: Raster - #30DayMapChallenge I made accidental art trying to play with the raster options in @observablehq Plot using Seattle collision data. There is definitely a concentration.
Code: observablehq.com/d/9eff375d45...
Code: observablehq.com/d/9eff375d45...
Day 20 - outdoors #30DayMapChallenge - I learned states in US have state amphibians and Washington’s amphibian - Pacific chorus, was advocated for by fourth graders! You can toggle between the two and hover to see name of amphibian by state.
@observablehq - observablehq.com/d/40a49c6edf...
@observablehq - observablehq.com/d/40a49c6edf...


November 21, 2023 at 4:23 AM
Day 20 - outdoors #30DayMapChallenge - I learned states in US have state amphibians and Washington’s amphibian - Pacific chorus, was advocated for by fourth graders! You can toggle between the two and hover to see name of amphibian by state.
@observablehq - observablehq.com/d/40a49c6edf...
@observablehq - observablehq.com/d/40a49c6edf...
Day 18 - Atmosphere - #30DayMapChallenge
Canada wind turbines show a visible bump around mid 2000s. You can see the animation in the notebook.
@observablehq code: observablehq.com/d/c6f5c06973...
Canada wind turbines show a visible bump around mid 2000s. You can see the animation in the notebook.
@observablehq code: observablehq.com/d/c6f5c06973...

November 18, 2023 at 5:29 PM
Day 18 - Atmosphere - #30DayMapChallenge
Canada wind turbines show a visible bump around mid 2000s. You can see the animation in the notebook.
@observablehq code: observablehq.com/d/c6f5c06973...
Canada wind turbines show a visible bump around mid 2000s. You can see the animation in the notebook.
@observablehq code: observablehq.com/d/c6f5c06973...

November 17, 2023 at 7:23 AM
Day 16 - Oceania - #30DayMapChallenge - where are the numbats! Numbats are unfortunately considered endangered today.
@observablehq notebook: observablehq.com/d/42af72caab...
@observablehq notebook: observablehq.com/d/42af72caab...

November 16, 2023 at 5:28 PM
Day 16 - Oceania - #30DayMapChallenge - where are the numbats! Numbats are unfortunately considered endangered today.
@observablehq notebook: observablehq.com/d/42af72caab...
@observablehq notebook: observablehq.com/d/42af72caab...
Day 14 - Europe, hydro energy distribution with Norway topping the chart.
@observablehq code: observablehq.com/d/9aeb73c82f...
@observablehq code: observablehq.com/d/9aeb73c82f...

November 15, 2023 at 6:36 AM
Day 14 - Europe, hydro energy distribution with Norway topping the chart.
@observablehq code: observablehq.com/d/9aeb73c82f...
@observablehq code: observablehq.com/d/9aeb73c82f...
Day 13 - Choropleth #30DayMapChallenge Political rights in Africa for the year 2020.
@observablehq notebook: observablehq.com/d/6c6d57b119...
This is the notebook that taught me to create this viz with very detailed instructions by Allison Horst and Paul Buffa - observablehq.com/@observableh...
@observablehq notebook: observablehq.com/d/6c6d57b119...
This is the notebook that taught me to create this viz with very detailed instructions by Allison Horst and Paul Buffa - observablehq.com/@observableh...

November 14, 2023 at 4:24 AM
Day 13 - Choropleth #30DayMapChallenge Political rights in Africa for the year 2020.
@observablehq notebook: observablehq.com/d/6c6d57b119...
This is the notebook that taught me to create this viz with very detailed instructions by Allison Horst and Paul Buffa - observablehq.com/@observableh...
@observablehq notebook: observablehq.com/d/6c6d57b119...
This is the notebook that taught me to create this viz with very detailed instructions by Allison Horst and Paul Buffa - observablehq.com/@observableh...
Day 12 South America - #30DayMapChallenge - This is my fav animation created because when I started I didn’t expect it to reveal such a beautiful pattern. Click “play” in the notebook for the animated pattern.
@observablehq code: observablehq.com/d/62f92bdd6e...
@observablehq code: observablehq.com/d/62f92bdd6e...

November 12, 2023 at 7:37 AM
Day 12 South America - #30DayMapChallenge - This is my fav animation created because when I started I didn’t expect it to reveal such a beautiful pattern. Click “play” in the notebook for the animated pattern.
@observablehq code: observablehq.com/d/62f92bdd6e...
@observablehq code: observablehq.com/d/62f92bdd6e...
Day 11 - retro - #30DayMapChallenge mapping a retro theme with a very recent data survey from stackoverflow about developer compensation in Europe.
@observablehq code: observablehq.com/d/28f2d06910...
@observablehq code: observablehq.com/d/28f2d06910...

November 11, 2023 at 7:21 AM
Day 11 - retro - #30DayMapChallenge mapping a retro theme with a very recent data survey from stackoverflow about developer compensation in Europe.
@observablehq code: observablehq.com/d/28f2d06910...
@observablehq code: observablehq.com/d/28f2d06910...
Day 10 - North America - I’ve been wanting to learn to make a US chart map with @observablehq Plot and todays #30DayMapChallenge combined perfectly with this weeks #tidytuesday to make that happen. I couldn’t decide between the two versions though!
Code: observablehq.com/d/f970cc6784...
Code: observablehq.com/d/f970cc6784...


November 10, 2023 at 6:40 AM
Day 10 - North America - I’ve been wanting to learn to make a US chart map with @observablehq Plot and todays #30DayMapChallenge combined perfectly with this weeks #tidytuesday to make that happen. I couldn’t decide between the two versions though!
Code: observablehq.com/d/f970cc6784...
Code: observablehq.com/d/f970cc6784...
Day 9 - hexagons #30DayMapChallenge
The state with the most tornadoes, and the parts of it that have been impacted by them based on frequency of tornadoes in the region of Texas.
@observablehq code: observablehq.com/d/d0f5edf1d6...
The state with the most tornadoes, and the parts of it that have been impacted by them based on frequency of tornadoes in the region of Texas.
@observablehq code: observablehq.com/d/d0f5edf1d6...

November 9, 2023 at 6:23 AM
Day 9 - hexagons #30DayMapChallenge
The state with the most tornadoes, and the parts of it that have been impacted by them based on frequency of tornadoes in the region of Texas.
@observablehq code: observablehq.com/d/d0f5edf1d6...
The state with the most tornadoes, and the parts of it that have been impacted by them based on frequency of tornadoes in the region of Texas.
@observablehq code: observablehq.com/d/d0f5edf1d6...
Day 8 - Africa #30DayMapChallenge - Uganda reported water source locations
Source: @WaterPointData through #tidytuesday
@observablehq notebook: observablehq.com/d/198517ad54...
#DataViz
Source: @WaterPointData through #tidytuesday
@observablehq notebook: observablehq.com/d/198517ad54...
#DataViz

November 8, 2023 at 2:45 PM
Day 8 - Africa #30DayMapChallenge - Uganda reported water source locations
Source: @WaterPointData through #tidytuesday
@observablehq notebook: observablehq.com/d/198517ad54...
#DataViz
Source: @WaterPointData through #tidytuesday
@observablehq notebook: observablehq.com/d/198517ad54...
#DataViz
Day 7 #30DayMapChallenge - Navigation. Bringing back the voronoi network for Amtrak but this time for California, state with the most Amtrak stations.
@observablehq plot: observablehq.com/d/a4762f8e94...
#dataviz #geoviz
@observablehq plot: observablehq.com/d/a4762f8e94...
#dataviz #geoviz

November 7, 2023 at 2:25 PM
Day 7 #30DayMapChallenge - Navigation. Bringing back the voronoi network for Amtrak but this time for California, state with the most Amtrak stations.
@observablehq plot: observablehq.com/d/a4762f8e94...
#dataviz #geoviz
@observablehq plot: observablehq.com/d/a4762f8e94...
#dataviz #geoviz
Day 6 - #30DayMapChallenge - Asia. Happiness index in Southeast Asia.
@observablehq code: observablehq.com/d/c092239732...
source: www.theglobaleconomy.com/rankings/hap...
#Dataviz #javascript #cartography
@observablehq code: observablehq.com/d/c092239732...
source: www.theglobaleconomy.com/rankings/hap...
#Dataviz #javascript #cartography

November 6, 2023 at 4:35 PM
Day 6 - #30DayMapChallenge - Asia. Happiness index in Southeast Asia.
@observablehq code: observablehq.com/d/c092239732...
source: www.theglobaleconomy.com/rankings/hap...
#Dataviz #javascript #cartography
@observablehq code: observablehq.com/d/c092239732...
source: www.theglobaleconomy.com/rankings/hap...
#Dataviz #javascript #cartography
Day 5 - analog - #30DayMapChallenge a fun fact I tell people about where I grew up is that it’s a city in the middle of India that all rail lines pass through and the name translates to snake city 🙂 this is hand drawn by me so excuse the accuracy of lines.
#dataviz
#dataviz

November 5, 2023 at 6:01 PM
Day 5 - analog - #30DayMapChallenge a fun fact I tell people about where I grew up is that it’s a city in the middle of India that all rail lines pass through and the name translates to snake city 🙂 this is hand drawn by me so excuse the accuracy of lines.
#dataviz
#dataviz
Day 4 - #30DayMapChallenge Bad map, aka map of a bad situation. British Columbia wildfires impact is felt in the pacific north west every summer season. Click the code link for animation over the years of where the wildfires are.
@observablehq: observablehq.com/d/97b3d6ad26...
#geospatial #dataviz
@observablehq: observablehq.com/d/97b3d6ad26...
#geospatial #dataviz

November 4, 2023 at 2:42 PM
Day 4 - #30DayMapChallenge Bad map, aka map of a bad situation. British Columbia wildfires impact is felt in the pacific north west every summer season. Click the code link for animation over the years of where the wildfires are.
@observablehq: observablehq.com/d/97b3d6ad26...
#geospatial #dataviz
@observablehq: observablehq.com/d/97b3d6ad26...
#geospatial #dataviz
Day 3 - #30daychartchallenge - Polygons. I learned to make these graphic backgrounds with hexbins in @observablehq , also learned Alameda is one of the most ethnically diverse regions in Bay Area and the nation.
Code observablehq.com/d/4c4a0c14b3...
#dataviz #geoviz #javascript #rstats
Code observablehq.com/d/4c4a0c14b3...
#dataviz #geoviz #javascript #rstats

November 3, 2023 at 4:35 AM
Day 3 - #30daychartchallenge - Polygons. I learned to make these graphic backgrounds with hexbins in @observablehq , also learned Alameda is one of the most ethnically diverse regions in Bay Area and the nation.
Code observablehq.com/d/4c4a0c14b3...
#dataviz #geoviz #javascript #rstats
Code observablehq.com/d/4c4a0c14b3...
#dataviz #geoviz #javascript #rstats
Day 2 - Lines. This was fun because I learned what greenways are.
@observablehq code: observablehq.com/d/01cbfc9a36...
source: catalog.data.gov/dataset/gree...
#dataviz #Datavisualization #geospatial #javascript #rstats
@observablehq code: observablehq.com/d/01cbfc9a36...
source: catalog.data.gov/dataset/gree...
#dataviz #Datavisualization #geospatial #javascript #rstats

November 2, 2023 at 4:21 AM
Day 2 - Lines. This was fun because I learned what greenways are.
@observablehq code: observablehq.com/d/01cbfc9a36...
source: catalog.data.gov/dataset/gree...
#dataviz #Datavisualization #geospatial #javascript #rstats
@observablehq code: observablehq.com/d/01cbfc9a36...
source: catalog.data.gov/dataset/gree...
#dataviz #Datavisualization #geospatial #javascript #rstats