


Jessi Cacioppo
@cacioppoj.bsky.social
Data analyst | Math enthusiast
Reposted by Jessi Cacioppo

🎨 Event Alert: Enhance your ggplot2 Data Visualization Skills! 📅 Join expert Nicola Rennie, author of “The Art of Visualization with ggplot2.” Learn to craft effective R visuals from exploring data to polishing charts. 🗓️ RSVP here: www.meetup.com/rladies-rome... #DataViz #RStats

Developing your data visualisation skills in ggplot2, Tue, Nov 4, 2025, 6:00 PM | Meetup
In this session, we'll be working through the process of developing a visualisation in ggplot2. We'll start with a brand new dataset and create some exploratory plots; sket
www.meetup.com
November 3, 2025 at 8:53 AM
🎨 Event Alert: Enhance your ggplot2 Data Visualization Skills! 📅 Join expert Nicola Rennie, author of “The Art of Visualization with ggplot2.” Learn to craft effective R visuals from exploring data to polishing charts. 🗓️ RSVP here: www.meetup.com/rladies-rome... #DataViz #RStats
Reposted by Jessi Cacioppo

I'll be running a free, online workshop at @rinpharma.bsky.social on Nov 3rd!
If you've never built an #RStats package before, or if you want to learn some tips to make better packages, come along to build a package together! 📦
⏰ 10am EST / 3pm GMT
#RPharma
If you've never built an #RStats package before, or if you want to learn some tips to make better packages, come along to build a package together! 📦
⏰ 10am EST / 3pm GMT
#RPharma

📣 The schedule for R/Pharma Conf 2025 are out!
Register here for Free on the zoom platform : events.zoom.us/ev/Ai-geyS63...
🗓️ ROW : rpharma-2025.sessionize.com/schedule
🗓️ APAC : rpharma-2025.sessionize.com/schedule
Workshops : Nov 3, 4, 7
Talks : Nov 5, 6
rinpharma.com
Register here for Free on the zoom platform : events.zoom.us/ev/Ai-geyS63...
🗓️ ROW : rpharma-2025.sessionize.com/schedule
🗓️ APAC : rpharma-2025.sessionize.com/schedule
Workshops : Nov 3, 4, 7
Talks : Nov 5, 6
rinpharma.com

R/Pharma 2025
events.zoom.us
October 23, 2025 at 9:14 PM
I'll be running a free, online workshop at @rinpharma.bsky.social on Nov 3rd!
If you've never built an #RStats package before, or if you want to learn some tips to make better packages, come along to build a package together! 📦
⏰ 10am EST / 3pm GMT
#RPharma
If you've never built an #RStats package before, or if you want to learn some tips to make better packages, come along to build a package together! 📦
⏰ 10am EST / 3pm GMT
#RPharma
Reposted by Jessi Cacioppo

R-Ladies and its chapters share so many amazing recordings!
Interested in seeing what they are and how to watch them?
🔍 Check out the R-Ladies YouTube Video Feed
🔗 ivelasq.github.io/rladies-vide...
Made with flexdashboard + GitHub Actions!
🧑🏫 Tutorial here: ivelasq.rbind.io/blog/automat...
Interested in seeing what they are and how to watch them?
🔍 Check out the R-Ladies YouTube Video Feed
🔗 ivelasq.github.io/rladies-vide...
Made with flexdashboard + GitHub Actions!
🧑🏫 Tutorial here: ivelasq.rbind.io/blog/automat...

September 24, 2025 at 5:08 PM
R-Ladies and its chapters share so many amazing recordings!
Interested in seeing what they are and how to watch them?
🔍 Check out the R-Ladies YouTube Video Feed
🔗 ivelasq.github.io/rladies-vide...
Made with flexdashboard + GitHub Actions!
🧑🏫 Tutorial here: ivelasq.rbind.io/blog/automat...
Interested in seeing what they are and how to watch them?
🔍 Check out the R-Ladies YouTube Video Feed
🔗 ivelasq.github.io/rladies-vide...
Made with flexdashboard + GitHub Actions!
🧑🏫 Tutorial here: ivelasq.rbind.io/blog/automat...
Reposted by Jessi Cacioppo

Hello #dataBS (& especially #TidyTuesday) fam! I'm trying to organize a thing to help me keep TidyTuesday running smoothly, but first I need to get a bit of a runway. Every week I curate a TT dataset, and it's wearing me down. Please see github.com/rfordatascie... for some ways you can help! #RStats
August 15, 2025 at 11:23 AM
Hello #dataBS (& especially #TidyTuesday) fam! I'm trying to organize a thing to help me keep TidyTuesday running smoothly, but first I need to get a bit of a runway. Every week I curate a TT dataset, and it's wearing me down. Please see github.com/rfordatascie... for some ways you can help! #RStats
Reposted by Jessi Cacioppo
Last but very definitely not least in the #useR2025 ⚡️talks: @vincentab.bsky.social showing us the power of {tinytable}!
IMHO: {gt} is king for fancy reproducible html tables, but {tinytable} should be the go-to for quick formatting and other file formats.
vincentarelbundock.github.io/tinytable/
IMHO: {gt} is king for fancy reproducible html tables, but {tinytable} should be the go-to for quick formatting and other file formats.
vincentarelbundock.github.io/tinytable/

August 10, 2025 at 3:33 PM
Last but very definitely not least in the #useR2025 ⚡️talks: @vincentab.bsky.social showing us the power of {tinytable}!
IMHO: {gt} is king for fancy reproducible html tables, but {tinytable} should be the go-to for quick formatting and other file formats.
vincentarelbundock.github.io/tinytable/
IMHO: {gt} is king for fancy reproducible html tables, but {tinytable} should be the go-to for quick formatting and other file formats.
vincentarelbundock.github.io/tinytable/
Reposted by Jessi Cacioppo
The virtual useR! 2025 event is happening tomorrow (August 1). There's still time to register. Claim your spot, for free, before time runs out!
The program: user2025.r-project.org/program/virt...
Registration: user2025.r-project.org/register
#useR2025 #rstats
The program: user2025.r-project.org/program/virt...
Registration: user2025.r-project.org/register
#useR2025 #rstats
July 31, 2025 at 12:05 PM
The virtual useR! 2025 event is happening tomorrow (August 1). There's still time to register. Claim your spot, for free, before time runs out!
The program: user2025.r-project.org/program/virt...
Registration: user2025.r-project.org/register
#useR2025 #rstats
The program: user2025.r-project.org/program/virt...
Registration: user2025.r-project.org/register
#useR2025 #rstats
Day 30 of the #30DayChartChallenge - National Geographic
IUCN Red List data on species threatened with extinction
Made using #rstats with helpful tips from Albert Rapp on using symbols in the subtitle instead of a legend
www.youtube.com/watch?v=X1gk...
albert-rapp.de/posts/ggplot...
IUCN Red List data on species threatened with extinction
Made using #rstats with helpful tips from Albert Rapp on using symbols in the subtitle instead of a legend
www.youtube.com/watch?v=X1gk...
albert-rapp.de/posts/ggplot...

April 30, 2025 at 11:10 PM
Day 30 of the #30DayChartChallenge - National Geographic
IUCN Red List data on species threatened with extinction
Made using #rstats with helpful tips from Albert Rapp on using symbols in the subtitle instead of a legend
www.youtube.com/watch?v=X1gk...
albert-rapp.de/posts/ggplot...
IUCN Red List data on species threatened with extinction
Made using #rstats with helpful tips from Albert Rapp on using symbols in the subtitle instead of a legend
www.youtube.com/watch?v=X1gk...
albert-rapp.de/posts/ggplot...
Day 22 of the #30DayChartChallenge - Stars 🌟
Daily hours of sunlight ☀️ for places at different latitudes
Made with #rstats {ggHoriPlot} for the horizon plot and {cowplot} to assemble the pieces
Daily hours of sunlight ☀️ for places at different latitudes
Made with #rstats {ggHoriPlot} for the horizon plot and {cowplot} to assemble the pieces
April 23, 2025 at 5:09 AM
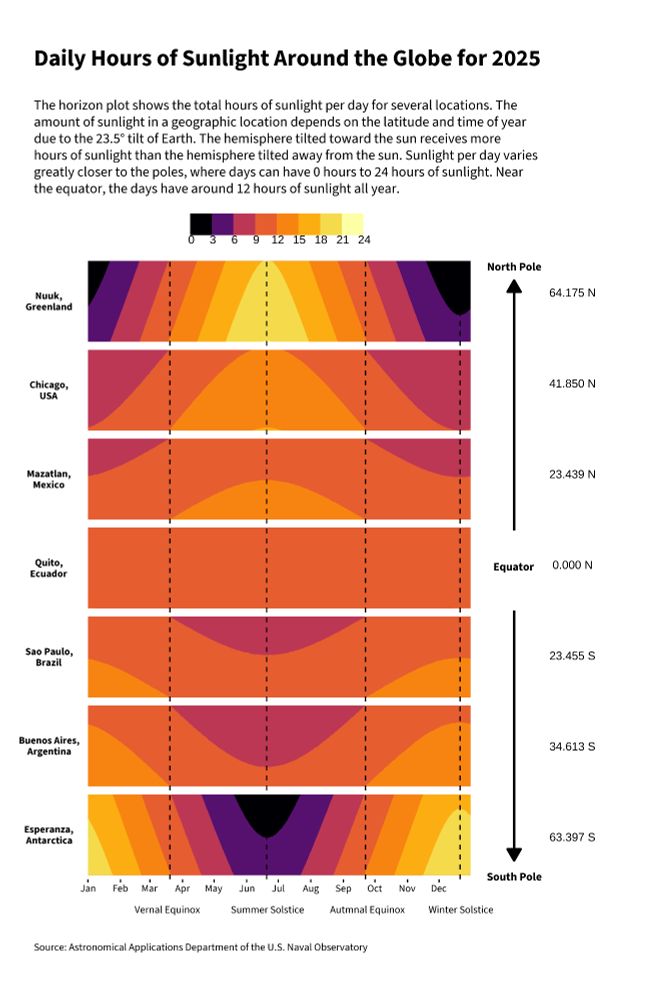
Day 22 of the #30DayChartChallenge - Stars 🌟
Daily hours of sunlight ☀️ for places at different latitudes
Made with #rstats {ggHoriPlot} for the horizon plot and {cowplot} to assemble the pieces
Daily hours of sunlight ☀️ for places at different latitudes
Made with #rstats {ggHoriPlot} for the horizon plot and {cowplot} to assemble the pieces
Day 14 of the #30DayChartChallenge - Kinship
Taxonomic relationship of Missouri native coneflowers
This started out as a quick flowchart in #Rstats until I realized that playing around with coord_polar would make my chart look like an actual coneflower.
Taxonomic relationship of Missouri native coneflowers
This started out as a quick flowchart in #Rstats until I realized that playing around with coord_polar would make my chart look like an actual coneflower.
April 15, 2025 at 5:14 AM
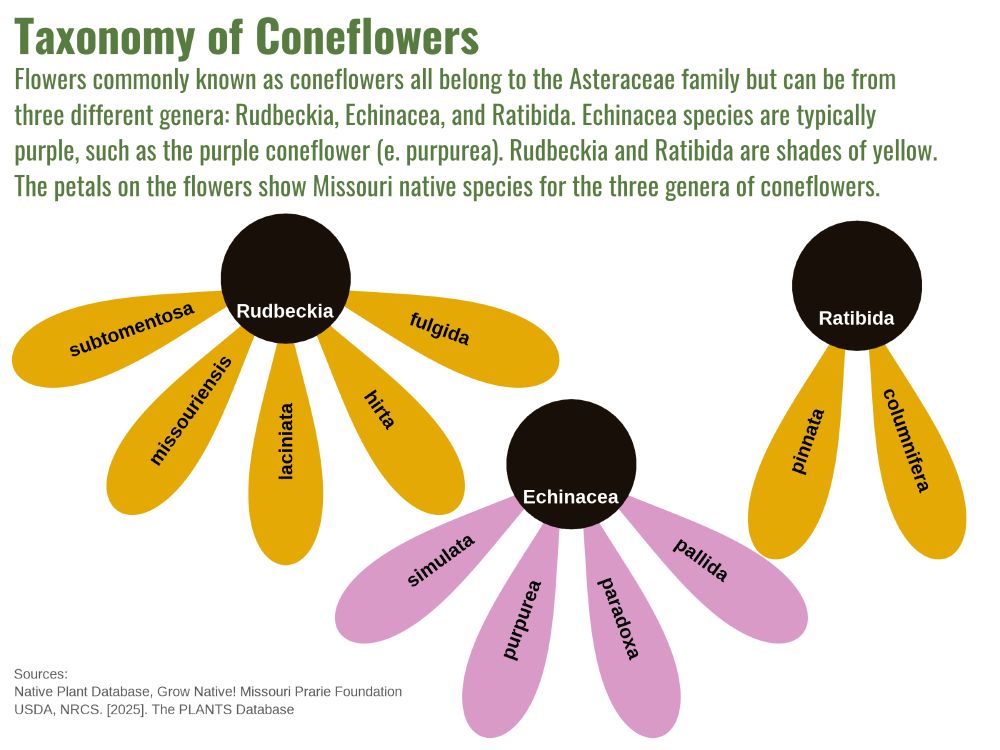
Day 14 of the #30DayChartChallenge - Kinship
Taxonomic relationship of Missouri native coneflowers
This started out as a quick flowchart in #Rstats until I realized that playing around with coord_polar would make my chart look like an actual coneflower.
Taxonomic relationship of Missouri native coneflowers
This started out as a quick flowchart in #Rstats until I realized that playing around with coord_polar would make my chart look like an actual coneflower.
Day 13 of the #30DayChartChallenge - Clusters
Looking at the heights vs spread of Missouri native plants 🌿
I tried out using #rstats {ggh4x} and {cowplot} packages to fill the empty facet with text.
Looking at the heights vs spread of Missouri native plants 🌿
I tried out using #rstats {ggh4x} and {cowplot} packages to fill the empty facet with text.
April 13, 2025 at 8:22 PM
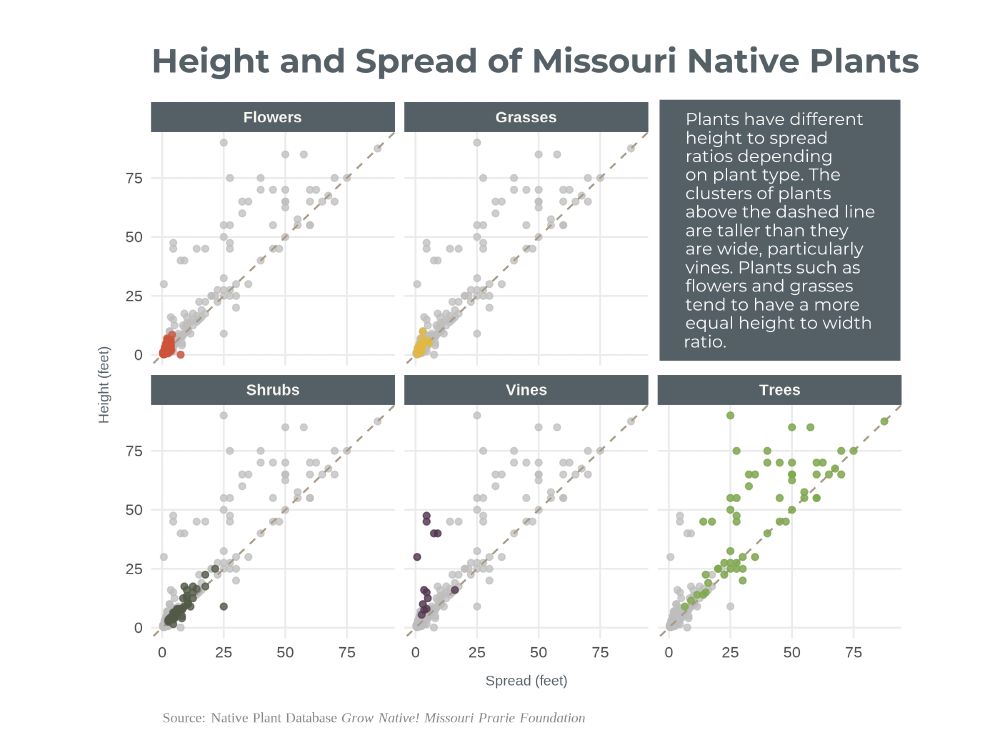
Day 13 of the #30DayChartChallenge - Clusters
Looking at the heights vs spread of Missouri native plants 🌿
I tried out using #rstats {ggh4x} and {cowplot} packages to fill the empty facet with text.
Looking at the heights vs spread of Missouri native plants 🌿
I tried out using #rstats {ggh4x} and {cowplot} packages to fill the empty facet with text.
April 11, 2025 at 2:33 PM
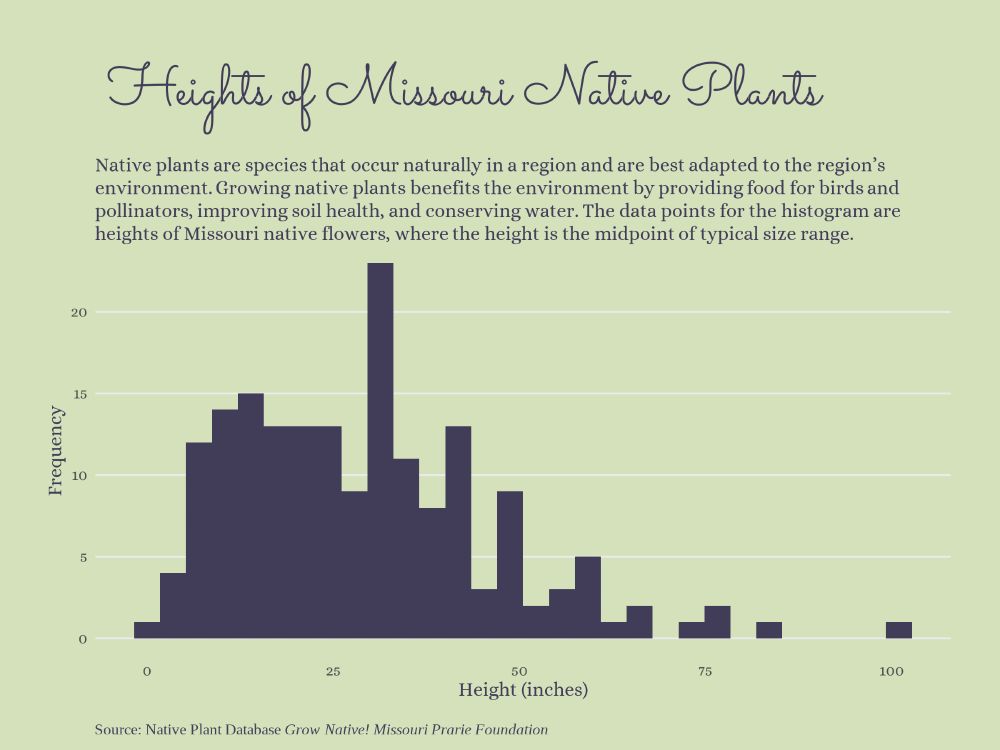
Day 8 of the #30DayChartChallenge - Histogram
April 8, 2025 at 2:48 PM
Day 8 of the #30DayChartChallenge - Histogram
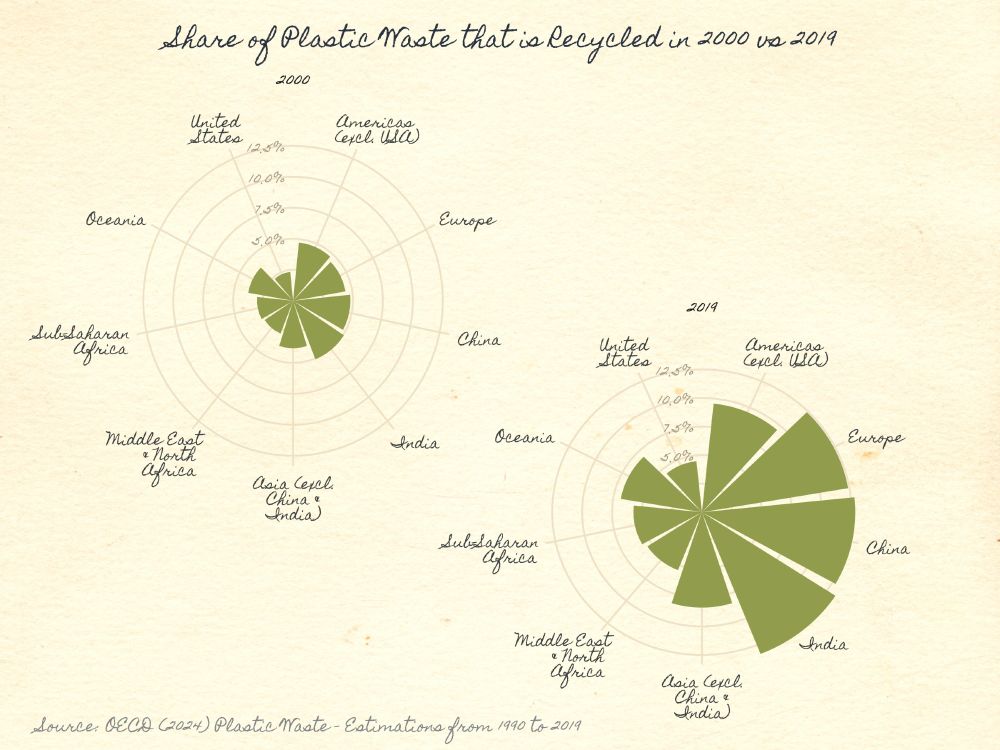
Day 6 of the #30DayChartChallenge Florence Nightingale (theme day)
April 6, 2025 at 5:59 PM
Day 6 of the #30DayChartChallenge Florence Nightingale (theme day)