


Jessica Cacioppo
@cacioppoj.bsky.social
Data analyst | Math enthusiast
Day 30 of the #30DayChartChallenge - National Geographic
IUCN Red List data on species threatened with extinction
Made using #rstats with helpful tips from Albert Rapp on using symbols in the subtitle instead of a legend
www.youtube.com/watch?v=X1gk...
albert-rapp.de/posts/ggplot...
IUCN Red List data on species threatened with extinction
Made using #rstats with helpful tips from Albert Rapp on using symbols in the subtitle instead of a legend
www.youtube.com/watch?v=X1gk...
albert-rapp.de/posts/ggplot...

April 30, 2025 at 11:10 PM
Day 30 of the #30DayChartChallenge - National Geographic
IUCN Red List data on species threatened with extinction
Made using #rstats with helpful tips from Albert Rapp on using symbols in the subtitle instead of a legend
www.youtube.com/watch?v=X1gk...
albert-rapp.de/posts/ggplot...
IUCN Red List data on species threatened with extinction
Made using #rstats with helpful tips from Albert Rapp on using symbols in the subtitle instead of a legend
www.youtube.com/watch?v=X1gk...
albert-rapp.de/posts/ggplot...
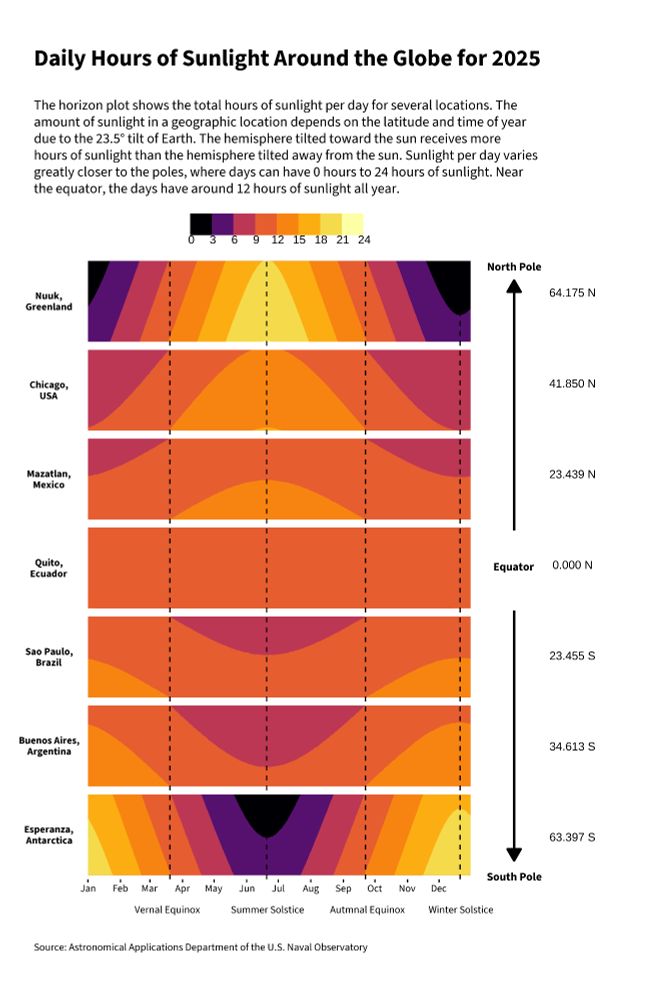
Day 22 of the #30DayChartChallenge - Stars 🌟
Daily hours of sunlight ☀️ for places at different latitudes
Made with #rstats {ggHoriPlot} for the horizon plot and {cowplot} to assemble the pieces
Daily hours of sunlight ☀️ for places at different latitudes
Made with #rstats {ggHoriPlot} for the horizon plot and {cowplot} to assemble the pieces
April 23, 2025 at 5:09 AM
Day 22 of the #30DayChartChallenge - Stars 🌟
Daily hours of sunlight ☀️ for places at different latitudes
Made with #rstats {ggHoriPlot} for the horizon plot and {cowplot} to assemble the pieces
Daily hours of sunlight ☀️ for places at different latitudes
Made with #rstats {ggHoriPlot} for the horizon plot and {cowplot} to assemble the pieces
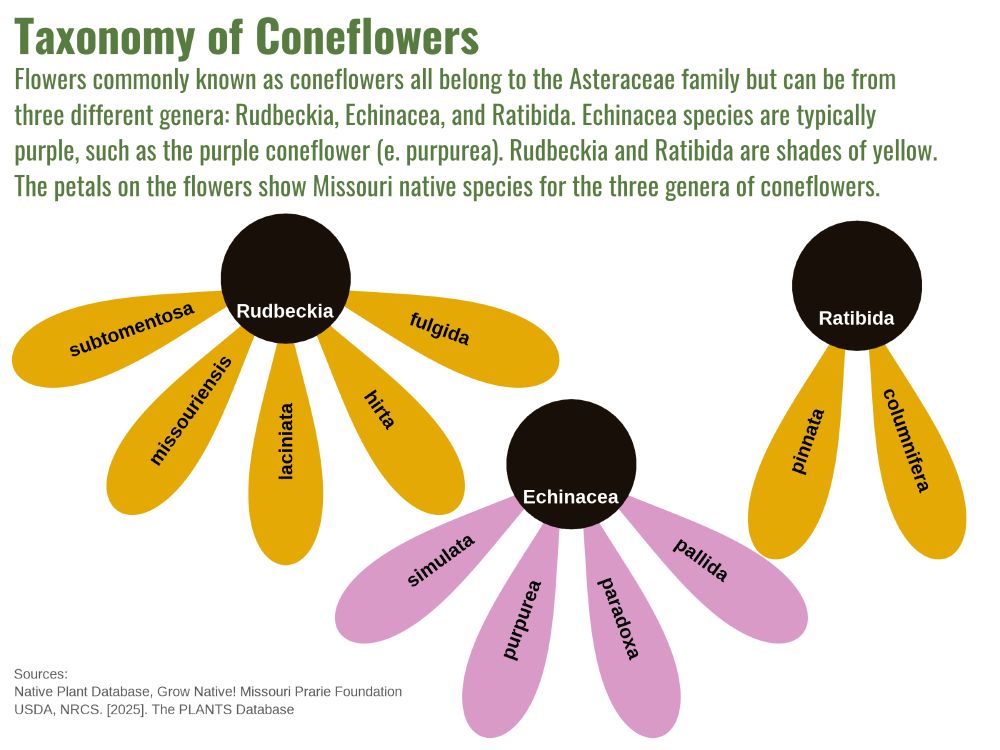
Day 14 of the #30DayChartChallenge - Kinship
Taxonomic relationship of Missouri native coneflowers
This started out as a quick flowchart in #Rstats until I realized that playing around with coord_polar would make my chart look like an actual coneflower.
Taxonomic relationship of Missouri native coneflowers
This started out as a quick flowchart in #Rstats until I realized that playing around with coord_polar would make my chart look like an actual coneflower.
April 15, 2025 at 5:14 AM
Day 14 of the #30DayChartChallenge - Kinship
Taxonomic relationship of Missouri native coneflowers
This started out as a quick flowchart in #Rstats until I realized that playing around with coord_polar would make my chart look like an actual coneflower.
Taxonomic relationship of Missouri native coneflowers
This started out as a quick flowchart in #Rstats until I realized that playing around with coord_polar would make my chart look like an actual coneflower.
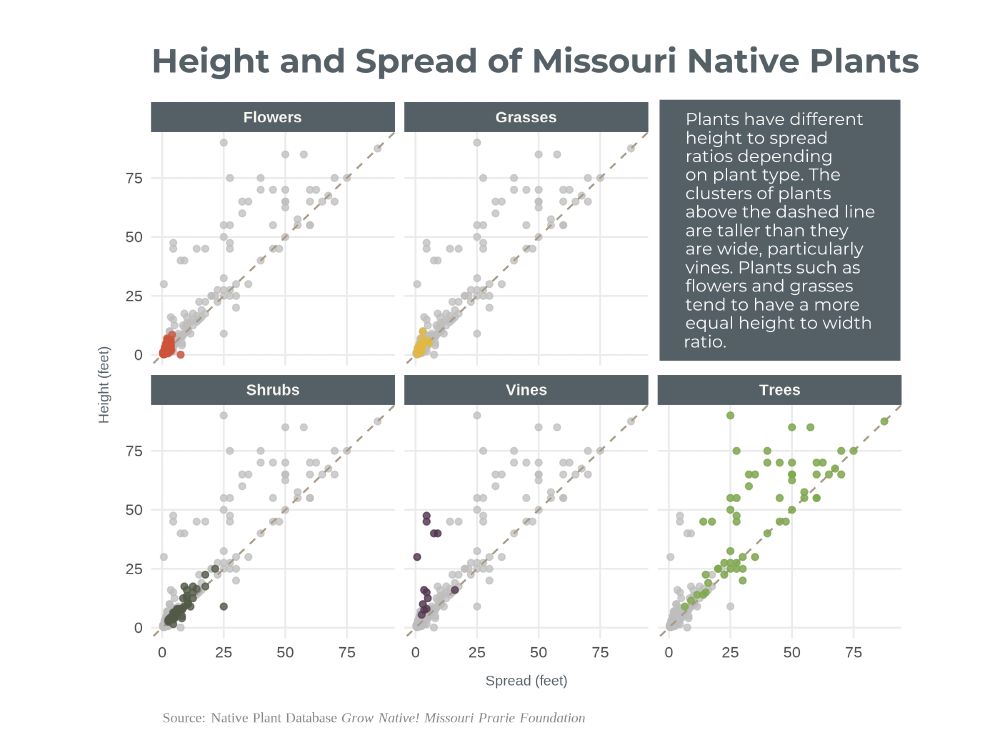
Day 13 of the #30DayChartChallenge - Clusters
Looking at the heights vs spread of Missouri native plants 🌿
I tried out using #rstats {ggh4x} and {cowplot} packages to fill the empty facet with text.
Looking at the heights vs spread of Missouri native plants 🌿
I tried out using #rstats {ggh4x} and {cowplot} packages to fill the empty facet with text.
April 13, 2025 at 8:22 PM
Day 13 of the #30DayChartChallenge - Clusters
Looking at the heights vs spread of Missouri native plants 🌿
I tried out using #rstats {ggh4x} and {cowplot} packages to fill the empty facet with text.
Looking at the heights vs spread of Missouri native plants 🌿
I tried out using #rstats {ggh4x} and {cowplot} packages to fill the empty facet with text.
April 11, 2025 at 2:33 PM
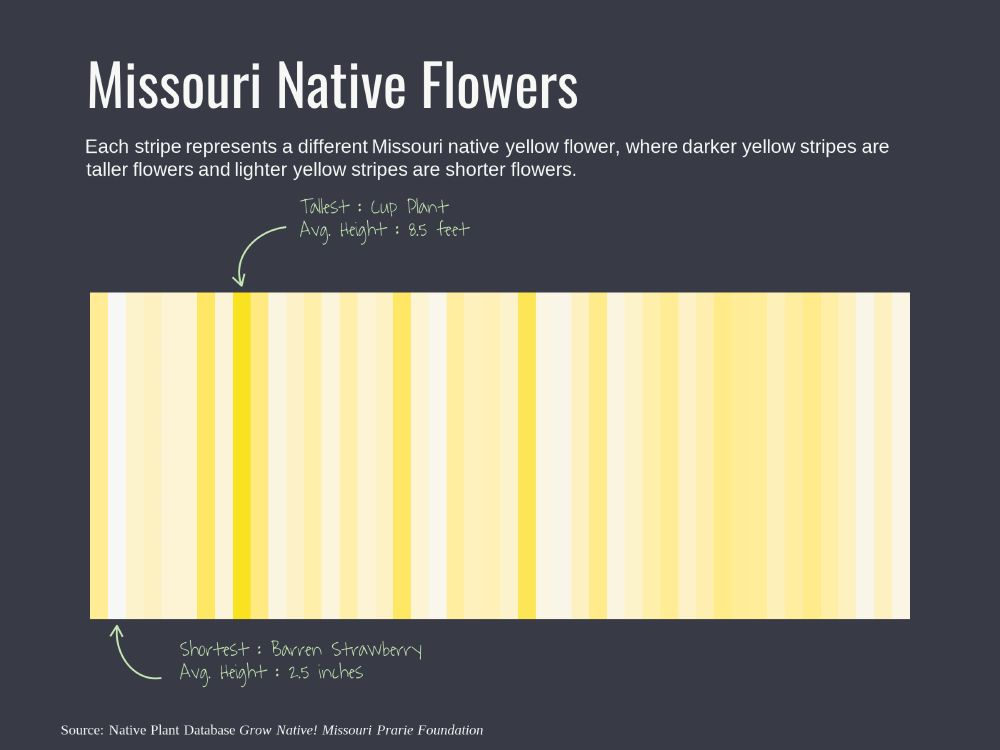
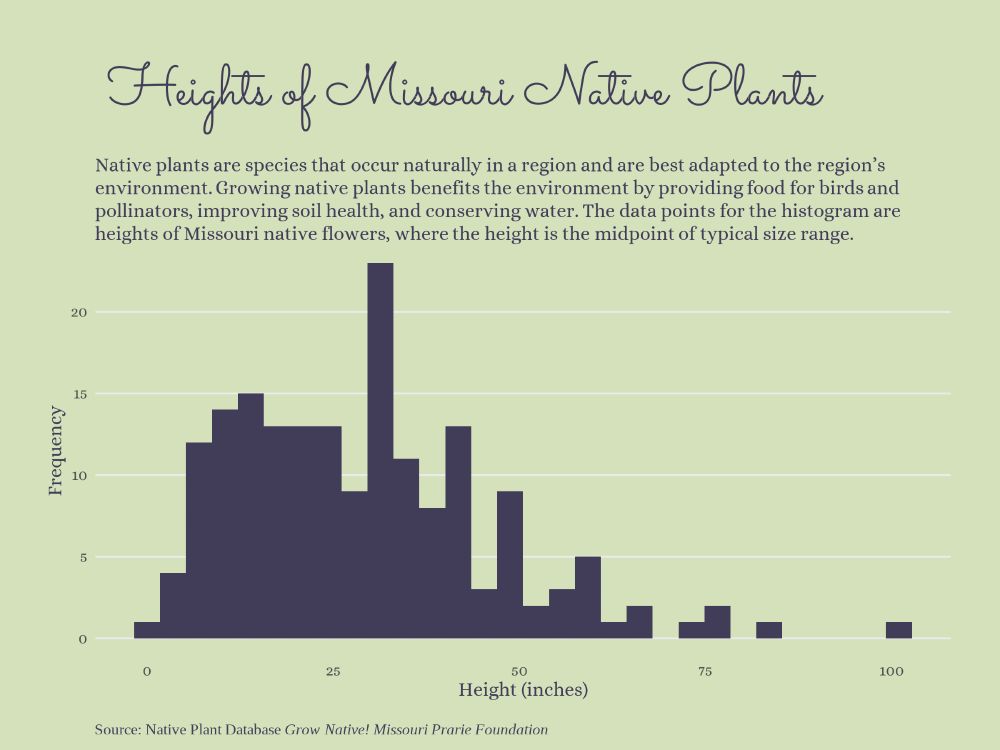
Day 8 of the #30DayChartChallenge - Histogram
April 8, 2025 at 2:48 PM
Day 8 of the #30DayChartChallenge - Histogram
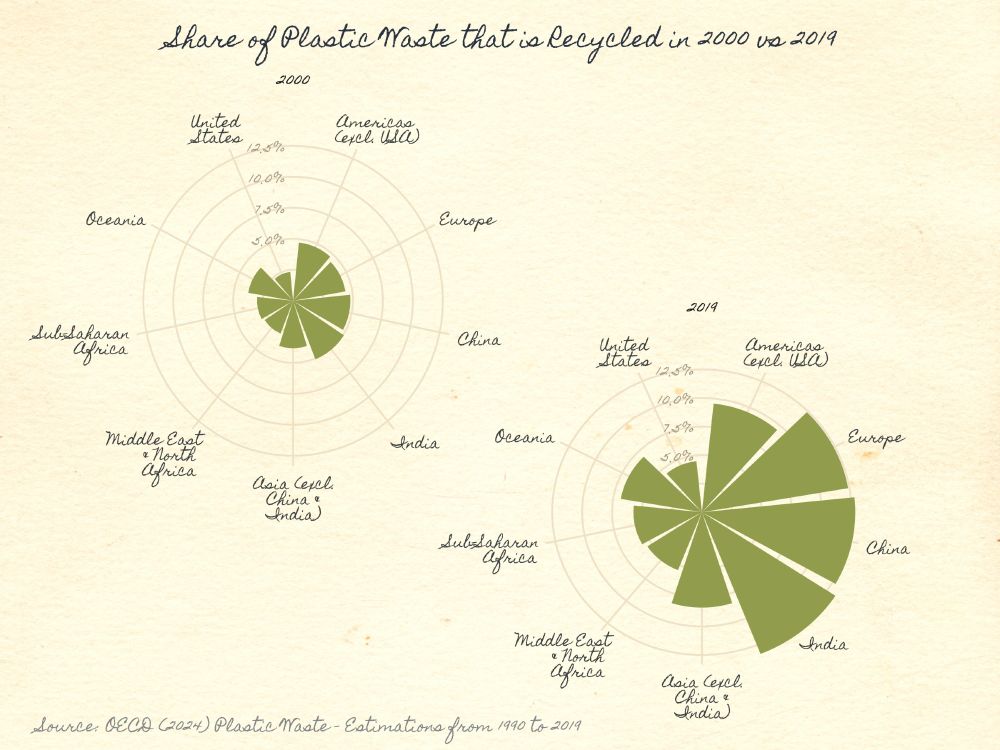
Day 6 of the #30DayChartChallenge Florence Nightingale (theme day)
April 6, 2025 at 5:59 PM
Day 6 of the #30DayChartChallenge Florence Nightingale (theme day)