


STAT OF THE DAY 📊
Saudi Arabia’s population in 2024 is estimated at 35.3 million 🇸🇦
Data from the General Authority for Statistics highlights ongoing growth across major cities like Riyadh and Jeddah.
#LSEStatistics #StatOfTheDay #SaudiArabia #Population #DataStory #LSE
Saudi Arabia’s population in 2024 is estimated at 35.3 million 🇸🇦
Data from the General Authority for Statistics highlights ongoing growth across major cities like Riyadh and Jeddah.
#LSEStatistics #StatOfTheDay #SaudiArabia #Population #DataStory #LSE

November 7, 2025 at 9:58 AM
STAT OF THE DAY 📊
Saudi Arabia’s population in 2024 is estimated at 35.3 million 🇸🇦
Data from the General Authority for Statistics highlights ongoing growth across major cities like Riyadh and Jeddah.
#LSEStatistics #StatOfTheDay #SaudiArabia #Population #DataStory #LSE
Saudi Arabia’s population in 2024 is estimated at 35.3 million 🇸🇦
Data from the General Authority for Statistics highlights ongoing growth across major cities like Riyadh and Jeddah.
#LSEStatistics #StatOfTheDay #SaudiArabia #Population #DataStory #LSE

How can SNSF datasets be combined to explore the research question of your choice?💡
Our latest #DataStory demonstrates how to join our open datasets, in this case to identify the share of grants with different types of research output.📊
Read the full story here 👉 https://sohub.io/8e6a
Our latest #DataStory demonstrates how to join our open datasets, in this case to identify the share of grants with different types of research output.📊
Read the full story here 👉 https://sohub.io/8e6a

October 23, 2025 at 8:01 AM
How can SNSF datasets be combined to explore the research question of your choice?💡
Our latest #DataStory demonstrates how to join our open datasets, in this case to identify the share of grants with different types of research output.📊
Read the full story here 👉 https://sohub.io/8e6a
Our latest #DataStory demonstrates how to join our open datasets, in this case to identify the share of grants with different types of research output.📊
Read the full story here 👉 https://sohub.io/8e6a

Beantworten Sie mit kombinierten SNF-Datensätzen Ihre persönliche Forschungsfrage!💡
In der aktuellen #DataStory zeigen wir, wie Sie mit unseren Open Data den Anteil von Projekten nach Art des Forschungsoutputs berechnen.📊
Zur ganzen Datengeschichte 👉 https://sohub.io/ap84
In der aktuellen #DataStory zeigen wir, wie Sie mit unseren Open Data den Anteil von Projekten nach Art des Forschungsoutputs berechnen.📊
Zur ganzen Datengeschichte 👉 https://sohub.io/ap84

October 23, 2025 at 8:01 AM
Beantworten Sie mit kombinierten SNF-Datensätzen Ihre persönliche Forschungsfrage!💡
In der aktuellen #DataStory zeigen wir, wie Sie mit unseren Open Data den Anteil von Projekten nach Art des Forschungsoutputs berechnen.📊
Zur ganzen Datengeschichte 👉 https://sohub.io/ap84
In der aktuellen #DataStory zeigen wir, wie Sie mit unseren Open Data den Anteil von Projekten nach Art des Forschungsoutputs berechnen.📊
Zur ganzen Datengeschichte 👉 https://sohub.io/ap84

Feed: "MIT Sloan Management Review"
By: Nancy Duarte. Nancy Duarte is CEO of Duarte Inc., a communication company in the Silicon Valley. She’s the author of six books, including DataStory: Explain Data and Inspire Action Through Story (Ideapress Publishing, 2019). on Monday, July 28, 2025
By: Nancy Duarte. Nancy Duarte is CEO of Duarte Inc., a communication company in the Silicon Valley. She’s the author of six books, including DataStory: Explain Data and Inspire Action Through Story (Ideapress Publishing, 2019). on Monday, July 28, 2025

Owning the Room in the Age of AI
Establishing real human connection and trust with today’s audiences takes intense preparation, regardless of the medium.
sloanreview.mit.edu
July 28, 2025 at 11:32 PM
Feed: "MIT Sloan Management Review"
By: Nancy Duarte. Nancy Duarte is CEO of Duarte Inc., a communication company in the Silicon Valley. She’s the author of six books, including DataStory: Explain Data and Inspire Action Through Story (Ideapress Publishing, 2019). on Monday, July 28, 2025
By: Nancy Duarte. Nancy Duarte is CEO of Duarte Inc., a communication company in the Silicon Valley. She’s the author of six books, including DataStory: Explain Data and Inspire Action Through Story (Ideapress Publishing, 2019). on Monday, July 28, 2025
How much of SNSF-funded research is related to artificial intelligence? 🧠💻
Our latest #DataStory explores this question by quantifying its usage and illustrating the different #AI methods applied in grants awarded by the SNSF over the last 14 years.
Read the full story here 👉 sohub.io/64ju
Our latest #DataStory explores this question by quantifying its usage and illustrating the different #AI methods applied in grants awarded by the SNSF over the last 14 years.
Read the full story here 👉 sohub.io/64ju


July 17, 2025 at 12:03 PM
How much of SNSF-funded research is related to artificial intelligence? 🧠💻
Our latest #DataStory explores this question by quantifying its usage and illustrating the different #AI methods applied in grants awarded by the SNSF over the last 14 years.
Read the full story here 👉 sohub.io/64ju
Our latest #DataStory explores this question by quantifying its usage and illustrating the different #AI methods applied in grants awarded by the SNSF over the last 14 years.
Read the full story here 👉 sohub.io/64ju

What powers a country says everything.
🇧🇷 Brazil = hydro
🇩🇰 Denmark = wind
🇫🇷 France = nuclear
🇯🇵 Japan = post-Fukushima pivot
🇺🇸 U.S. = gas + renewables rising
Every graph is a story of geography, crisis, and ambition.
#CleanEnergy #DataStory
🇧🇷 Brazil = hydro
🇩🇰 Denmark = wind
🇫🇷 France = nuclear
🇯🇵 Japan = post-Fukushima pivot
🇺🇸 U.S. = gas + renewables rising
Every graph is a story of geography, crisis, and ambition.
#CleanEnergy #DataStory


May 27, 2025 at 8:10 PM
What powers a country says everything.
🇧🇷 Brazil = hydro
🇩🇰 Denmark = wind
🇫🇷 France = nuclear
🇯🇵 Japan = post-Fukushima pivot
🇺🇸 U.S. = gas + renewables rising
Every graph is a story of geography, crisis, and ambition.
#CleanEnergy #DataStory
🇧🇷 Brazil = hydro
🇩🇰 Denmark = wind
🇫🇷 France = nuclear
🇯🇵 Japan = post-Fukushima pivot
🇺🇸 U.S. = gas + renewables rising
Every graph is a story of geography, crisis, and ambition.
#CleanEnergy #DataStory

We just dropped our fourth and final part in the 4-part series on building a data story to predict the Stanley Cup winner.
#datastory #sportsanalytics #dataviz #datascience #nhl #sports #storytelling #datastories
www.datapunk.media/the-final-po...
#datastory #sportsanalytics #dataviz #datascience #nhl #sports #storytelling #datastories
www.datapunk.media/the-final-po...

The Final Content: "Predicting Who Will Win the Cup"
This is the final post in a four-part series that explores how to create a data story that predicts who will win the Stanley Cup.
www.datapunk.media
May 25, 2025 at 5:50 PM
We just dropped our fourth and final part in the 4-part series on building a data story to predict the Stanley Cup winner.
#datastory #sportsanalytics #dataviz #datascience #nhl #sports #storytelling #datastories
www.datapunk.media/the-final-po...
#datastory #sportsanalytics #dataviz #datascience #nhl #sports #storytelling #datastories
www.datapunk.media/the-final-po...
Feed: "MIT Sloan Management Review"
By: Nancy Duarte. Nancy Duarte is CEO of Duarte Inc., a communication company in the Silicon Valley. She’s the author of six books, including DataStory: Explain Data and Inspire Action Through Story (Ideapress Publishing, 2019). on Wednesday, May 14, 2025
By: Nancy Duarte. Nancy Duarte is CEO of Duarte Inc., a communication company in the Silicon Valley. She’s the author of six books, including DataStory: Explain Data and Inspire Action Through Story (Ideapress Publishing, 2019). on Wednesday, May 14, 2025

What GenAI Tools Can and Can’t Do for Presentations
Generative AI tools don’t bring strategic message design, creative judgment, or empathy to presentations. Only humans do.
sloanreview.mit.edu
May 15, 2025 at 6:30 PM
Feed: "MIT Sloan Management Review"
By: Nancy Duarte. Nancy Duarte is CEO of Duarte Inc., a communication company in the Silicon Valley. She’s the author of six books, including DataStory: Explain Data and Inspire Action Through Story (Ideapress Publishing, 2019). on Wednesday, May 14, 2025
By: Nancy Duarte. Nancy Duarte is CEO of Duarte Inc., a communication company in the Silicon Valley. She’s the author of six books, including DataStory: Explain Data and Inspire Action Through Story (Ideapress Publishing, 2019). on Wednesday, May 14, 2025

The CSU Student Success Network (@csustudentsuccess.bsky.social ) MLA provided tools as our CSUN team developed our proposal to better support Exploratory (undeclared) students to find a major. There are so many committed leaders in the CSU. #studentsuccess, #datastory, #teamwork, #leadership, #CSU
April 21, 2025 at 10:25 PM
The CSU Student Success Network (@csustudentsuccess.bsky.social ) MLA provided tools as our CSUN team developed our proposal to better support Exploratory (undeclared) students to find a major. There are so many committed leaders in the CSU. #studentsuccess, #datastory, #teamwork, #leadership, #CSU
Analyzed your data and want to turn it into a data story? Check out our latest YouTube video in our Data Storytelling for sports series: youtu.be/nw_KA8MdE8M. #datastorytelling #datastory #sportsanalytics #dataviz #sportsdatastories

How To Design A Winning Sports Data Story Using Key Ingredients
YouTube video by Data Punk
youtu.be
March 9, 2025 at 2:16 PM
Analyzed your data and want to turn it into a data story? Check out our latest YouTube video in our Data Storytelling for sports series: youtu.be/nw_KA8MdE8M. #datastorytelling #datastory #sportsanalytics #dataviz #sportsdatastories
Analyzed your data and want to turn it into a data story? Check out our latest in our Data Storytelling for sports series: www.datapunk.media/developing-y... #datastorytelling #datastory #sportsanalytics #dataviz

Developing Your Narrative & Analysis into a Data Story
This is the fourth newsletter in our series entitled Data Storytelling for Sports, which focuses on developing your data story.
www.datapunk.media
March 9, 2025 at 2:14 PM
Analyzed your data and want to turn it into a data story? Check out our latest in our Data Storytelling for sports series: www.datapunk.media/developing-y... #datastorytelling #datastory #sportsanalytics #dataviz
We've published our third lesson in our email course on "Data Storytelling for Sports." Subscribe for free and check it out! #data #datastorytelling #sportsanalytics #dataviz #datapunk #sports #datastory www.datapunkhockey.com/lesson-3-dat...

Lesson 3: Data Analysis & Modeling
This is our third lesson in our email course on Data Storytelling for Sports.
www.datapunkhockey.com
March 2, 2025 at 7:35 PM
We've published our third lesson in our email course on "Data Storytelling for Sports." Subscribe for free and check it out! #data #datastorytelling #sportsanalytics #dataviz #datapunk #sports #datastory www.datapunkhockey.com/lesson-3-dat...

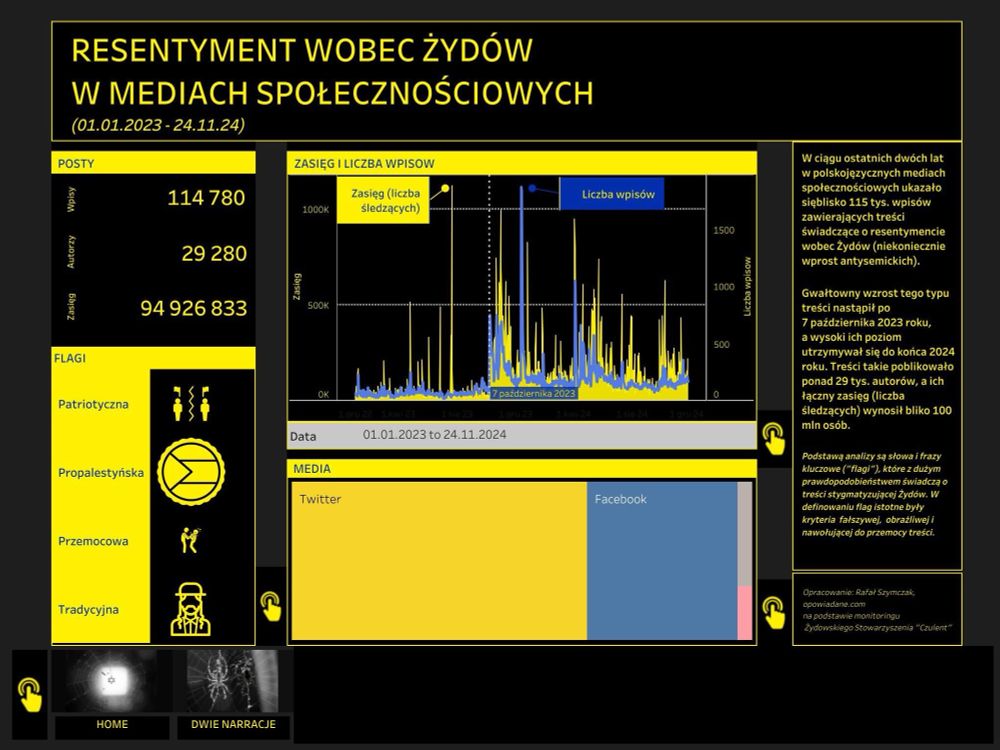
Anti-jewish sentiment in Polish social media 2023-24 (part I)
#datastory #dataviz #antisemitism #Poland #socialmedia #Tableau
public.tableau.com/views/Resent...
#datastory #dataviz #antisemitism #Poland #socialmedia #Tableau
public.tableau.com/views/Resent...
February 8, 2025 at 8:55 AM
Anti-jewish sentiment in Polish social media 2023-24 (part I)
#datastory #dataviz #antisemitism #Poland #socialmedia #Tableau
public.tableau.com/views/Resent...
#datastory #dataviz #antisemitism #Poland #socialmedia #Tableau
public.tableau.com/views/Resent...

"Fascinating example of 'misleading stats'! The Ws just dominated a strong SAS team, but didn't move the needle globally. Only 8 threes & 8 assists aren't going to stop a 20pt loss. What led to the 24pt drop? Is it the 3pt shooting lapse? #Warriors #NBA #DataStory"
February 3, 2025 at 2:15 PM
"Fascinating example of 'misleading stats'! The Ws just dominated a strong SAS team, but didn't move the needle globally. Only 8 threes & 8 assists aren't going to stop a 20pt loss. What led to the 24pt drop? Is it the 3pt shooting lapse? #Warriors #NBA #DataStory"
Want to learn how to create a predictive model for your sports data story? We created one to predict the winner of the 4 Nations Face-Off tournament. #nhl #4nationsfaceoff #hockey #datastory #sportsdatastory #hockeyanalytics #datapunkhockey #predictivemodel youtu.be/qhETzicm2uw
Hockey Analyst Reveals Final Prediction for 4 Nations Face Off
YouTube video by Data Punk
youtu.be
January 28, 2025 at 12:18 AM
Want to learn how to create a predictive model for your sports data story? We created one to predict the winner of the 4 Nations Face-Off tournament. #nhl #4nationsfaceoff #hockey #datastory #sportsdatastory #hockeyanalytics #datapunkhockey #predictivemodel youtu.be/qhETzicm2uw

Oof... This is not a nice datastory. I totally get why Nicholas feels the urge to try keep track of his circumstances. Not just depend on what one or other specialist thinks at one point in time.
I know that feeling of helplessness and trying to get some sort of control.
#dataviz #healthviz
I know that feeling of helplessness and trying to get some sort of control.
#dataviz #healthviz

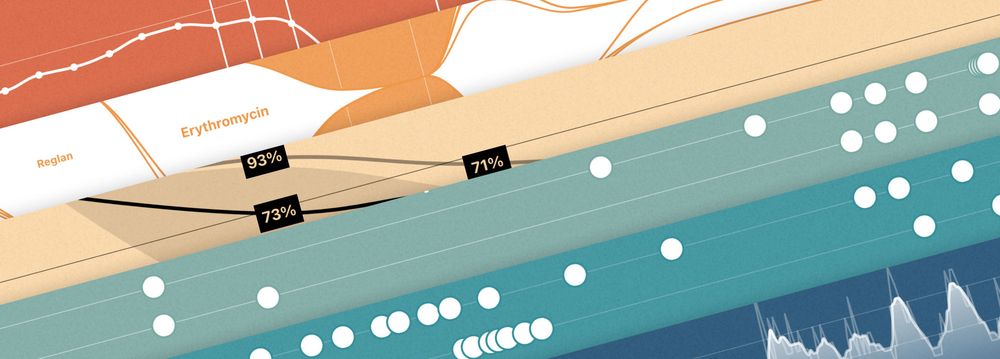
Now for something different and more personal. I wrote about data I collected about myself while learning to live with chronic nausea for the past 14 months. Living with Nausea: My Story in Six Charts. www.c82.net/blog/?id=96
January 12, 2025 at 6:44 PM
Oof... This is not a nice datastory. I totally get why Nicholas feels the urge to try keep track of his circumstances. Not just depend on what one or other specialist thinks at one point in time.
I know that feeling of helplessness and trying to get some sort of control.
#dataviz #healthviz
I know that feeling of helplessness and trying to get some sort of control.
#dataviz #healthviz

I should probably also add... I've still not found a layout I like for the volunteers report... We've got people so we know who runs and volunteers or just volunteers. But what tells a good #datastory? #powerbi #dataanslysis #volunteering #parkrun #geordielife
December 23, 2024 at 12:46 PM
I should probably also add... I've still not found a layout I like for the volunteers report... We've got people so we know who runs and volunteers or just volunteers. But what tells a good #datastory? #powerbi #dataanslysis #volunteering #parkrun #geordielife

🎉 Spotify launches Wrapped 2024! 🎧 Now featuring an AI-generated podcast summary of your year, powered by Google's NotebookLM, plus a new "Your Music Evolution" data story! 📊🎶 #SpotifyWrapped #AI #MusicTrends #2024Wrapped #Spotify #DataStory #Podcasting #MusicEvolution

December 4, 2024 at 3:32 PM
🎉 Spotify launches Wrapped 2024! 🎧 Now featuring an AI-generated podcast summary of your year, powered by Google's NotebookLM, plus a new "Your Music Evolution" data story! 📊🎶 #SpotifyWrapped #AI #MusicTrends #2024Wrapped #Spotify #DataStory #Podcasting #MusicEvolution

Tired of the old bars and graphs? (1) Try a new “IAC Sankey” (2)
Sick of manually updating PowerPoint slides? (3)
Try a new “Case Outcomes Sankey” (4)
Read newest #DATALab #DataStory introducing these visualizations: phillyda.org/data-story-g...
Data.philadao.com
Sick of manually updating PowerPoint slides? (3)
Try a new “Case Outcomes Sankey” (4)
Read newest #DATALab #DataStory introducing these visualizations: phillyda.org/data-story-g...
Data.philadao.com


November 20, 2024 at 3:19 AM
Tired of the old bars and graphs? (1) Try a new “IAC Sankey” (2)
Sick of manually updating PowerPoint slides? (3)
Try a new “Case Outcomes Sankey” (4)
Read newest #DATALab #DataStory introducing these visualizations: phillyda.org/data-story-g...
Data.philadao.com
Sick of manually updating PowerPoint slides? (3)
Try a new “Case Outcomes Sankey” (4)
Read newest #DATALab #DataStory introducing these visualizations: phillyda.org/data-story-g...
Data.philadao.com
Data analysis & criminal legal & comms people, check out this new #DataStory introducing Sankey graphs to show flow through system, from incidents to arrests to cases to outcomes.
phillyda.org/data-story-g...
Is the visual clear and helpful? Let us know what you think! #Philly #DATALab
phillyda.org/data-story-g...
Is the visual clear and helpful? Let us know what you think! #Philly #DATALab

Data Story: Go With The Flow: Introducing New Visualizations for Incidents-Arrests-Charges and Case Outcomes - Office of the District Attorney : City of Philadelphia
By Vincent Liu (Data Analyst, DATA Lab) The District Attorney’s Transparency Analytics (DATA) Lab strives to iterate and improve our reporting on data about the criminal legal system in Philadelphia. ...
phillyda.org
November 19, 2024 at 4:58 PM
Data analysis & criminal legal & comms people, check out this new #DataStory introducing Sankey graphs to show flow through system, from incidents to arrests to cases to outcomes.
phillyda.org/data-story-g...
Is the visual clear and helpful? Let us know what you think! #Philly #DATALab
phillyda.org/data-story-g...
Is the visual clear and helpful? Let us know what you think! #Philly #DATALab

Charting beyond sight with datastory: Sensory substitution and storytelling in visual literacy education for visually impaired children programs.sigchi.org/chi/2024/pro... YouTube video www.youtube.com/watch?v=38HD... #CHI2024
Conference Programs
programs.sigchi.org
May 14, 2024 at 8:00 AM
Charting beyond sight with datastory: Sensory substitution and storytelling in visual literacy education for visually impaired children programs.sigchi.org/chi/2024/pro... YouTube video www.youtube.com/watch?v=38HD... #CHI2024


Nice examples of "The judicious use of anecdote" in telling health #datastories from @healthnewsrevu#health #datastory #datajournalism
healthnewsreview.org/2018/02/5-star…
healthnewsreview.org/2018/02/5-star…
January 8, 2025 at 1:23 AM
Nice examples of "The judicious use of anecdote" in telling health #datastories from @healthnewsrevu#health #datastory #datajournalism
healthnewsreview.org/2018/02/5-star…
healthnewsreview.org/2018/02/5-star…
Gender pay gap: the day women start working for free - Washington PostGreat #datastory & debunking
washingtonpost.com/graphics/2017/…
washingtonpost.com/graphics/2017/…
Analysis | Oct. 26, the day women start working for free
The median salary for women working full-time is about 80% of men’s. That gap, put in other terms, means women are working for free 10 weeks a year.
www.washingtonpost.com
January 8, 2025 at 1:21 AM
Gender pay gap: the day women start working for free - Washington PostGreat #datastory & debunking
washingtonpost.com/graphics/2017/…
washingtonpost.com/graphics/2017/…