


Hector Pina
@yanipaper.bsky.social
Doctorando y docente en @ITESO. Periodista. Datos, Mapas y Crónica. Hecho en @UNAM_MX y @CIDE_MX. Mi amigo-perro se llama Wash. Tengo #TAB.
He recorrido la @filguadalajara.bsky.social muchas veces, primero como lector y luego como reportero. Pero jamás esbocé la posibilidad -ni en mis arrebatos de mayor soberbia ni en mis delirios más audaces- de que algún día estaría como autor. Hoy, ese momento tomará forma.

December 2, 2024 at 2:42 PM
He recorrido la @filguadalajara.bsky.social muchas veces, primero como lector y luego como reportero. Pero jamás esbocé la posibilidad -ni en mis arrebatos de mayor soberbia ni en mis delirios más audaces- de que algún día estaría como autor. Hoy, ese momento tomará forma.
Reposted by Hector Pina

Elevation of the Moon with only circular shapes, even the typography :) Day 24 of #30daymapchallenge. #moon #cartography #maps.

November 24, 2024 at 10:49 PM
Elevation of the Moon with only circular shapes, even the typography :) Day 24 of #30daymapchallenge. #moon #cartography #maps.
Reposted by Hector Pina
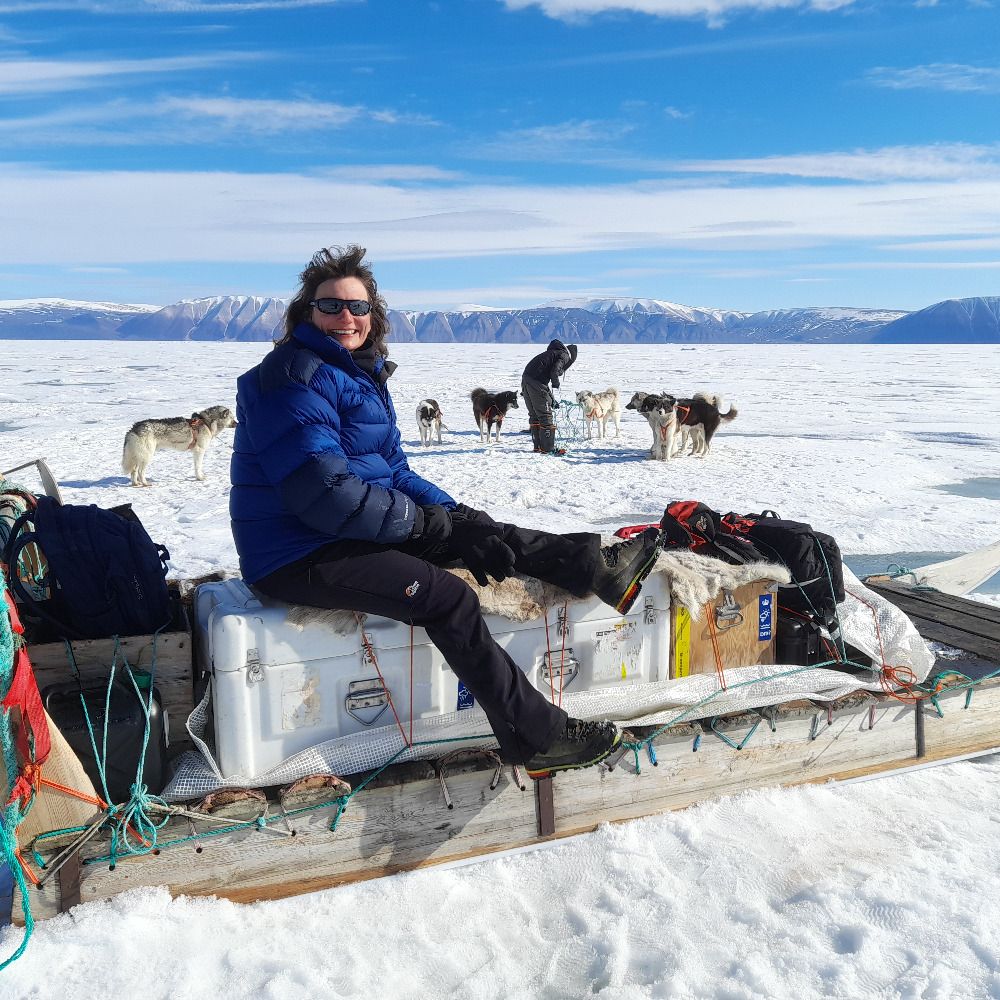
Good morning blue sky, I wrote a thing on our new paper (Glaude et al., 2024, GRL) looking at #Greenland #IceSheet processes and why the devil really is in the details when it comes to ice sheet melt and sea level rise
❄️🥼⛏️🧪
❄️🥼⛏️🧪

Small differences that make a really big difference.
We have a new paper just out this week on Greenland ice sheet projections of melt and runoff. “With identical forcing, Greenland Ice Sheet surface mass balance from 3 regional climate models …
sternaparadisaea.net
November 25, 2024 at 9:07 AM
Good morning blue sky, I wrote a thing on our new paper (Glaude et al., 2024, GRL) looking at #Greenland #IceSheet processes and why the devil really is in the details when it comes to ice sheet melt and sea level rise
❄️🥼⛏️🧪
❄️🥼⛏️🧪
Reposted by Hector Pina

🌍 #30DayMapChallenge Day 25: Heat
This globe map, in orthographic projection, shows the temperature anomaly for the month of July 2024, highlighting the regions most impacted by the heat. Inspired by @drxeo.eu and @milos-makes-maps.bsky.social tutorials.
Code: shorturl.at/fuBqY
#maps #GIS #rstats
This globe map, in orthographic projection, shows the temperature anomaly for the month of July 2024, highlighting the regions most impacted by the heat. Inspired by @drxeo.eu and @milos-makes-maps.bsky.social tutorials.
Code: shorturl.at/fuBqY
#maps #GIS #rstats

November 25, 2024 at 10:27 AM
🌍 #30DayMapChallenge Day 25: Heat
This globe map, in orthographic projection, shows the temperature anomaly for the month of July 2024, highlighting the regions most impacted by the heat. Inspired by @drxeo.eu and @milos-makes-maps.bsky.social tutorials.
Code: shorturl.at/fuBqY
#maps #GIS #rstats
This globe map, in orthographic projection, shows the temperature anomaly for the month of July 2024, highlighting the regions most impacted by the heat. Inspired by @drxeo.eu and @milos-makes-maps.bsky.social tutorials.
Code: shorturl.at/fuBqY
#maps #GIS #rstats

Hay días que, no sé, son más tristes que ninguno. Nunca tengan trastorno bipolar.
November 21, 2024 at 3:25 PM
Hay días que, no sé, son más tristes que ninguno. Nunca tengan trastorno bipolar.
@hvillafuerte.bsky.social eres mi primer seguidor en esta red. ¡Gracias totales!
November 17, 2024 at 6:26 PM
@hvillafuerte.bsky.social eres mi primer seguidor en esta red. ¡Gracias totales!
Ya vine / I'm here
November 17, 2024 at 4:12 PM
Ya vine / I'm here