


I’m Xtophe, that’s all you need to know.🇯🇵
@xtophebontemps.bsky.social
Teaching data science, data visualization and other data stuff in a far away land 🇯🇵 for a non profit organization.
Also, PhD and other diploma that impress people.
Hiker, climber, biker, snowboarder as long as my body can resist..
Also, PhD and other diploma that impress people.
Hiker, climber, biker, snowboarder as long as my body can resist..
Reposted by I’m Xtophe, that’s all you need to know.🇯🇵

For my dataz literacy folks: How are we teaching people how to read charts now and how has it changed over time? Is there a #dataviz equivalent of phonics vs whole word chart learning? I'm reading some articles about the current challenges with traditional literacy and wonder if we have it too.
December 1, 2024 at 7:39 PM
For my dataz literacy folks: How are we teaching people how to read charts now and how has it changed over time? Is there a #dataviz equivalent of phonics vs whole word chart learning? I'm reading some articles about the current challenges with traditional literacy and wonder if we have it too.
Reposted by I’m Xtophe, that’s all you need to know.🇯🇵

#rstats I was recently reminded of this neat #ggplot2 trick by @tjmahr.com on how to create a 'self-documenting plot' that shows the code used to create it
www.tjmahr.com/self-titled-...
www.tjmahr.com/self-titled-...

Self-documenting plots in ggplot2
Including plotting code as an annotation on a plot
www.tjmahr.com
December 2, 2024 at 2:59 AM
#rstats I was recently reminded of this neat #ggplot2 trick by @tjmahr.com on how to create a 'self-documenting plot' that shows the code used to create it
www.tjmahr.com/self-titled-...
www.tjmahr.com/self-titled-...
I am a bit puzzled with the "climate stripes" today. Shouldn't the red part of the palette start at 0 - above is warmer (red-ish) , below is colder (blue-ish) ?
Also, why have this blue-red separation at 0.6 actually?
#dataviz #climatedchange #stripes
Also, why have this blue-red separation at 0.6 actually?
#dataviz #climatedchange #stripes

December 2, 2024 at 3:50 AM
I am a bit puzzled with the "climate stripes" today. Shouldn't the red part of the palette start at 0 - above is warmer (red-ish) , below is colder (blue-ish) ?
Also, why have this blue-red separation at 0.6 actually?
#dataviz #climatedchange #stripes
Also, why have this blue-red separation at 0.6 actually?
#dataviz #climatedchange #stripes
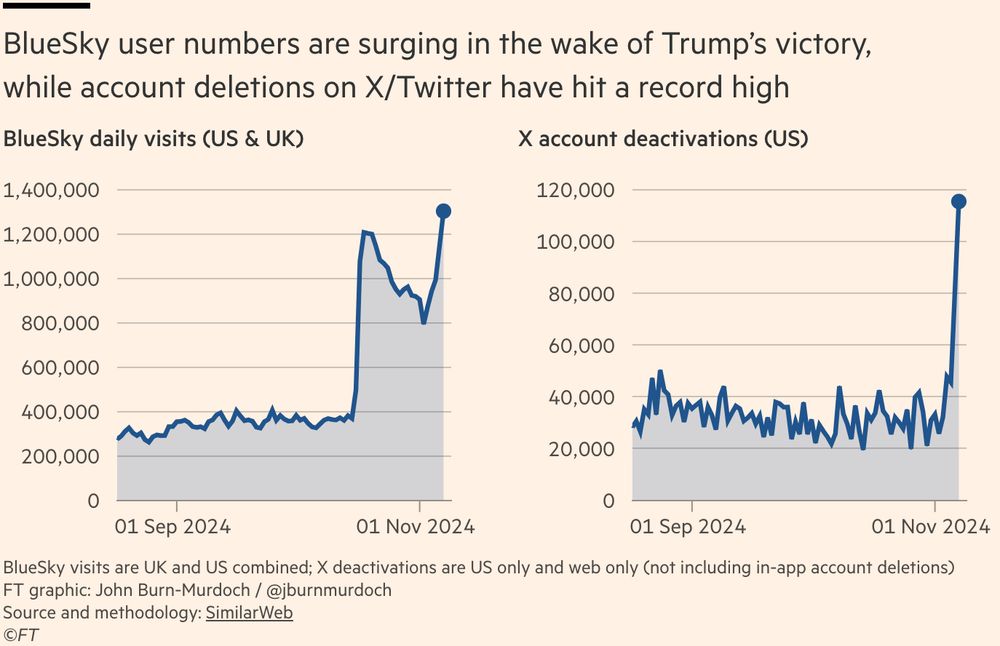
It is so good to be part of these spikes :-)
A tale of two platforms:
BlueSky user numbers have hit a new record high in recent days, while the number of people deleting their accounts on X/Twitter has rocketed 🚀
BlueSky user numbers have hit a new record high in recent days, while the number of people deleting their accounts on X/Twitter has rocketed 🚀
November 14, 2024 at 11:25 AM
It is so good to be part of these spikes :-)
Reposted by I’m Xtophe, that’s all you need to know.🇯🇵

A tale of two platforms:
BlueSky user numbers have hit a new record high in recent days, while the number of people deleting their accounts on X/Twitter has rocketed 🚀
BlueSky user numbers have hit a new record high in recent days, while the number of people deleting their accounts on X/Twitter has rocketed 🚀
November 13, 2024 at 11:21 AM
A tale of two platforms:
BlueSky user numbers have hit a new record high in recent days, while the number of people deleting their accounts on X/Twitter has rocketed 🚀
BlueSky user numbers have hit a new record high in recent days, while the number of people deleting their accounts on X/Twitter has rocketed 🚀
Reposted by I’m Xtophe, that’s all you need to know.🇯🇵

What is the difference between weather and climate. This #dataviz shows the "Central England" average temperature for periods ranging from 1 day (weather) to 30 years (climate). This shows the climate signal emerging. Note the varying y axis that covers the range of the data.
November 8, 2024 at 4:23 PM
What is the difference between weather and climate. This #dataviz shows the "Central England" average temperature for periods ranging from 1 day (weather) to 30 years (climate). This shows the climate signal emerging. Note the varying y axis that covers the range of the data.