


Ed James
@whitefleece.bsky.social
ED consultant NHS Lothian, Clinical Advisor Unscheduled Care, CfSD, SQSF fellow, bibliophile and AVFC fan. Thoughts my own...
Reposted by Ed James

Do you mention Little’s Law? I think it would be useful to get across the idea that for simple queues the long-run average number of patients in the system L = ρ / (1 - ρ), where ρ is the utilisation of the service. As ρ → 1 the queue “blows up”...
July 10, 2025 at 9:52 AM
Do you mention Little’s Law? I think it would be useful to get across the idea that for simple queues the long-run average number of patients in the system L = ρ / (1 - ρ), where ρ is the utilisation of the service. As ρ → 1 the queue “blows up”...
Reposted by Ed James

It was good to see @samfr.bsky.social say today that "the main reason for lengthy A&E waiting times is the lack of hospital beds for people who need admitting, which gums up the whole system as they have to keep being treated by emergency staff."
samf.substack.com/p/optimism-o...
#rstats #ggplot2
samf.substack.com/p/optimism-o...
#rstats #ggplot2

July 9, 2025 at 2:10 PM
It was good to see @samfr.bsky.social say today that "the main reason for lengthy A&E waiting times is the lack of hospital beds for people who need admitting, which gums up the whole system as they have to keep being treated by emergency staff."
samf.substack.com/p/optimism-o...
#rstats #ggplot2
samf.substack.com/p/optimism-o...
#rstats #ggplot2
the fallacy of redirection fixing all ills

Great graphics - long A&E wait times are caused by a lack of bed not by the number attending. It's counter-intuitive but really important in understanding how to fix the problem!
It was good to see @samfr.bsky.social say today that "the main reason for lengthy A&E waiting times is the lack of hospital beds for people who need admitting, which gums up the whole system as they have to keep being treated by emergency staff."
samf.substack.com/p/optimism-o...
#rstats #ggplot2
samf.substack.com/p/optimism-o...
#rstats #ggplot2
July 9, 2025 at 8:38 PM
the fallacy of redirection fixing all ills
Reposted by Ed James
I think we're getting close to the point when @whitefleece.bsky.social and I are ready to launch our #KnowYourFlow and #TriptychMetrics slogans into the World of Unscheduled Care!
May 16, 2025 at 11:35 AM
I think we're getting close to the point when @whitefleece.bsky.social and I are ready to launch our #KnowYourFlow and #TriptychMetrics slogans into the World of Unscheduled Care!
Reposted by Ed James
If there’s merit in my idea of simplifying patient flow so that it resembles a puzzle with six numbers, one question worth asking is: “If it’s as simple as this, why aren’t we already doing it?”
1/14
1/14

May 11, 2025 at 12:15 PM
If there’s merit in my idea of simplifying patient flow so that it resembles a puzzle with six numbers, one question worth asking is: “If it’s as simple as this, why aren’t we already doing it?”
1/14
1/14
Reposted by Ed James

This isn't getting enough attention: policyskeptic.blogspot.com/2025/05/a-wa... ...

A&E waits might be the biggest cause of avoidable death in England
New data from the ONS on their analysis of mortality and A&E waits has enabled new, better calculations on the magnitude of excess deaths ...
policyskeptic.blogspot.com
May 9, 2025 at 4:52 PM
This isn't getting enough attention: policyskeptic.blogspot.com/2025/05/a-wa... ...
Reposted by Ed James
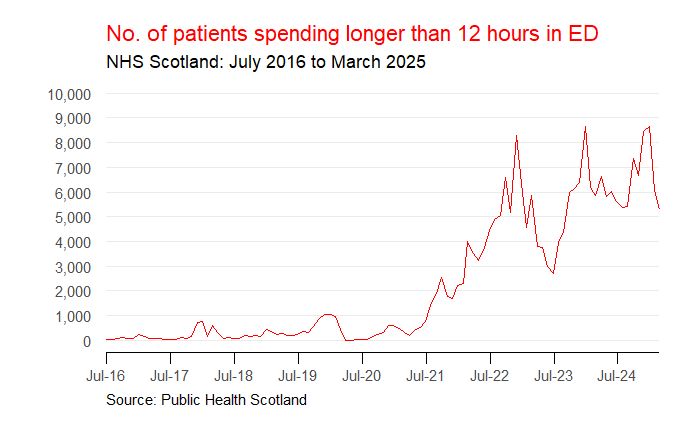
It's approximate, but the excess deaths formula is that roughly 1.4% of patients who spend longer than 12 hours in A&E will die needlessly. So for Scotland in the year ending March 2025, that'd be about 1,100 excess deaths. @policyskeptic.bsky.social has a better command of this.
@samfr.bsky.social
@samfr.bsky.social

May 10, 2025 at 9:46 AM
It's approximate, but the excess deaths formula is that roughly 1.4% of patients who spend longer than 12 hours in A&E will die needlessly. So for Scotland in the year ending March 2025, that'd be about 1,100 excess deaths. @policyskeptic.bsky.social has a better command of this.
@samfr.bsky.social
@samfr.bsky.social
Reposted by Ed James
A 'cruel twist of irony' thing occurred to me about my purple scatterplot: A lot of patients will end up featuring on *both* axes. They'll experience a >12-hour stay in A&E and then, later in their patient journey, they'll become a delayed discharge.
@policyskeptic.bsky.social
@samfr.bsky.social
@policyskeptic.bsky.social
@samfr.bsky.social

May 10, 2025 at 9:52 AM
A 'cruel twist of irony' thing occurred to me about my purple scatterplot: A lot of patients will end up featuring on *both* axes. They'll experience a >12-hour stay in A&E and then, later in their patient journey, they'll become a delayed discharge.
@policyskeptic.bsky.social
@samfr.bsky.social
@policyskeptic.bsky.social
@samfr.bsky.social
Reposted by Ed James
I’m keen to know if I’m just stating something that’s obvious here, or whether I’ve stumbled across a correlation that might be useful in our efforts to understand patient flow…
1/15
1/15
May 6, 2025 at 3:10 PM
I’m keen to know if I’m just stating something that’s obvious here, or whether I’ve stumbled across a correlation that might be useful in our efforts to understand patient flow…
1/15
1/15
Reposted by Ed James
I stumbled across this short video clip the other day – this is Scott Morrison (*not* the Scott Morrison who used to be the Prime Minister of Australia!) talking to Jo Howes about how we should try to turn problems into puzzles.
1/15
www.youtube.com/watch?v=djUA...
1/15
www.youtube.com/watch?v=djUA...

Reframe Problems as Puzzles
YouTube video by Courageous Leaders Podcast with Joanna Howes
www.youtube.com
May 2, 2025 at 2:10 PM
I stumbled across this short video clip the other day – this is Scott Morrison (*not* the Scott Morrison who used to be the Prime Minister of Australia!) talking to Jo Howes about how we should try to turn problems into puzzles.
1/15
www.youtube.com/watch?v=djUA...
1/15
www.youtube.com/watch?v=djUA...
Reposted by Ed James
I'll be telling the story of the Red Curtains of Doom at the EdinbR meetup on Thu 17th April...

April 7, 2025 at 4:31 PM
I'll be telling the story of the Red Curtains of Doom at the EdinbR meetup on Thu 17th April...

Reposted by Ed James
The idea that the problem can be tackled by actions everywhere else (to reduce demand) has been tested to death over the last decade of bad policy and has utterly failed...
March 12, 2025 at 12:17 PM
The idea that the problem can be tackled by actions everywhere else (to reduce demand) has been tested to death over the last decade of bad policy and has utterly failed...
Reposted by Ed James
@whitefleece.bsky.social If we want to get people to take ED crowding more seriously, maybe we should try to make the *depictions* of crowding a bit easier to look at!

March 7, 2025 at 4:24 PM
@whitefleece.bsky.social If we want to get people to take ED crowding more seriously, maybe we should try to make the *depictions* of crowding a bit easier to look at!
Reposted by Ed James
Maybe we should start measuring the average AMU length of stay so far if we want to understand exit block in full-to-the-brim general hospitals: neilpettinger.substack.com/p/never-mind...

February 21, 2025 at 4:21 PM
Maybe we should start measuring the average AMU length of stay so far if we want to understand exit block in full-to-the-brim general hospitals: neilpettinger.substack.com/p/never-mind...
Reposted by Ed James
Here are five reasons why we’re failing to improve patient flow in the NHS. There are probably more, but these are the reasons that are prominent in my mind at the moment.
(1/7)
(1/7)
February 13, 2025 at 4:01 PM
Here are five reasons why we’re failing to improve patient flow in the NHS. There are probably more, but these are the reasons that are prominent in my mind at the moment.
(1/7)
(1/7)
Reposted by Ed James
How have we got ourselves into a position where we’re mainly publishing data to passive decision-makers? And can we somehow re-establish a degree of interactivity?
neilpettinger.substack.com/p/healthcare...
neilpettinger.substack.com/p/healthcare...

Healthcare Data Analytics 2.0
We need more interactivity in the way we communicate performance information
neilpettinger.substack.com
February 10, 2025 at 4:45 PM
How have we got ourselves into a position where we’re mainly publishing data to passive decision-makers? And can we somehow re-establish a degree of interactivity?
neilpettinger.substack.com/p/healthcare...
neilpettinger.substack.com/p/healthcare...
Reposted by Ed James
Operation Red Box, anyone?
open.substack.com/pub/neilpett...
open.substack.com/pub/neilpett...

Inside the red box
Clinical directorates need to be given their 'there-and-then' data
open.substack.com
January 31, 2025 at 4:06 PM
Operation Red Box, anyone?
open.substack.com/pub/neilpett...
open.substack.com/pub/neilpett...