


VoteHub
@votehub.com
Your hub for election content. 🇺🇸 We map elections in detail, aggregate only top-quality polls, and offer insights to explain the political landscape.
votehub.com
votehub.com
Pinned
VoteHub
@votehub.com
· 14d
Hi Bluesky 👋
While our primary social media presence is still the old bird app, we wanted to share here what we’ve been posting there.
This past week, we created detailed interactive maps that populated in real time for elections in NJ, VA, NYC, CA, and GA.
While our primary social media presence is still the old bird app, we wanted to share here what we’ve been posting there.
This past week, we created detailed interactive maps that populated in real time for elections in NJ, VA, NYC, CA, and GA.
Trump's approval is at a new low.
Current net approval: 🔻 -13.4
1-month change: 🔻 -4.9
Current net approval: 🔻 -13.4
1-month change: 🔻 -4.9

November 23, 2025 at 7:34 PM
Trump's approval is at a new low.
Current net approval: 🔻 -13.4
1-month change: 🔻 -4.9
Current net approval: 🔻 -13.4
1-month change: 🔻 -4.9
Tennessee's 7th Congressional District
🚨 Early vote update
NOW WITH PRECINCTS
Total: 54,789
(+5,300 on 11-22)
Turnout Leaderboard (by share of 2024 turnout):
Williamson - 18.5%
Davidson - 18.3%
Cheatham - 18.3%
🚨 Early vote update
NOW WITH PRECINCTS
Total: 54,789
(+5,300 on 11-22)
Turnout Leaderboard (by share of 2024 turnout):
Williamson - 18.5%
Davidson - 18.3%
Cheatham - 18.3%

November 23, 2025 at 3:24 PM
Tennessee's 7th Congressional District
🚨 Early vote update
NOW WITH PRECINCTS
Total: 54,789
(+5,300 on 11-22)
Turnout Leaderboard (by share of 2024 turnout):
Williamson - 18.5%
Davidson - 18.3%
Cheatham - 18.3%
🚨 Early vote update
NOW WITH PRECINCTS
Total: 54,789
(+5,300 on 11-22)
Turnout Leaderboard (by share of 2024 turnout):
Williamson - 18.5%
Davidson - 18.3%
Cheatham - 18.3%
Tennessee's 7th Congressional District
🚨 Early vote update
NOW WITH PRECINCTS
Total: 49,489
(+7,610 on 11-21)
Turnout Leaderboard (by share of 2024 turnout):
Cheatham - 17.4%
Humphreys - 17.2%
Williamson - 16.9%
🚨 Early vote update
NOW WITH PRECINCTS
Total: 49,489
(+7,610 on 11-21)
Turnout Leaderboard (by share of 2024 turnout):
Cheatham - 17.4%
Humphreys - 17.2%
Williamson - 16.9%

November 22, 2025 at 9:29 PM
Tennessee's 7th Congressional District
🚨 Early vote update
NOW WITH PRECINCTS
Total: 49,489
(+7,610 on 11-21)
Turnout Leaderboard (by share of 2024 turnout):
Cheatham - 17.4%
Humphreys - 17.2%
Williamson - 16.9%
🚨 Early vote update
NOW WITH PRECINCTS
Total: 49,489
(+7,610 on 11-21)
Turnout Leaderboard (by share of 2024 turnout):
Cheatham - 17.4%
Humphreys - 17.2%
Williamson - 16.9%
Democrats lead Republicans in the 2026 generic ballot by about 5 points.
1-month change: 🔵 D +1.7
1-month change: 🔵 D +1.7

November 22, 2025 at 8:03 PM
Democrats lead Republicans in the 2026 generic ballot by about 5 points.
1-month change: 🔵 D +1.7
1-month change: 🔵 D +1.7
Tennessee's 7th Congressional District
🚨 Early vote update
NOW WITH PRECINCTS
Total: 41,879
(+5,447 on 11-20)
Turnout Leaderboard (by share of 2024 turnout):
Humphreys - 14.7%
Cheatham - 14.5%
Houston - 14.2%
🚨 Early vote update
NOW WITH PRECINCTS
Total: 41,879
(+5,447 on 11-20)
Turnout Leaderboard (by share of 2024 turnout):
Humphreys - 14.7%
Cheatham - 14.5%
Houston - 14.2%

November 21, 2025 at 4:44 PM
Tennessee's 7th Congressional District
🚨 Early vote update
NOW WITH PRECINCTS
Total: 41,879
(+5,447 on 11-20)
Turnout Leaderboard (by share of 2024 turnout):
Humphreys - 14.7%
Cheatham - 14.5%
Houston - 14.2%
🚨 Early vote update
NOW WITH PRECINCTS
Total: 41,879
(+5,447 on 11-20)
Turnout Leaderboard (by share of 2024 turnout):
Humphreys - 14.7%
Cheatham - 14.5%
Houston - 14.2%
Since House Oversight Dems published new Epstein emails last week, Trump’s net favorability has fallen about 4 points.
His favorability rating now stands at 42.4%, the lowest of his second term.
His favorability rating now stands at 42.4%, the lowest of his second term.

November 20, 2025 at 8:58 PM
Since House Oversight Dems published new Epstein emails last week, Trump’s net favorability has fallen about 4 points.
His favorability rating now stands at 42.4%, the lowest of his second term.
His favorability rating now stands at 42.4%, the lowest of his second term.
Tennessee’s 7th Congressional District
🚨Early vote update
Total ballots: 25,320
(+4,961 on 11/17)
Top counties by share of their 2024 turnout:
Houston – 9.3%
Humphreys – 9.3%
Davidson – 8.6%
🚨Early vote update
Total ballots: 25,320
(+4,961 on 11/17)
Top counties by share of their 2024 turnout:
Houston – 9.3%
Humphreys – 9.3%
Davidson – 8.6%

November 18, 2025 at 3:25 PM
Tennessee’s 7th Congressional District
🚨Early vote update
Total ballots: 25,320
(+4,961 on 11/17)
Top counties by share of their 2024 turnout:
Houston – 9.3%
Humphreys – 9.3%
Davidson – 8.6%
🚨Early vote update
Total ballots: 25,320
(+4,961 on 11/17)
Top counties by share of their 2024 turnout:
Houston – 9.3%
Humphreys – 9.3%
Davidson – 8.6%
JD Vance’s net favorability has been notably more stable and consistently higher than Trump’s approval rating this term, though it remains slightly negative at roughly -6.
4-week change: ▲ +0.4
3-month change: ▲ +1.0
4-week change: ▲ +0.4
3-month change: ▲ +1.0

November 17, 2025 at 4:39 AM
JD Vance’s net favorability has been notably more stable and consistently higher than Trump’s approval rating this term, though it remains slightly negative at roughly -6.
4-week change: ▲ +0.4
3-month change: ▲ +1.0
4-week change: ▲ +0.4
3-month change: ▲ +1.0
Democrats lead Republicans in the 2026 generic ballot by around 4 points.
4-week change: 🔵 D +1.3
3-month change: 🔵 D +0.3
4-week change: 🔵 D +1.3
3-month change: 🔵 D +0.3

November 16, 2025 at 10:58 PM
Democrats lead Republicans in the 2026 generic ballot by around 4 points.
4-week change: 🔵 D +1.3
3-month change: 🔵 D +0.3
4-week change: 🔵 D +1.3
3-month change: 🔵 D +0.3
Trump’s approval has reached a new low.
Current net approval: 🔻 -12.1
4-week change: 🔻 -4.6
Current net approval: 🔻 -12.1
4-week change: 🔻 -4.6

November 16, 2025 at 12:33 AM
Trump’s approval has reached a new low.
Current net approval: 🔻 -12.1
4-week change: 🔻 -4.6
Current net approval: 🔻 -12.1
4-week change: 🔻 -4.6
NEW: Virginia Dept. of Elections has finalized results for the 2025 general election.
GOV: 🔵 +15 (FLIP)
LG: 🔵 +11 (FLIP)
AG: 🔵 +7 (FLIP)
GOV: 🔵 +15 (FLIP)
LG: 🔵 +11 (FLIP)
AG: 🔵 +7 (FLIP)

November 15, 2025 at 3:23 AM
NEW: Virginia Dept. of Elections has finalized results for the 2025 general election.
GOV: 🔵 +15 (FLIP)
LG: 🔵 +11 (FLIP)
AG: 🔵 +7 (FLIP)
GOV: 🔵 +15 (FLIP)
LG: 🔵 +11 (FLIP)
AG: 🔵 +7 (FLIP)
BREAKING -- Indiana Senate Pro Tem announces there are not enough votes for mid-cycle redistricting.
November 14, 2025 at 8:19 PM
BREAKING -- Indiana Senate Pro Tem announces there are not enough votes for mid-cycle redistricting.
Every precinct in Gwinnett County, GA voted Democratic last Tuesday.
2004: 🔴 Bush +32
2008: 🔴 McCain +10
2012: 🔴 Romney +9
2016: 🔵 Clinton +6
2020: 🔵 Biden +18
2024: 🔵 Harris +17
2025: 🔵 Hubbard +45
2004: 🔴 Bush +32
2008: 🔴 McCain +10
2012: 🔴 Romney +9
2016: 🔵 Clinton +6
2020: 🔵 Biden +18
2024: 🔵 Harris +17
2025: 🔵 Hubbard +45

November 13, 2025 at 1:53 AM
Every precinct in Gwinnett County, GA voted Democratic last Tuesday.
2004: 🔴 Bush +32
2008: 🔴 McCain +10
2012: 🔴 Romney +9
2016: 🔵 Clinton +6
2020: 🔵 Biden +18
2024: 🔵 Harris +17
2025: 🔵 Hubbard +45
2004: 🔴 Bush +32
2008: 🔴 McCain +10
2012: 🔴 Romney +9
2016: 🔵 Clinton +6
2020: 🔵 Biden +18
2024: 🔵 Harris +17
2025: 🔵 Hubbard +45
Municipality level data is now available for Union County!
Mikie Sherrill carried this urban-suburban county by 35 points, which is a 11 point improvement over Kamala Harris in 2024.
Mikie Sherrill carried this urban-suburban county by 35 points, which is a 11 point improvement over Kamala Harris in 2024.

November 11, 2025 at 11:40 PM
Municipality level data is now available for Union County!
Mikie Sherrill carried this urban-suburban county by 35 points, which is a 11 point improvement over Kamala Harris in 2024.
Mikie Sherrill carried this urban-suburban county by 35 points, which is a 11 point improvement over Kamala Harris in 2024.
🚨 BREAKING -- Utah court rules against legislature’s congressional map and enacts Plaintiff’s map. The new map will be in place for the 2026 elections.
🔵 Dem gain of +1 seat.
🔵 Dem gain of +1 seat.

November 11, 2025 at 7:15 AM
🚨 BREAKING -- Utah court rules against legislature’s congressional map and enacts Plaintiff’s map. The new map will be in place for the 2026 elections.
🔵 Dem gain of +1 seat.
🔵 Dem gain of +1 seat.
Abigail Spanberger carried Virginia's 1st Congressional District by 2.2 points. This is a 7 point improvement over Kamala Harris who lost it by roughly 5 points.
This district is currently held by Republican Rob Wittman.
This district is currently held by Republican Rob Wittman.

November 11, 2025 at 3:13 AM
Abigail Spanberger carried Virginia's 1st Congressional District by 2.2 points. This is a 7 point improvement over Kamala Harris who lost it by roughly 5 points.
This district is currently held by Republican Rob Wittman.
This district is currently held by Republican Rob Wittman.
2025 New Jersey Gubernatorial Shift from the 2024 US Senate Race:
🔵 Kim 54.9%→ Sherrill 56.9%
🔴 Bashaw 45.1% → Ciattarelli 43.1%
Shift: Sherrill +4
🔵 Kim 54.9%→ Sherrill 56.9%
🔴 Bashaw 45.1% → Ciattarelli 43.1%
Shift: Sherrill +4

November 11, 2025 at 1:22 AM
2025 New Jersey Gubernatorial Shift from the 2024 US Senate Race:
🔵 Kim 54.9%→ Sherrill 56.9%
🔴 Bashaw 45.1% → Ciattarelli 43.1%
Shift: Sherrill +4
🔵 Kim 54.9%→ Sherrill 56.9%
🔴 Bashaw 45.1% → Ciattarelli 43.1%
Shift: Sherrill +4
Democrats hold a 4 point lead over Republicans in the 2026 generic ballot average.
🔵 Democratic - 46.2%
🔴 Republican - 42.1%
🔵 Democratic - 46.2%
🔴 Republican - 42.1%

November 10, 2025 at 7:51 AM
Democrats hold a 4 point lead over Republicans in the 2026 generic ballot average.
🔵 Democratic - 46.2%
🔴 Republican - 42.1%
🔵 Democratic - 46.2%
🔴 Republican - 42.1%
Hi Bluesky 👋
While our primary social media presence is still the old bird app, we wanted to share here what we’ve been posting there.
This past week, we created detailed interactive maps that populated in real time for elections in NJ, VA, NYC, CA, and GA.
While our primary social media presence is still the old bird app, we wanted to share here what we’ve been posting there.
This past week, we created detailed interactive maps that populated in real time for elections in NJ, VA, NYC, CA, and GA.
November 10, 2025 at 7:23 AM
Hi Bluesky 👋
While our primary social media presence is still the old bird app, we wanted to share here what we’ve been posting there.
This past week, we created detailed interactive maps that populated in real time for elections in NJ, VA, NYC, CA, and GA.
While our primary social media presence is still the old bird app, we wanted to share here what we’ve been posting there.
This past week, we created detailed interactive maps that populated in real time for elections in NJ, VA, NYC, CA, and GA.
Trump’s net approval reached a new low this week, hovering near -11 in our average.
Two-week change: 🔻 -2.2
Last two months: 🔻 -3.6
Two-week change: 🔻 -2.2
Last two months: 🔻 -3.6

November 9, 2025 at 9:05 PM
Trump’s net approval reached a new low this week, hovering near -11 in our average.
Two-week change: 🔻 -2.2
Last two months: 🔻 -3.6
Two-week change: 🔻 -2.2
Last two months: 🔻 -3.6
Mikie Sherrill is polling at a new high of 49.6% in our average of polls for the New Jersey Governor race.
🔵 Mikie Sherrill 49.6%
🔴 Jack Ciattarelli 44.5%
Only 2 more days until Election Day.
🔵 Mikie Sherrill 49.6%
🔴 Jack Ciattarelli 44.5%
Only 2 more days until Election Day.

November 3, 2025 at 2:15 AM
Mikie Sherrill is polling at a new high of 49.6% in our average of polls for the New Jersey Governor race.
🔵 Mikie Sherrill 49.6%
🔴 Jack Ciattarelli 44.5%
Only 2 more days until Election Day.
🔵 Mikie Sherrill 49.6%
🔴 Jack Ciattarelli 44.5%
Only 2 more days until Election Day.
🚨 Trump’s net approval has reached a new low in his second term, slipping to -10 in our average.

November 2, 2025 at 11:28 PM
🚨 Trump’s net approval has reached a new low in his second term, slipping to -10 in our average.
Ohio's proposed map is now live in our mid-cycle Redistricting Tracker.
Current Districts (RVI Lean):
🔵 189 D | 🔴 205 R
🟡 41 Highly competitive
Proposed/Enacted:
🔵 189 D | 🔴 210 R (+5)
🟡 36 Highly competitive (-5)
👉 218 seats are needed for a majority.
Current Districts (RVI Lean):
🔵 189 D | 🔴 205 R
🟡 41 Highly competitive
Proposed/Enacted:
🔵 189 D | 🔴 210 R (+5)
🟡 36 Highly competitive (-5)
👉 218 seats are needed for a majority.

October 30, 2025 at 10:46 PM
Ohio's proposed map is now live in our mid-cycle Redistricting Tracker.
Current Districts (RVI Lean):
🔵 189 D | 🔴 205 R
🟡 41 Highly competitive
Proposed/Enacted:
🔵 189 D | 🔴 210 R (+5)
🟡 36 Highly competitive (-5)
👉 218 seats are needed for a majority.
Current Districts (RVI Lean):
🔵 189 D | 🔴 205 R
🟡 41 Highly competitive
Proposed/Enacted:
🔵 189 D | 🔴 210 R (+5)
🟡 36 Highly competitive (-5)
👉 218 seats are needed for a majority.
Ohio's state legislative leaders have agreed on a new, compromise congressional map.
Current delegation: 🔴 10 R 🔵 5 D
Measured by relative voting index:
Current districts: 🔴 11 R 🔵 4 D
Proposed: 🔴 12 R 🔵 3 D
Projected change: 🔴 +1 or +2 Republican seats
Current delegation: 🔴 10 R 🔵 5 D
Measured by relative voting index:
Current districts: 🔴 11 R 🔵 4 D
Proposed: 🔴 12 R 🔵 3 D
Projected change: 🔴 +1 or +2 Republican seats

October 30, 2025 at 10:32 PM
Ohio's state legislative leaders have agreed on a new, compromise congressional map.
Current delegation: 🔴 10 R 🔵 5 D
Measured by relative voting index:
Current districts: 🔴 11 R 🔵 4 D
Proposed: 🔴 12 R 🔵 3 D
Projected change: 🔴 +1 or +2 Republican seats
Current delegation: 🔴 10 R 🔵 5 D
Measured by relative voting index:
Current districts: 🔴 11 R 🔵 4 D
Proposed: 🔴 12 R 🔵 3 D
Projected change: 🔴 +1 or +2 Republican seats
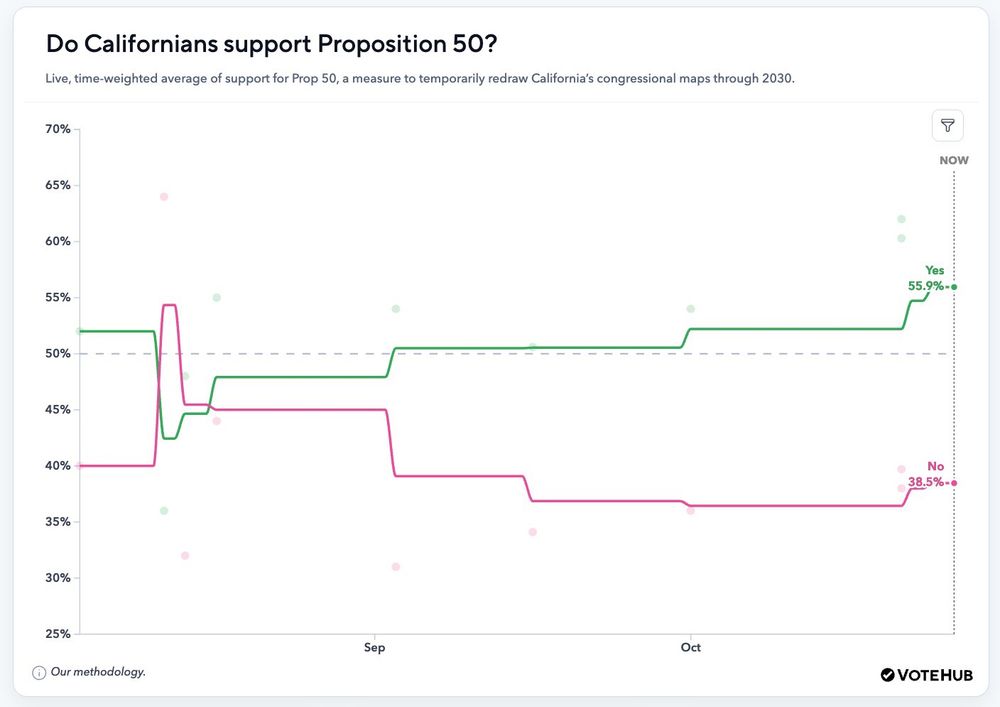
Support for Proposition 50 continues to climb in our polling average.
🟢 Yes 55.9%
🔴 No 38.5%
🟢 Yes 55.9%
🔴 No 38.5%
October 27, 2025 at 3:35 AM
Support for Proposition 50 continues to climb in our polling average.
🟢 Yes 55.9%
🔴 No 38.5%
🟢 Yes 55.9%
🔴 No 38.5%