


Vincent L. Ott
@vlott.bsky.social
i like comp sci, stats, & cog sci
vincentott.github.io
vincentott.github.io
Im unsure whether I understand the data structure you propose. You can, e.g., visualize the same unit across different conditions. Consider below: a line for each flower.
You could do a line for each animal across 5 slices (conditions) on the x-axis?
Does this (partially) answer your question?
You could do a line for each animal across 5 slices (conditions) on the x-axis?
Does this (partially) answer your question?

October 12, 2025 at 2:46 PM
Im unsure whether I understand the data structure you propose. You can, e.g., visualize the same unit across different conditions. Consider below: a line for each flower.
You could do a line for each animal across 5 slices (conditions) on the x-axis?
Does this (partially) answer your question?
You could do a line for each animal across 5 slices (conditions) on the x-axis?
Does this (partially) answer your question?
I agree: Stacking can be beneficial. Here is one way how that might look like in JASP (Figure 4 from the article).

September 22, 2025 at 2:17 PM
I agree: Stacking can be beneficial. Here is one way how that might look like in JASP (Figure 4 from the article).
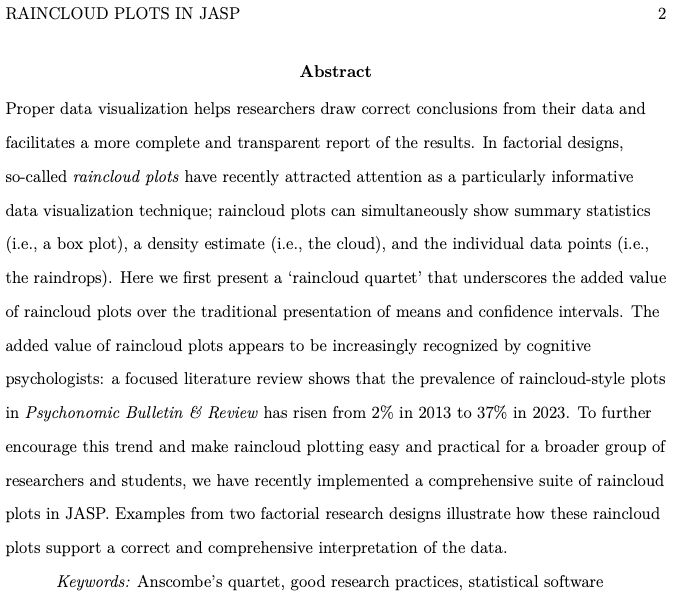
New paper for anyone working with data:
Better data viz - for free, in few clicks.
Below, all N = 111, M = 0.04, SD = 0.27.
One-sided t-tests vs. 0 yield: t(110) = 1.67, p = .049.
Use raincloud plots. Or risk wrong conclusions!
Plot w/ @jaspstats.bsky.social today!
🧪 📊 #PsychSciSky #StatsSky
🧵👇
Better data viz - for free, in few clicks.
Below, all N = 111, M = 0.04, SD = 0.27.
One-sided t-tests vs. 0 yield: t(110) = 1.67, p = .049.
Use raincloud plots. Or risk wrong conclusions!
Plot w/ @jaspstats.bsky.social today!
🧪 📊 #PsychSciSky #StatsSky
🧵👇


August 29, 2025 at 2:10 PM
New paper for anyone working with data:
Better data viz - for free, in few clicks.
Below, all N = 111, M = 0.04, SD = 0.27.
One-sided t-tests vs. 0 yield: t(110) = 1.67, p = .049.
Use raincloud plots. Or risk wrong conclusions!
Plot w/ @jaspstats.bsky.social today!
🧪 📊 #PsychSciSky #StatsSky
🧵👇
Better data viz - for free, in few clicks.
Below, all N = 111, M = 0.04, SD = 0.27.
One-sided t-tests vs. 0 yield: t(110) = 1.67, p = .049.
Use raincloud plots. Or risk wrong conclusions!
Plot w/ @jaspstats.bsky.social today!
🧪 📊 #PsychSciSky #StatsSky
🧵👇

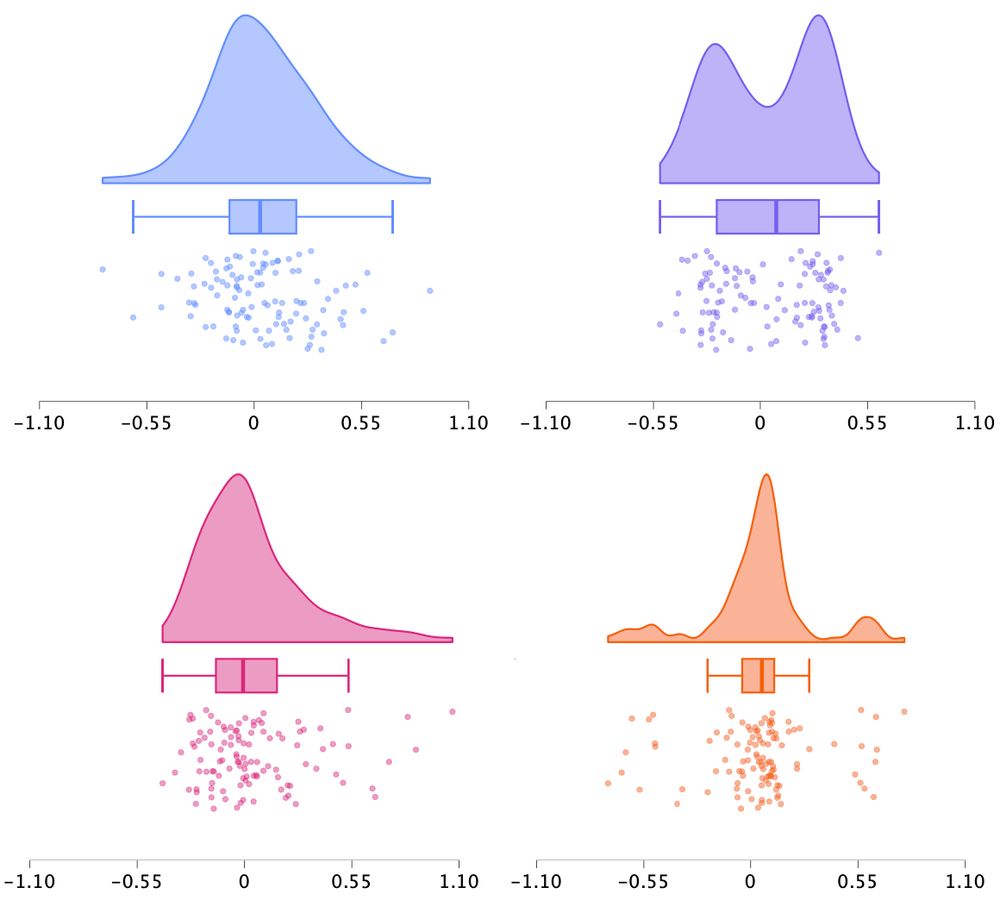
The Raincloud Quartet (new pre-print)
All N = 111, M = 0.04, SD = 0.27.
One-sided t-tests vs. 0 yield: t(110) = 1.67, p = .049.
Only raincloud plots reveal the qualitative differences, preventing the drawing of inappropriate conclusions.
How did we create the quartet?
Where are data & code?
🧵👇
All N = 111, M = 0.04, SD = 0.27.
One-sided t-tests vs. 0 yield: t(110) = 1.67, p = .049.
Only raincloud plots reveal the qualitative differences, preventing the drawing of inappropriate conclusions.
How did we create the quartet?
Where are data & code?
🧵👇
November 23, 2024 at 1:17 PM
The Raincloud Quartet (new pre-print)
All N = 111, M = 0.04, SD = 0.27.
One-sided t-tests vs. 0 yield: t(110) = 1.67, p = .049.
Only raincloud plots reveal the qualitative differences, preventing the drawing of inappropriate conclusions.
How did we create the quartet?
Where are data & code?
🧵👇
All N = 111, M = 0.04, SD = 0.27.
One-sided t-tests vs. 0 yield: t(110) = 1.67, p = .049.
Only raincloud plots reveal the qualitative differences, preventing the drawing of inappropriate conclusions.
How did we create the quartet?
Where are data & code?
🧵👇
If you only plot means & confidence intervals, you miss out.
That´s why @jaspstats.bsky.social lets you create raincloud plots in mere clicks - no programming whatsoever.
Tell your students.
YouTube tutorial: www.youtube.com/watch?v=AAdX...
🧪 #PsySciSky 📊
That´s why @jaspstats.bsky.social lets you create raincloud plots in mere clicks - no programming whatsoever.
Tell your students.
YouTube tutorial: www.youtube.com/watch?v=AAdX...
🧪 #PsySciSky 📊

November 19, 2024 at 2:02 PM
If you only plot means & confidence intervals, you miss out.
That´s why @jaspstats.bsky.social lets you create raincloud plots in mere clicks - no programming whatsoever.
Tell your students.
YouTube tutorial: www.youtube.com/watch?v=AAdX...
🧪 #PsySciSky 📊
That´s why @jaspstats.bsky.social lets you create raincloud plots in mere clicks - no programming whatsoever.
Tell your students.
YouTube tutorial: www.youtube.com/watch?v=AAdX...
🧪 #PsySciSky 📊
Our article is an Editor´s Choice!
We modeled how well people remember source information for to-be-forgotten words that are unintentionally remembered.
I explain the attached abstract and central plot below.👇
Read the full article for free here: psycnet.apa.org/fulltext/202...
#PsySciSky 🧪 📊
We modeled how well people remember source information for to-be-forgotten words that are unintentionally remembered.
I explain the attached abstract and central plot below.👇
Read the full article for free here: psycnet.apa.org/fulltext/202...
#PsySciSky 🧪 📊


November 15, 2024 at 11:14 AM
Our article is an Editor´s Choice!
We modeled how well people remember source information for to-be-forgotten words that are unintentionally remembered.
I explain the attached abstract and central plot below.👇
Read the full article for free here: psycnet.apa.org/fulltext/202...
#PsySciSky 🧪 📊
We modeled how well people remember source information for to-be-forgotten words that are unintentionally remembered.
I explain the attached abstract and central plot below.👇
Read the full article for free here: psycnet.apa.org/fulltext/202...
#PsySciSky 🧪 📊
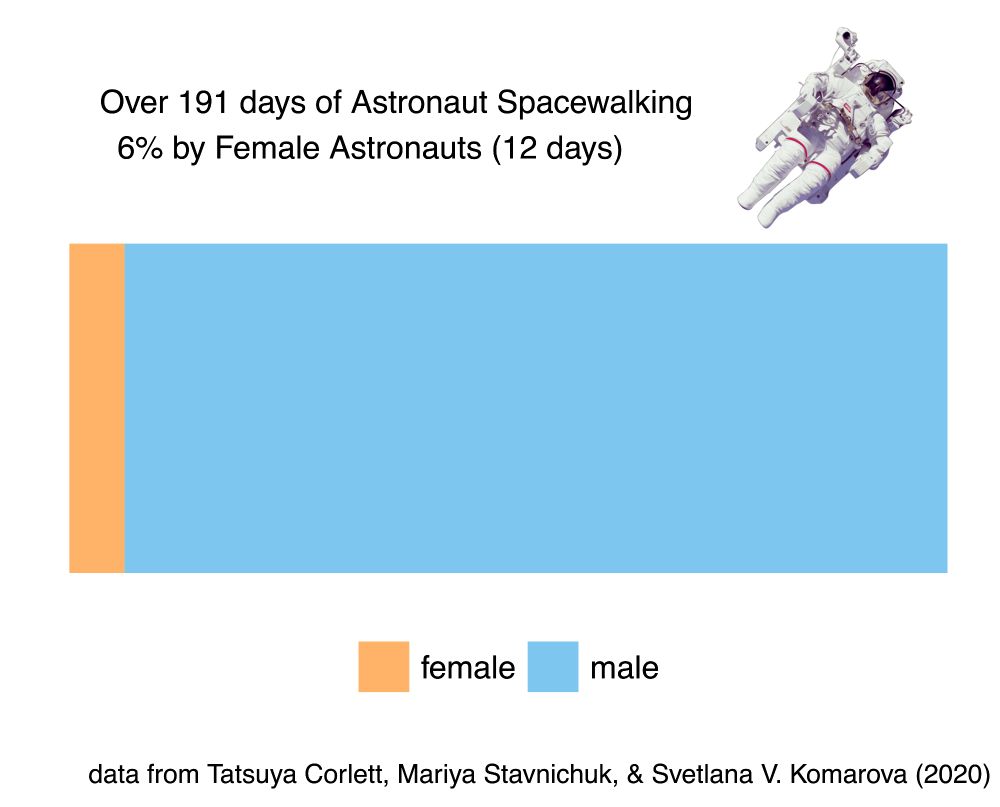
Women have spacewalked less than men. Spacewalks are astronaut activities in outer space outside of spacecrafts.
🏳️🌈-note: dataset only had "female" and "male" datapoints
🧪 #space #astronomy #dataviz #rstats
more info below 👇
🏳️🌈-note: dataset only had "female" and "male" datapoints
🧪 #space #astronomy #dataviz #rstats
more info below 👇

October 15, 2024 at 10:54 AM
Women have spacewalked less than men. Spacewalks are astronaut activities in outer space outside of spacecrafts.
🏳️🌈-note: dataset only had "female" and "male" datapoints
🧪 #space #astronomy #dataviz #rstats
more info below 👇
🏳️🌈-note: dataset only had "female" and "male" datapoints
🧪 #space #astronomy #dataviz #rstats
more info below 👇
@zeit.de [german newspaper] you rate stuff on a dimension from “lame” to “nice”.
Merriam-Webster considers “lame” as “occasionally […] offensive“.
Do you consider the term offensive in the context of your rating?
link to rating/plot:
www.zeit.de/digital/mobi...
#dataviz #linguistics #etymology
Merriam-Webster considers “lame” as “occasionally […] offensive“.
Do you consider the term offensive in the context of your rating?
link to rating/plot:
www.zeit.de/digital/mobi...
#dataviz #linguistics #etymology


October 12, 2024 at 9:54 AM
@zeit.de [german newspaper] you rate stuff on a dimension from “lame” to “nice”.
Merriam-Webster considers “lame” as “occasionally […] offensive“.
Do you consider the term offensive in the context of your rating?
link to rating/plot:
www.zeit.de/digital/mobi...
#dataviz #linguistics #etymology
Merriam-Webster considers “lame” as “occasionally […] offensive“.
Do you consider the term offensive in the context of your rating?
link to rating/plot:
www.zeit.de/digital/mobi...
#dataviz #linguistics #etymology
My R is currently running a simulation so I cant verify the following approach:
ChatGPT recommended using geom_errorbar() in combination with geom_box(). And I have been successful with geom_errorbar() is the past for customizing boxes. So might work.
Great data viz question, thanks for posting!
ChatGPT recommended using geom_errorbar() in combination with geom_box(). And I have been successful with geom_errorbar() is the past for customizing boxes. So might work.
Great data viz question, thanks for posting!

October 9, 2024 at 10:43 AM
My R is currently running a simulation so I cant verify the following approach:
ChatGPT recommended using geom_errorbar() in combination with geom_box(). And I have been successful with geom_errorbar() is the past for customizing boxes. So might work.
Great data viz question, thanks for posting!
ChatGPT recommended using geom_errorbar() in combination with geom_box(). And I have been successful with geom_errorbar() is the past for customizing boxes. So might work.
Great data viz question, thanks for posting!
Stats Puzzle in The Guardian:
www.theguardian.com/science/2024...
#stats 🧪
I used #rstats to come up with an answer.
www.theguardian.com/science/2024...
#stats 🧪
I used #rstats to come up with an answer.

September 30, 2024 at 12:55 PM
Stats Puzzle in The Guardian:
www.theguardian.com/science/2024...
#stats 🧪
I used #rstats to come up with an answer.
www.theguardian.com/science/2024...
#stats 🧪
I used #rstats to come up with an answer.
We won the IgNobel Prize in Probability for 350,757 coin flips.
František Bartoš and EJ Wagenmakers received the prize yesterday on behalf the 50-author team.
Fair coins tend to land on the same side they started on (probability = 50.8%).
🧪 #StatsSky #PsychSciSky
More info below. 👇
František Bartoš and EJ Wagenmakers received the prize yesterday on behalf the 50-author team.
Fair coins tend to land on the same side they started on (probability = 50.8%).
🧪 #StatsSky #PsychSciSky
More info below. 👇

September 13, 2024 at 2:31 PM
We won the IgNobel Prize in Probability for 350,757 coin flips.
František Bartoš and EJ Wagenmakers received the prize yesterday on behalf the 50-author team.
Fair coins tend to land on the same side they started on (probability = 50.8%).
🧪 #StatsSky #PsychSciSky
More info below. 👇
František Bartoš and EJ Wagenmakers received the prize yesterday on behalf the 50-author team.
Fair coins tend to land on the same side they started on (probability = 50.8%).
🧪 #StatsSky #PsychSciSky
More info below. 👇
Better source memory for remembered to-be-forgotten items than for remembered to-be-remembered items.
An incredibly fun project with Johanna Höhs & Jan Rummel
to which Johanna and I contributed equally.
Read more here: doi.org/10.1037/xlm0001362
(or pre-formatted version: osf.io/mg8ed/)
An incredibly fun project with Johanna Höhs & Jan Rummel
to which Johanna and I contributed equally.
Read more here: doi.org/10.1037/xlm0001362
(or pre-formatted version: osf.io/mg8ed/)


June 17, 2024 at 6:27 AM
Better source memory for remembered to-be-forgotten items than for remembered to-be-remembered items.
An incredibly fun project with Johanna Höhs & Jan Rummel
to which Johanna and I contributed equally.
Read more here: doi.org/10.1037/xlm0001362
(or pre-formatted version: osf.io/mg8ed/)
An incredibly fun project with Johanna Höhs & Jan Rummel
to which Johanna and I contributed equally.
Read more here: doi.org/10.1037/xlm0001362
(or pre-formatted version: osf.io/mg8ed/)