


VisualEcon
@visualizingeconomics.com
Making beautiful data visualizations about the economy since 2004, lurking on the internet since 1990.


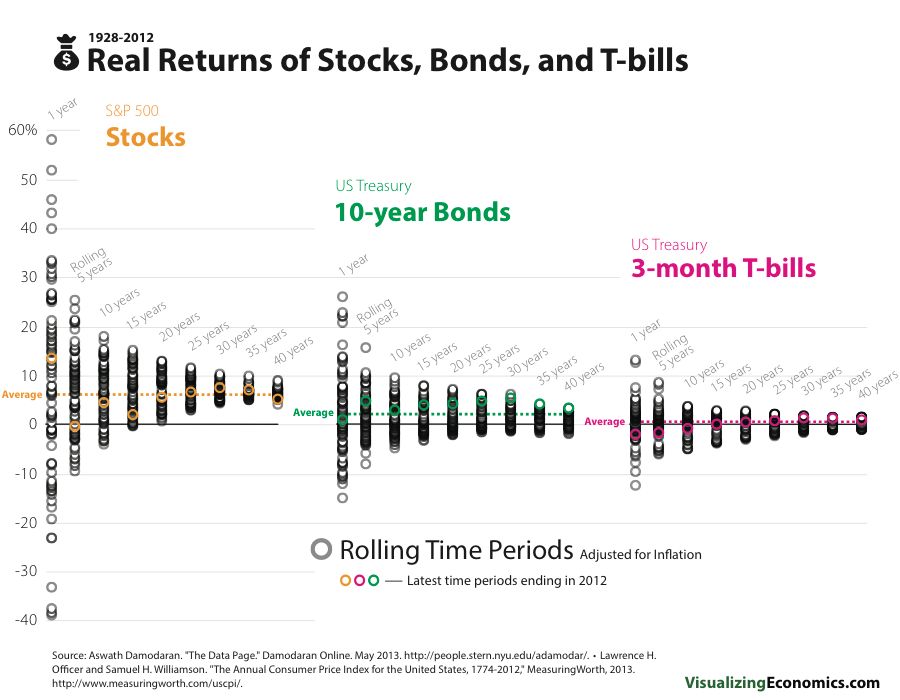
Revisiting the same data, I take the inflation-adjusted 1 year returns on stocks, 10-bonds, t-bills and compare it to buying and holding for 5 years, 10, 15, 20, 25, 30, 35, 40 years during 1928-2012 using rolling time periods (e.g. rolling 5-year returns: 1928-1933, 1929-1934, 1930-1935 etc…)
February 2, 2025 at 8:20 PM
Revisiting the same data, I take the inflation-adjusted 1 year returns on stocks, 10-bonds, t-bills and compare it to buying and holding for 5 years, 10, 15, 20, 25, 30, 35, 40 years during 1928-2012 using rolling time periods (e.g. rolling 5-year returns: 1928-1933, 1929-1934, 1930-1935 etc…)
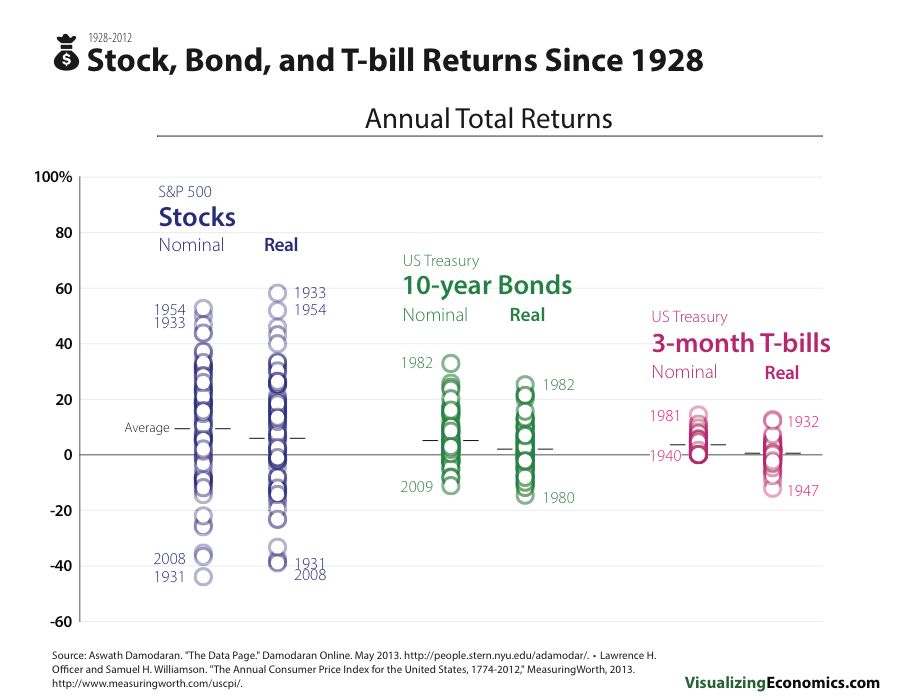
This is a question I am trying to answer for myself. Not a financial advisor just someone who has worked in finance. This is a graph I made in 2013 showing the volatility of annual returns between 1929-2012 for US stocks US Treasury 10-year bonds and US Treasury 3-month bills. Each Circle = One Year
February 2, 2025 at 7:39 PM
This is a question I am trying to answer for myself. Not a financial advisor just someone who has worked in finance. This is a graph I made in 2013 showing the volatility of annual returns between 1929-2012 for US stocks US Treasury 10-year bonds and US Treasury 3-month bills. Each Circle = One Year
I am apparently a Bluesky elder

September 17, 2024 at 2:02 AM
I am apparently a Bluesky elder
If you see this, post a photo you took at sunset:

June 17, 2024 at 2:18 AM
If you see this, post a photo you took at sunset: