


Urban Data
@urban-data.bsky.social
Official social media for the Urban Data working group. Researchers at the intersection of data, cities, people, and space. Read more and join us at https://urban-data-science-eaamo.github.io
"Day 15 immediately caught my interest because it prompted reflection on energy consumption. I was also curious to experiment with kepler.gl to explore Uganda’s Census findings. When I connected fire with cooking and energy with the electricity grid, the theme felt like a perfect match," says Sylvia
November 21, 2025 at 6:35 PM
"Day 15 immediately caught my interest because it prompted reflection on energy consumption. I was also curious to experiment with kepler.gl to explore Uganda’s Census findings. When I connected fire with cooking and energy with the electricity grid, the theme felt like a perfect match," says Sylvia
They say: "We softly overlap point locations of these ladrilleras across Mexico (downloaded from DENUE) and scores for proximity to these kilns across the country, computed as the total inverse distance each ladrillera. This score is presented for each 50km point across the country, on a log-scale."
November 15, 2025 at 5:19 PM
They say: "We softly overlap point locations of these ladrilleras across Mexico (downloaded from DENUE) and scores for proximity to these kilns across the country, computed as the total inverse distance each ladrillera. This score is presented for each 50km point across the country, on a log-scale."
You can play with the map, visualizing individual points rather than cells or hiding chain coffee shops, at the link: gsagostini.github.io/documents/ma...
NYC Coffee Shop Density — World Urbanism Day (D3)
gsagostini.github.io
November 14, 2025 at 5:09 PM
You can play with the map, visualizing individual points rather than cells or hiding chain coffee shops, at the link: gsagostini.github.io/documents/ma...
Gabriel writes: "Many accessibility works do a great job at quantifying disparate access to a single type of service. But urban access implies a relative ordering of things close and far to you. This is a cheeky title that proposes a spatial relationship between transit and food deserts."
November 13, 2025 at 2:27 PM
Gabriel writes: "Many accessibility works do a great job at quantifying disparate access to a single type of service. But urban access implies a relative ordering of things close and far to you. This is a cheeky title that proposes a spatial relationship between transit and food deserts."

ArcGIS Maps SDK in Unity (Testing Samples)
YouTube video by Atmika Pai
www.youtube.com
November 12, 2025 at 6:40 PM
"I wanted to step into a designer's shoes and see what tools are available to them, so I chose to set up ArcGIS Maps SDK for Unity and explore their sample project. The 3rd-person controller lets you navigate cities as a character, while the viewshed analysis calculates sight lines from any point."
Jennah says "I was interested in examining how historical wetlands in the city correspond to modern-day flooding risk. I was inspired by articles that came out shortly after Hurricane Ida, and my own experience with flooding in Hurricane Sandy."
Data comes from the Welikia Project
www.welikia.org
Data comes from the Welikia Project
www.welikia.org

The Welikia Project
Explore the landscape before New York.
www.welikia.org
November 11, 2025 at 5:01 PM
Jennah says "I was interested in examining how historical wetlands in the city correspond to modern-day flooding risk. I was inspired by articles that came out shortly after Hurricane Ida, and my own experience with flooding in Hurricane Sandy."
Data comes from the Welikia Project
www.welikia.org
Data comes from the Welikia Project
www.welikia.org
During the conference, we asked people to ping themselves on a collaborative map. We augmented this data with affiliation data from authors and presenters. Our data, rather than "my" data, maybe?
November 11, 2025 at 4:05 PM
During the conference, we asked people to ping themselves on a collaborative map. We augmented this data with affiliation data from authors and presenters. Our data, rather than "my" data, maybe?
Atmika writes:
"This Minard-style flow map shows how COVID-19 affected Roosevelt Island Tramway ridership. From December 2020 onwards, tram ridership data is no longer reported—newer MTA datasets omit it entirely, highlighting a gap in data continuity."
"This Minard-style flow map shows how COVID-19 affected Roosevelt Island Tramway ridership. From December 2020 onwards, tram ridership data is no longer reported—newer MTA datasets omit it entirely, highlighting a gap in data continuity."
November 6, 2025 at 5:33 PM
Atmika writes:
"This Minard-style flow map shows how COVID-19 affected Roosevelt Island Tramway ridership. From December 2020 onwards, tram ridership data is no longer reported—newer MTA datasets omit it entirely, highlighting a gap in data continuity."
"This Minard-style flow map shows how COVID-19 affected Roosevelt Island Tramway ridership. From December 2020 onwards, tram ridership data is no longer reported—newer MTA datasets omit it entirely, highlighting a gap in data continuity."
Gabriel writes:
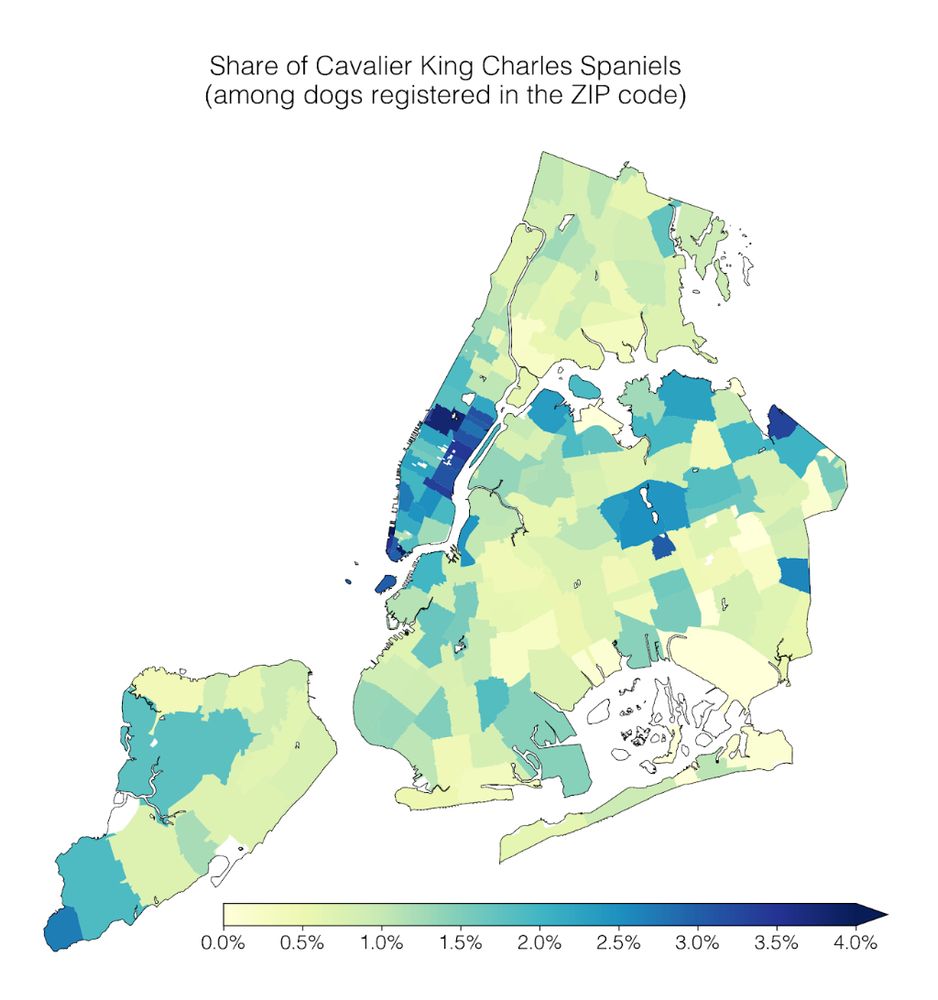
"Back in April, lots of students in my lab took a day to study dog as data. That was our #dogathon. We focused a lot on dog names + breeds, this is yet another fun map I wanted to create. In our thread you can find more map, plots, and dog park simulators."
bsky.app/profile/kenn...
"Back in April, lots of students in my lab took a day to study dog as data. That was our #dogathon. We focused a lot on dog names + breeds, this is yet another fun map I wanted to create. In our thread you can find more map, plots, and dog park simulators."
bsky.app/profile/kenn...

Our lab had a #dogathon 🐕 yesterday where we analyzed NYC Open Data on dog licenses. We learned a lot of dog facts, which I’ll share in this thread 🧵
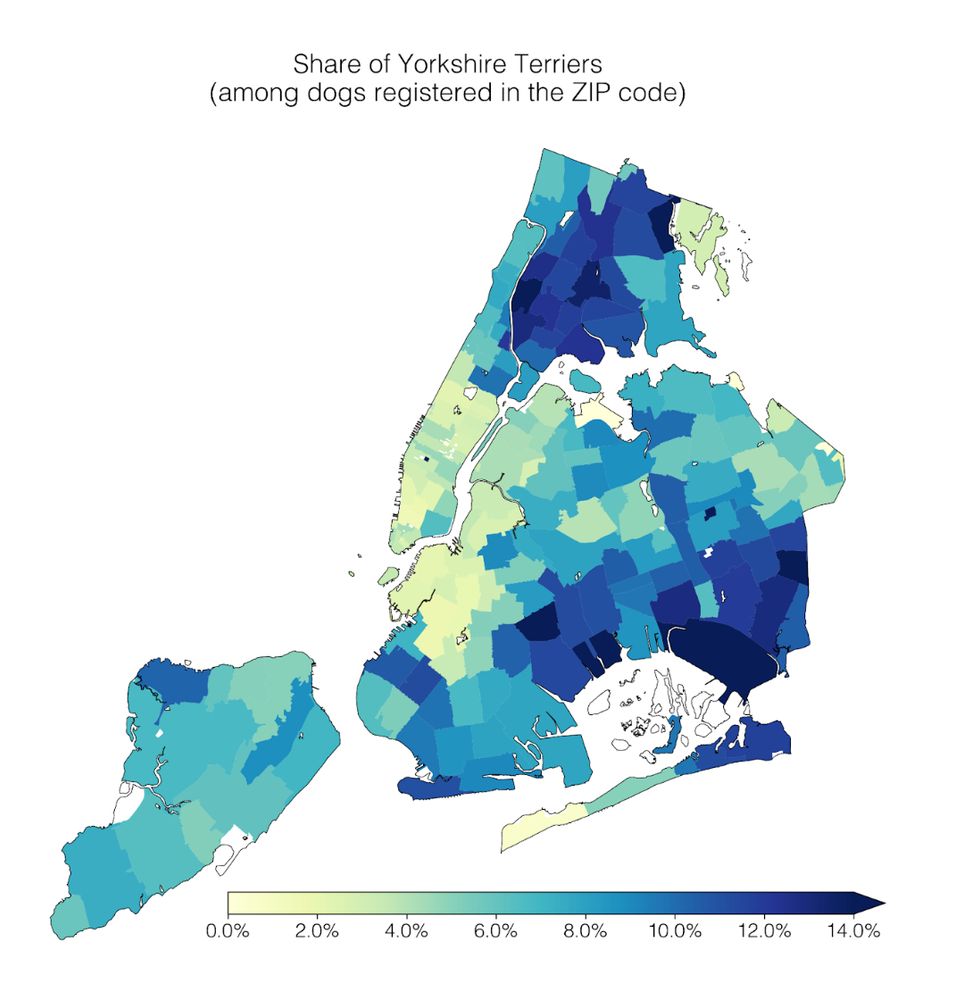
1) Geospatial trends: Cavalier King Charles Spaniels are common in Manhattan; the opposite is true for Yorkshire Terriers.
1) Geospatial trends: Cavalier King Charles Spaniels are common in Manhattan; the opposite is true for Yorkshire Terriers.
November 6, 2025 at 5:18 PM
Gabriel writes:
"Back in April, lots of students in my lab took a day to study dog as data. That was our #dogathon. We focused a lot on dog names + breeds, this is yet another fun map I wanted to create. In our thread you can find more map, plots, and dog park simulators."
bsky.app/profile/kenn...
"Back in April, lots of students in my lab took a day to study dog as data. That was our #dogathon. We focused a lot on dog names + breeds, this is yet another fun map I wanted to create. In our thread you can find more map, plots, and dog park simulators."
bsky.app/profile/kenn...