


Sunil Nagaraj
@sunilnagaraj.bsky.social
Founder of https://weathersight.io , a website to discover, create and share reliable weather statistics and charts. Software Engineer based in Silicon Valley.
Pinned
Sunil Nagaraj
@sunilnagaraj.bsky.social
· Nov 20
Reposted by Sunil Nagaraj

I wanted to offer some thoughts on the Gates climate memo that has been circulating this week. While I can't directly speak for others, I can say that my own response is one of dismay & deep frustration (and that this view is shared by many climate/Earth scientists). [1/n]
October 30, 2025 at 5:02 PM
I wanted to offer some thoughts on the Gates climate memo that has been circulating this week. While I can't directly speak for others, I can say that my own response is one of dismay & deep frustration (and that this view is shared by many climate/Earth scientists). [1/n]
Now it is possible to interactively find weather events that fit multiple criteria. e.g. For a given location, days where temp *and* dew point > p95, say to interactively detect humid heat waves. You can define thresholds on multiple params and they can be abs vals, % or std devs. t.co/gb4ND26k5D

March 4, 2025 at 2:45 AM
Now it is possible to interactively find weather events that fit multiple criteria. e.g. For a given location, days where temp *and* dew point > p95, say to interactively detect humid heat waves. You can define thresholds on multiple params and they can be abs vals, % or std devs. t.co/gb4ND26k5D
Reposted by Sunil Nagaraj

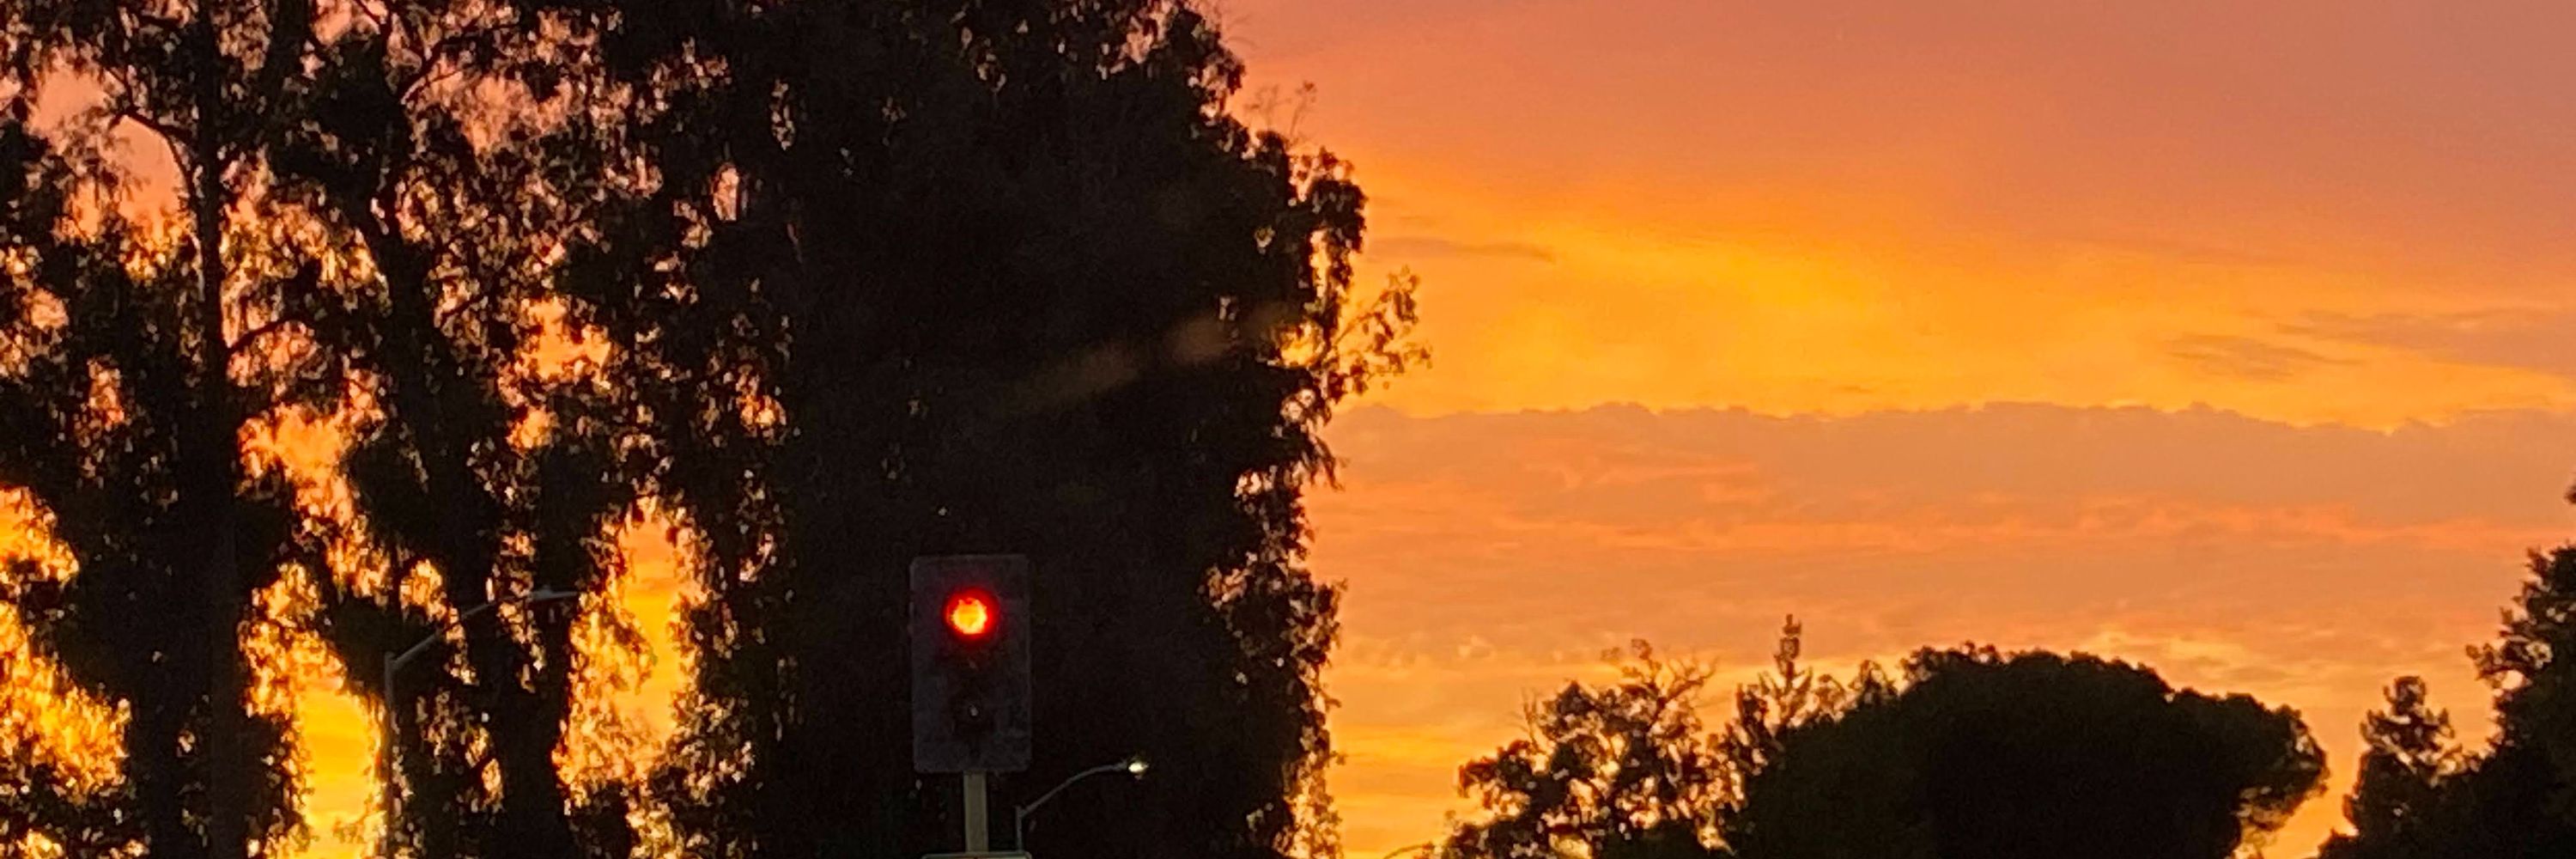
California’s fire season has lengthened considerably in a warming climate, which has increased the overlap between “critically dry vegetation season” and the Santa Ana “offshore wind season” (Oct-Jan). A hotter climate also dries out vegetation.
yaleclimateconnections.org/2025/01/the-...
yaleclimateconnections.org/2025/01/the-...
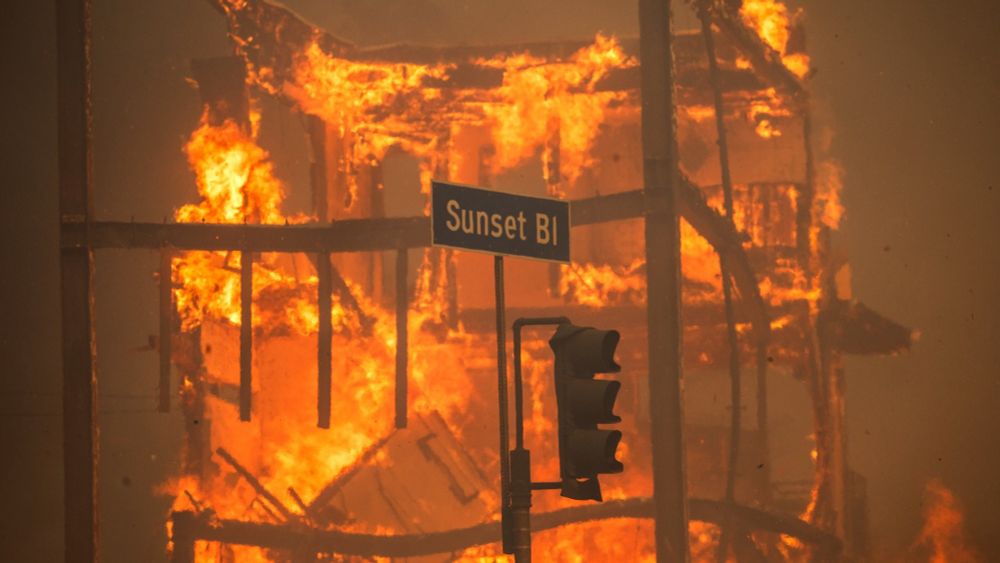
The role of climate change in the catastrophic 2025 Los Angeles fires » Yale Climate Connections
Summer dry seasons are extending into winter, intensifying the impacts of Santa Ana winds.
yaleclimateconnections.org
January 9, 2025 at 6:52 PM
California’s fire season has lengthened considerably in a warming climate, which has increased the overlap between “critically dry vegetation season” and the Santa Ana “offshore wind season” (Oct-Jan). A hotter climate also dries out vegetation.
yaleclimateconnections.org/2025/01/the-...
yaleclimateconnections.org/2025/01/the-...
2024. An extraordinarily warm year. To pinpoint areas with heat-waves, a proxy is to look at the deviation of the 90th percentile of mean temperature from its historical average. Those with >=1°C (Left, heat-waves) , < 0.5°C (Right, cold-spells). 👇 #weatheranalytics


December 20, 2024 at 9:56 PM
2024. An extraordinarily warm year. To pinpoint areas with heat-waves, a proxy is to look at the deviation of the 90th percentile of mean temperature from its historical average. Those with >=1°C (Left, heat-waves) , < 0.5°C (Right, cold-spells). 👇 #weatheranalytics
Reposted by Sunil Nagaraj

Global warming may make La Niña events harder to detect, but scientists are adapting. Or, why you'll start hearing more about the "Relative ENSO index" in coming years. www.axios.com/2024/12/20/c...

Global warming may make La Niña harder to detect
These events occur in the context of a widespread spike in ocean temperatures.
www.axios.com
December 20, 2024 at 6:53 PM
Global warming may make La Niña events harder to detect, but scientists are adapting. Or, why you'll start hearing more about the "Relative ENSO index" in coming years. www.axios.com/2024/12/20/c...
Reposted by Sunil Nagaraj

A mid-winter "dry spell" is more the rule than the exception in northern/central California. Over the past 74 years, there is on average a 21-day dry spell during Dec & Jan, with a median of 17.5 days. With no rain until about the 14th (?), the current dry period will be 18 days.

December 6, 2024 at 7:41 PM
A mid-winter "dry spell" is more the rule than the exception in northern/central California. Over the past 74 years, there is on average a 21-day dry spell during Dec & Jan, with a median of 17.5 days. With no rain until about the 14th (?), the current dry period will be 18 days.
Northern California Nov 20 2024. Widespread heavy rain was recorded (Fig 1) as forecast. Santa Rosa, no stranger to 4" (100mm) daily totals, recorded 173 mm (~6.9 inches) , a ~ 1-in-30 yr event (Fig 2 and Fig 3) . #cawx #AtmosphericRiver


November 21, 2024 at 5:25 PM
Northern California Nov 20 2024. Widespread heavy rain was recorded (Fig 1) as forecast. Santa Rosa, no stranger to 4" (100mm) daily totals, recorded 173 mm (~6.9 inches) , a ~ 1-in-30 yr event (Fig 2 and Fig 3) . #cawx #AtmosphericRiver
"There are so many instances of heavy rain, it is hard to keep track". We have built tools to do that and more. (Fig: Asia with more than 5 inches (125mm) of rain in 24hr period in 2024). Create your own visualizations with reliable weather statistics. Sign up to receive alerts/reports. #weather 👇

November 20, 2024 at 6:22 PM
"There are so many instances of heavy rain, it is hard to keep track". We have built tools to do that and more. (Fig: Asia with more than 5 inches (125mm) of rain in 24hr period in 2024). Create your own visualizations with reliable weather statistics. Sign up to receive alerts/reports. #weather 👇
Delhi, Nov 2024. The humidity levels during the first weeks of Nov have been the highest.(Fig 1). The mean dew point depression (the diff between air temp and dew point) has been one of the lowest - persistent fog was on the cards. (Fig 2). Significant +trend of moist air. 🧵 #delhifog #delhi


November 20, 2024 at 3:46 AM
Reposted by Sunil Nagaraj
As of 7 a.m. EST Friday, La Ceiba, located on the north central coast of Honduras, recorded a 24-hour rainfall amount of 556 mm (21.89"). The city's Saopín Bridge collapsed (x.com/PoliciaHondu...)
www.ogimet.com/cgi-bin/gsyn...
www.ogimet.com/cgi-bin/gsyn...
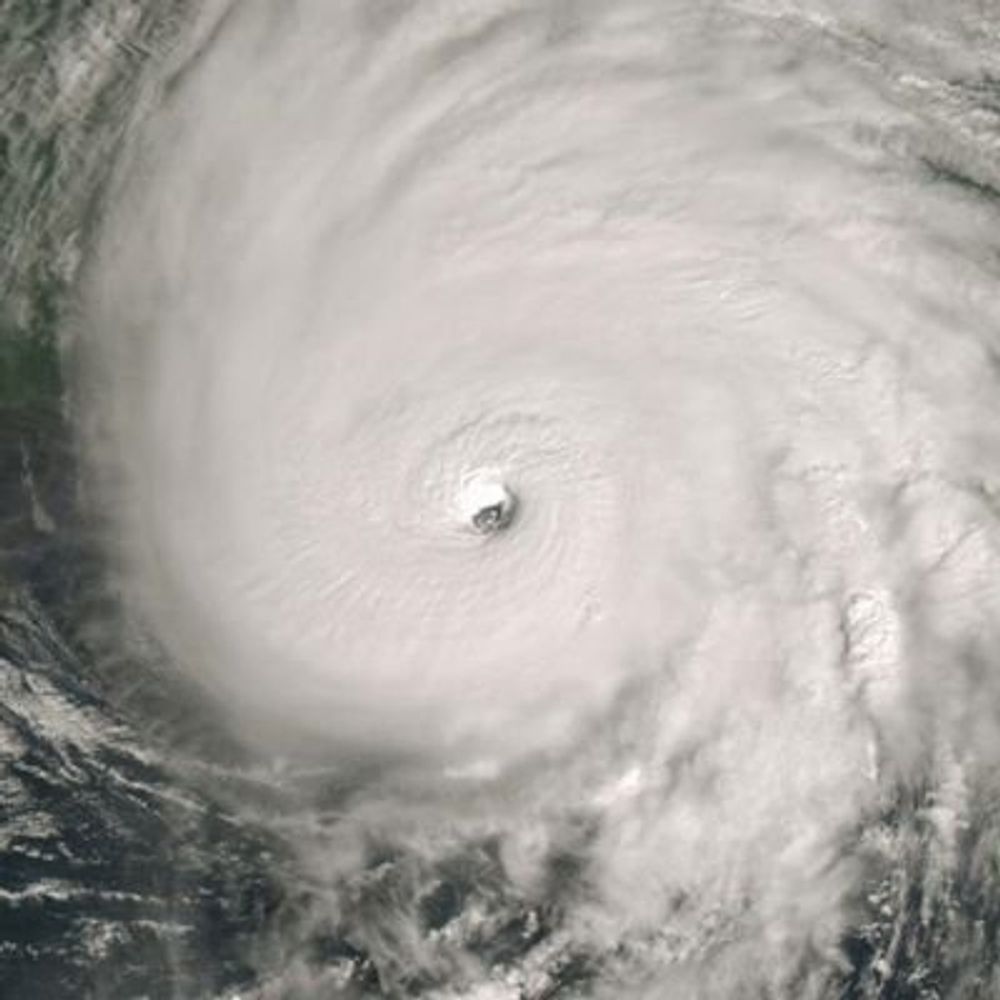
#Sara is inland now & is unlikely to strengthen much from here. However even as a tropical storm it is still dangerous. Its slow movement near high terrain means heavy rain from upslope flow in Honduras. Flash flooding and mudslides are risks with up to 20 inches of rain falling in the next few days


November 15, 2024 at 2:46 PM
As of 7 a.m. EST Friday, La Ceiba, located on the north central coast of Honduras, recorded a 24-hour rainfall amount of 556 mm (21.89"). The city's Saopín Bridge collapsed (x.com/PoliciaHondu...)
www.ogimet.com/cgi-bin/gsyn...
www.ogimet.com/cgi-bin/gsyn...
Numerous annual (all months) weather records were set in 2024. While most headlines were about daytime 'highs' (image: left), a much larger number of overnight low records (image: centre) were observed. It was also a notably humid year in many cities suffered their worst humid heat (img: right). 🧵


November 14, 2024 at 9:32 PM
Numerous annual (all months) weather records were set in 2024. While most headlines were about daytime 'highs' (image: left), a much larger number of overnight low records (image: centre) were observed. It was also a notably humid year in many cities suffered their worst humid heat (img: right). 🧵
Reposted by Sunil Nagaraj

October 2024 in Puerto Rico was another record hot month.
Average temperature was 85.6F/29.8C, +2.8F above normal and it beat 2023 as the hottest October,like almost all months of the year.
Record heat in Puerto Rico has been relentless and off charts for nearly 2 years.
Graph by NOAA
Average temperature was 85.6F/29.8C, +2.8F above normal and it beat 2023 as the hottest October,like almost all months of the year.
Record heat in Puerto Rico has been relentless and off charts for nearly 2 years.
Graph by NOAA

November 11, 2024 at 1:59 PM
October 2024 in Puerto Rico was another record hot month.
Average temperature was 85.6F/29.8C, +2.8F above normal and it beat 2023 as the hottest October,like almost all months of the year.
Record heat in Puerto Rico has been relentless and off charts for nearly 2 years.
Graph by NOAA
Average temperature was 85.6F/29.8C, +2.8F above normal and it beat 2023 as the hottest October,like almost all months of the year.
Record heat in Puerto Rico has been relentless and off charts for nearly 2 years.
Graph by NOAA
During which months or seasons has your city experienced the most significant weather changes?
I attempted to answer this question with 40+ years data (observations and reanalysis). For Washington DC. (Sep,Oct, Dec). #climatechange #dataviz #weather 🧵 . Any pointers to similar data/publications?
I attempted to answer this question with 40+ years data (observations and reanalysis). For Washington DC. (Sep,Oct, Dec). #climatechange #dataviz #weather 🧵 . Any pointers to similar data/publications?


November 11, 2024 at 7:35 PM
During which months or seasons has your city experienced the most significant weather changes?
I attempted to answer this question with 40+ years data (observations and reanalysis). For Washington DC. (Sep,Oct, Dec). #climatechange #dataviz #weather 🧵 . Any pointers to similar data/publications?
I attempted to answer this question with 40+ years data (observations and reanalysis). For Washington DC. (Sep,Oct, Dec). #climatechange #dataviz #weather 🧵 . Any pointers to similar data/publications?
Japan 2024. Many cities recorded their warmest October. This continues the 2024 trend of several cities across the country (Nagasaki, Hakodate, Hamamatsu) experiencing many 'record warm months' - in Feb/Mar & Jul-Oct. It was also one of their most humid, with more Tmin records than any other. 🧵


November 11, 2024 at 6:58 PM
Japan 2024. Many cities recorded their warmest October. This continues the 2024 trend of several cities across the country (Nagasaki, Hakodate, Hamamatsu) experiencing many 'record warm months' - in Feb/Mar & Jul-Oct. It was also one of their most humid, with more Tmin records than any other. 🧵