


Sofia Lazar
@sofialazar.bsky.social
M. Sc in Water Resources💧 | Eng in Structures Construction, Civil Engineering Hydraulics 🏗️ | Water Allocation - Quality Modelling 🌡️ | Data Visualization ✨| GIS 🌐 | R 📊 | Python 🐍
🇧🇷 L🅐🅝🅓 P🅡🅞🅓🅤🅒🅣🅘🅥🅘🅣🅨 D🅨🅝🅐🅜🅘🅒🅢 🅘🅝 B🅡🅐🅩🅘🅛
𝖦𝗋𝖾𝖾𝗇𝗂𝗇𝗀 𝗂𝗇 𝗍𝗁𝖾 𝖠𝗆𝖺𝗓𝗈𝗇 & 𝗌𝗈𝗎𝗍𝗁 𝗌𝗁𝗈𝗐𝗌 𝗋𝗂𝗌𝗂𝗇𝗀 𝗉𝗋𝗈𝖽𝗎𝖼𝗍𝗂𝗏𝗂𝗍𝗒 🌱
𝖡𝗎𝗍 𝗈𝗋𝖺𝗇𝗀𝖾 & 𝗒𝖾𝗅𝗅𝗈𝗐 𝗓𝗈𝗇𝖾𝗌 𝗋𝖾𝗏𝖾𝖺𝗅 𝗌𝗍𝗋𝖾𝗌𝗌 𝖽𝖾𝖿𝗈𝗋𝖾𝗌𝗍𝖺𝗍𝗂𝗈𝗇, 𝖽𝗋𝗈𝗎𝗀𝗁𝗍 & 𝖼𝗅𝗂𝗆𝖺𝗍𝖾 𝗉𝗋𝖾𝗌𝗌𝗎𝗋𝖾 𝗋𝖾𝖽𝗎𝖼𝗂𝗇𝗀 𝗋𝖾𝗌𝗂𝗅𝗂𝖾𝗇𝖼𝖾 🌾🔥
𝖧𝗈𝗐 ? 𝗌𝖾𝖾 @milos-makes-maps.bsky.social 𝗍𝗎𝗍
#𝖫𝖺𝗇𝖽𝖣𝖾𝗀𝗋𝖺𝖽𝖺𝗍𝗂𝗈𝗇 #𝖡𝗋𝖺𝗓𝗂𝗅 #𝖤𝖺𝗋𝗍𝗁𝖮𝖻𝗌𝖾𝗋𝗏𝖺𝗍𝗂𝗈𝗇 #𝖱𝗌𝗍𝖺𝗍s
𝖦𝗋𝖾𝖾𝗇𝗂𝗇𝗀 𝗂𝗇 𝗍𝗁𝖾 𝖠𝗆𝖺𝗓𝗈𝗇 & 𝗌𝗈𝗎𝗍𝗁 𝗌𝗁𝗈𝗐𝗌 𝗋𝗂𝗌𝗂𝗇𝗀 𝗉𝗋𝗈𝖽𝗎𝖼𝗍𝗂𝗏𝗂𝗍𝗒 🌱
𝖡𝗎𝗍 𝗈𝗋𝖺𝗇𝗀𝖾 & 𝗒𝖾𝗅𝗅𝗈𝗐 𝗓𝗈𝗇𝖾𝗌 𝗋𝖾𝗏𝖾𝖺𝗅 𝗌𝗍𝗋𝖾𝗌𝗌 𝖽𝖾𝖿𝗈𝗋𝖾𝗌𝗍𝖺𝗍𝗂𝗈𝗇, 𝖽𝗋𝗈𝗎𝗀𝗁𝗍 & 𝖼𝗅𝗂𝗆𝖺𝗍𝖾 𝗉𝗋𝖾𝗌𝗌𝗎𝗋𝖾 𝗋𝖾𝖽𝗎𝖼𝗂𝗇𝗀 𝗋𝖾𝗌𝗂𝗅𝗂𝖾𝗇𝖼𝖾 🌾🔥
𝖧𝗈𝗐 ? 𝗌𝖾𝖾 @milos-makes-maps.bsky.social 𝗍𝗎𝗍
#𝖫𝖺𝗇𝖽𝖣𝖾𝗀𝗋𝖺𝖽𝖺𝗍𝗂𝗈𝗇 #𝖡𝗋𝖺𝗓𝗂𝗅 #𝖤𝖺𝗋𝗍𝗁𝖮𝖻𝗌𝖾𝗋𝗏𝖺𝗍𝗂𝗈𝗇 #𝖱𝗌𝗍𝖺𝗍s

October 15, 2025 at 9:53 PM
🇧🇷 L🅐🅝🅓 P🅡🅞🅓🅤🅒🅣🅘🅥🅘🅣🅨 D🅨🅝🅐🅜🅘🅒🅢 🅘🅝 B🅡🅐🅩🅘🅛
𝖦𝗋𝖾𝖾𝗇𝗂𝗇𝗀 𝗂𝗇 𝗍𝗁𝖾 𝖠𝗆𝖺𝗓𝗈𝗇 & 𝗌𝗈𝗎𝗍𝗁 𝗌𝗁𝗈𝗐𝗌 𝗋𝗂𝗌𝗂𝗇𝗀 𝗉𝗋𝗈𝖽𝗎𝖼𝗍𝗂𝗏𝗂𝗍𝗒 🌱
𝖡𝗎𝗍 𝗈𝗋𝖺𝗇𝗀𝖾 & 𝗒𝖾𝗅𝗅𝗈𝗐 𝗓𝗈𝗇𝖾𝗌 𝗋𝖾𝗏𝖾𝖺𝗅 𝗌𝗍𝗋𝖾𝗌𝗌 𝖽𝖾𝖿𝗈𝗋𝖾𝗌𝗍𝖺𝗍𝗂𝗈𝗇, 𝖽𝗋𝗈𝗎𝗀𝗁𝗍 & 𝖼𝗅𝗂𝗆𝖺𝗍𝖾 𝗉𝗋𝖾𝗌𝗌𝗎𝗋𝖾 𝗋𝖾𝖽𝗎𝖼𝗂𝗇𝗀 𝗋𝖾𝗌𝗂𝗅𝗂𝖾𝗇𝖼𝖾 🌾🔥
𝖧𝗈𝗐 ? 𝗌𝖾𝖾 @milos-makes-maps.bsky.social 𝗍𝗎𝗍
#𝖫𝖺𝗇𝖽𝖣𝖾𝗀𝗋𝖺𝖽𝖺𝗍𝗂𝗈𝗇 #𝖡𝗋𝖺𝗓𝗂𝗅 #𝖤𝖺𝗋𝗍𝗁𝖮𝖻𝗌𝖾𝗋𝗏𝖺𝗍𝗂𝗈𝗇 #𝖱𝗌𝗍𝖺𝗍s
𝖦𝗋𝖾𝖾𝗇𝗂𝗇𝗀 𝗂𝗇 𝗍𝗁𝖾 𝖠𝗆𝖺𝗓𝗈𝗇 & 𝗌𝗈𝗎𝗍𝗁 𝗌𝗁𝗈𝗐𝗌 𝗋𝗂𝗌𝗂𝗇𝗀 𝗉𝗋𝗈𝖽𝗎𝖼𝗍𝗂𝗏𝗂𝗍𝗒 🌱
𝖡𝗎𝗍 𝗈𝗋𝖺𝗇𝗀𝖾 & 𝗒𝖾𝗅𝗅𝗈𝗐 𝗓𝗈𝗇𝖾𝗌 𝗋𝖾𝗏𝖾𝖺𝗅 𝗌𝗍𝗋𝖾𝗌𝗌 𝖽𝖾𝖿𝗈𝗋𝖾𝗌𝗍𝖺𝗍𝗂𝗈𝗇, 𝖽𝗋𝗈𝗎𝗀𝗁𝗍 & 𝖼𝗅𝗂𝗆𝖺𝗍𝖾 𝗉𝗋𝖾𝗌𝗌𝗎𝗋𝖾 𝗋𝖾𝖽𝗎𝖼𝗂𝗇𝗀 𝗋𝖾𝗌𝗂𝗅𝗂𝖾𝗇𝖼𝖾 🌾🔥
𝖧𝗈𝗐 ? 𝗌𝖾𝖾 @milos-makes-maps.bsky.social 𝗍𝗎𝗍
#𝖫𝖺𝗇𝖽𝖣𝖾𝗀𝗋𝖺𝖽𝖺𝗍𝗂𝗈𝗇 #𝖡𝗋𝖺𝗓𝗂𝗅 #𝖤𝖺𝗋𝗍𝗁𝖮𝖻𝗌𝖾𝗋𝗏𝖺𝗍𝗂𝗈𝗇 #𝖱𝗌𝗍𝖺𝗍s
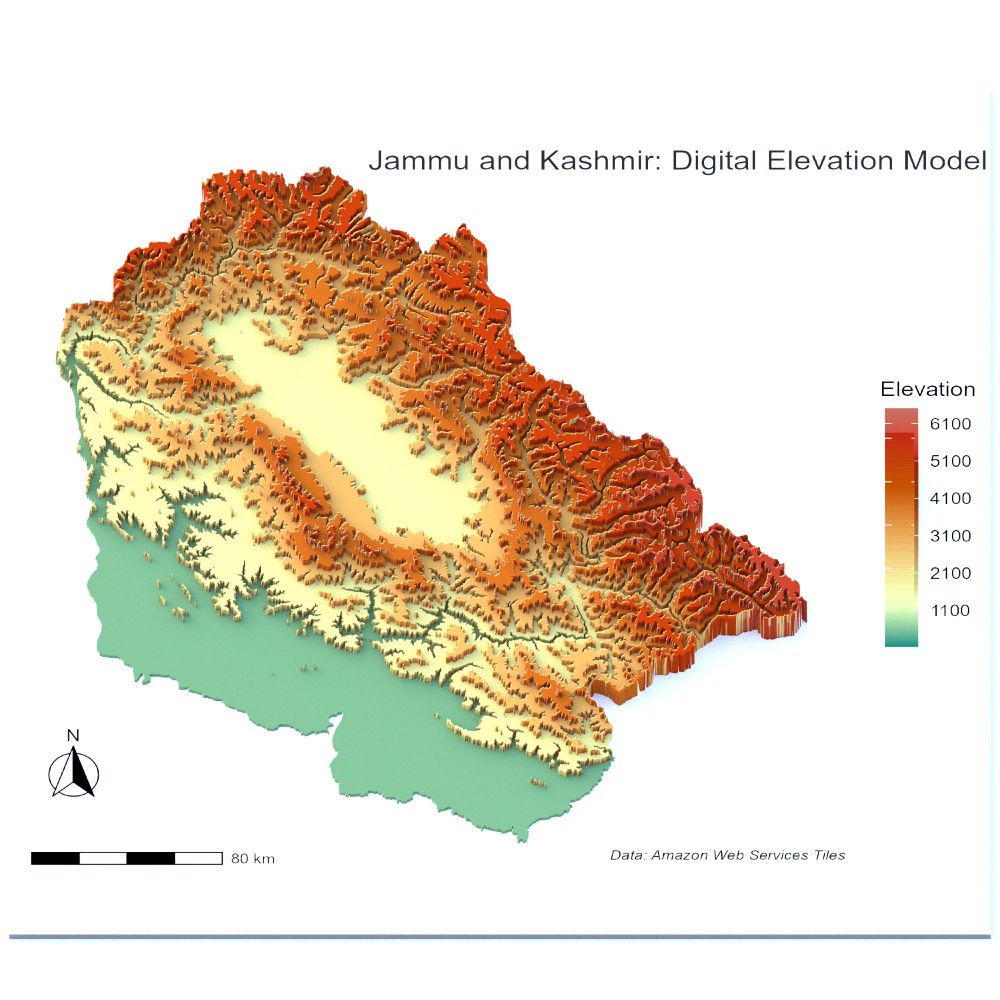
🗻 Just finished rendering this Digital Elevation Model of #Jammu & #Kashmir using #Tanaka Highlights 🎨
Loving how the technique brings out the terrain, sharp ridgelines, soft basins, and deep valleys all pop beautifully.
🔗Tut by @milos-makes-maps.bsky.social 😍
#DEM #TanakaHighlights #Cartography
Loving how the technique brings out the terrain, sharp ridgelines, soft basins, and deep valleys all pop beautifully.
🔗Tut by @milos-makes-maps.bsky.social 😍
#DEM #TanakaHighlights #Cartography
May 4, 2025 at 11:00 PM
🗻 Just finished rendering this Digital Elevation Model of #Jammu & #Kashmir using #Tanaka Highlights 🎨
Loving how the technique brings out the terrain, sharp ridgelines, soft basins, and deep valleys all pop beautifully.
🔗Tut by @milos-makes-maps.bsky.social 😍
#DEM #TanakaHighlights #Cartography
Loving how the technique brings out the terrain, sharp ridgelines, soft basins, and deep valleys all pop beautifully.
🔗Tut by @milos-makes-maps.bsky.social 😍
#DEM #TanakaHighlights #Cartography
𝖥𝗂𝗑𝖾𝖽 𝗍𝗁𝖺𝗍! 🎯
𝖲𝗐𝗂𝗉𝖾 𝗍𝗈 𝗌𝖾𝖾 𝖨𝗇𝖽𝗂𝖺'𝗌 𝗋𝗂𝗏𝖾𝗋𝗌 𝗂𝗇 𝟥𝖣.... 𝖻𝗅𝖾𝗇𝖽𝗂𝗇𝗀 𝖾𝗅𝖾𝗏𝖺𝗍𝗂𝗈𝗇, 𝗍𝗈𝗉𝗈𝗀𝗋𝖺𝗉𝗁𝗒, 𝖺𝗇𝖽 𝗁𝗒𝖽𝗋𝗈𝗅𝗈𝗀𝗒
🔥𝖥𝗎𝗇 𝖿𝖺𝖼𝗍: 𝟤𝟪𝟪𝟢 𝗋𝗂𝗏𝖾𝗋𝗌 𝖼𝗋𝗈𝗌𝗌 𝗍𝗁𝖾 𝖻𝗈𝗋𝖽𝖾𝗋𝗌, 𝖺𝗇𝖽 𝗍𝗁𝖾 𝗅𝗈𝗇𝗀𝖾𝗌𝗍 𝗉𝖺𝗍𝗁 𝗋𝗎𝗇𝗌 𝟥𝟢𝟫,𝟣𝟣𝟧 𝗄𝗆!
#𝖦𝖨𝖲 #𝖱𝗌𝗍𝖺𝗍𝗌 #𝖬𝖺𝗉𝗉𝗂𝗇𝗀 #𝖨𝗇𝖽𝗂𝖺 #𝖧𝗒𝖽𝗋𝗈𝗅𝗈𝗀𝗒
𝖲𝗐𝗂𝗉𝖾 𝗍𝗈 𝗌𝖾𝖾 𝖨𝗇𝖽𝗂𝖺'𝗌 𝗋𝗂𝗏𝖾𝗋𝗌 𝗂𝗇 𝟥𝖣.... 𝖻𝗅𝖾𝗇𝖽𝗂𝗇𝗀 𝖾𝗅𝖾𝗏𝖺𝗍𝗂𝗈𝗇, 𝗍𝗈𝗉𝗈𝗀𝗋𝖺𝗉𝗁𝗒, 𝖺𝗇𝖽 𝗁𝗒𝖽𝗋𝗈𝗅𝗈𝗀𝗒
🔥𝖥𝗎𝗇 𝖿𝖺𝖼𝗍: 𝟤𝟪𝟪𝟢 𝗋𝗂𝗏𝖾𝗋𝗌 𝖼𝗋𝗈𝗌𝗌 𝗍𝗁𝖾 𝖻𝗈𝗋𝖽𝖾𝗋𝗌, 𝖺𝗇𝖽 𝗍𝗁𝖾 𝗅𝗈𝗇𝗀𝖾𝗌𝗍 𝗉𝖺𝗍𝗁 𝗋𝗎𝗇𝗌 𝟥𝟢𝟫,𝟣𝟣𝟧 𝗄𝗆!
#𝖦𝖨𝖲 #𝖱𝗌𝗍𝖺𝗍𝗌 #𝖬𝖺𝗉𝗉𝗂𝗇𝗀 #𝖨𝗇𝖽𝗂𝖺 #𝖧𝗒𝖽𝗋𝗈𝗅𝗈𝗀𝗒

April 26, 2025 at 12:55 PM
𝖥𝗂𝗑𝖾𝖽 𝗍𝗁𝖺𝗍! 🎯
𝖲𝗐𝗂𝗉𝖾 𝗍𝗈 𝗌𝖾𝖾 𝖨𝗇𝖽𝗂𝖺'𝗌 𝗋𝗂𝗏𝖾𝗋𝗌 𝗂𝗇 𝟥𝖣.... 𝖻𝗅𝖾𝗇𝖽𝗂𝗇𝗀 𝖾𝗅𝖾𝗏𝖺𝗍𝗂𝗈𝗇, 𝗍𝗈𝗉𝗈𝗀𝗋𝖺𝗉𝗁𝗒, 𝖺𝗇𝖽 𝗁𝗒𝖽𝗋𝗈𝗅𝗈𝗀𝗒
🔥𝖥𝗎𝗇 𝖿𝖺𝖼𝗍: 𝟤𝟪𝟪𝟢 𝗋𝗂𝗏𝖾𝗋𝗌 𝖼𝗋𝗈𝗌𝗌 𝗍𝗁𝖾 𝖻𝗈𝗋𝖽𝖾𝗋𝗌, 𝖺𝗇𝖽 𝗍𝗁𝖾 𝗅𝗈𝗇𝗀𝖾𝗌𝗍 𝗉𝖺𝗍𝗁 𝗋𝗎𝗇𝗌 𝟥𝟢𝟫,𝟣𝟣𝟧 𝗄𝗆!
#𝖦𝖨𝖲 #𝖱𝗌𝗍𝖺𝗍𝗌 #𝖬𝖺𝗉𝗉𝗂𝗇𝗀 #𝖨𝗇𝖽𝗂𝖺 #𝖧𝗒𝖽𝗋𝗈𝗅𝗈𝗀𝗒
𝖲𝗐𝗂𝗉𝖾 𝗍𝗈 𝗌𝖾𝖾 𝖨𝗇𝖽𝗂𝖺'𝗌 𝗋𝗂𝗏𝖾𝗋𝗌 𝗂𝗇 𝟥𝖣.... 𝖻𝗅𝖾𝗇𝖽𝗂𝗇𝗀 𝖾𝗅𝖾𝗏𝖺𝗍𝗂𝗈𝗇, 𝗍𝗈𝗉𝗈𝗀𝗋𝖺𝗉𝗁𝗒, 𝖺𝗇𝖽 𝗁𝗒𝖽𝗋𝗈𝗅𝗈𝗀𝗒
🔥𝖥𝗎𝗇 𝖿𝖺𝖼𝗍: 𝟤𝟪𝟪𝟢 𝗋𝗂𝗏𝖾𝗋𝗌 𝖼𝗋𝗈𝗌𝗌 𝗍𝗁𝖾 𝖻𝗈𝗋𝖽𝖾𝗋𝗌, 𝖺𝗇𝖽 𝗍𝗁𝖾 𝗅𝗈𝗇𝗀𝖾𝗌𝗍 𝗉𝖺𝗍𝗁 𝗋𝗎𝗇𝗌 𝟥𝟢𝟫,𝟣𝟣𝟧 𝗄𝗆!
#𝖦𝖨𝖲 #𝖱𝗌𝗍𝖺𝗍𝗌 #𝖬𝖺𝗉𝗉𝗂𝗇𝗀 #𝖨𝗇𝖽𝗂𝖺 #𝖧𝗒𝖽𝗋𝗈𝗅𝗈𝗀𝗒
🌀 826 rivers flow into the DRC 🇨🇩
Today’s deep dive? Unveiling a river network so vast it spans all 26 provinces, linking ecosystems, borders, and lives.
From Bas-Uele to Kinshasa 💧✨
#Geospatial #Hydrology #DRC #RStats #WaterMapping
Today’s deep dive? Unveiling a river network so vast it spans all 26 provinces, linking ecosystems, borders, and lives.
From Bas-Uele to Kinshasa 💧✨
#Geospatial #Hydrology #DRC #RStats #WaterMapping

April 25, 2025 at 1:34 PM
🌀 826 rivers flow into the DRC 🇨🇩
Today’s deep dive? Unveiling a river network so vast it spans all 26 provinces, linking ecosystems, borders, and lives.
From Bas-Uele to Kinshasa 💧✨
#Geospatial #Hydrology #DRC #RStats #WaterMapping
Today’s deep dive? Unveiling a river network so vast it spans all 26 provinces, linking ecosystems, borders, and lives.
From Bas-Uele to Kinshasa 💧✨
#Geospatial #Hydrology #DRC #RStats #WaterMapping
🇫🇷 𝗠𝗔𝗣𝗣𝗜𝗡𝗚 𝗛𝗘𝗔𝗧 & 𝗣𝗢𝗣𝗨𝗟𝗔𝗧𝗜𝗢𝗡 🌡️👥
With summer heatwaves intensifying, I overlaid #MODIS LST and #GHSL 2030 population to spot where heat and people collide
#ClimateAction #UrbanResilience #GIS #HeatIslands #Sustainability
With summer heatwaves intensifying, I overlaid #MODIS LST and #GHSL 2030 population to spot where heat and people collide
#ClimateAction #UrbanResilience #GIS #HeatIslands #Sustainability

April 23, 2025 at 5:01 PM
🇫🇷 𝗠𝗔𝗣𝗣𝗜𝗡𝗚 𝗛𝗘𝗔𝗧 & 𝗣𝗢𝗣𝗨𝗟𝗔𝗧𝗜𝗢𝗡 🌡️👥
With summer heatwaves intensifying, I overlaid #MODIS LST and #GHSL 2030 population to spot where heat and people collide
#ClimateAction #UrbanResilience #GIS #HeatIslands #Sustainability
With summer heatwaves intensifying, I overlaid #MODIS LST and #GHSL 2030 population to spot where heat and people collide
#ClimateAction #UrbanResilience #GIS #HeatIslands #Sustainability

𝐂𝐚𝐦𝐛𝐨𝐝𝐢𝐚, 𝐜𝐚𝐧 𝐈 𝐡𝐞𝐚𝐫 𝐲𝐨𝐮 𝐬𝐡𝐨𝐮𝐭 🌿📢 for our forests?!
From 1990 to 2024, we’ve seen a massive shift: green forests turning into scattered patches. The land is changing fast......Time to act, protect, and restore!
#Cambodia #Forests #ClimateAction #TMFChange #ReforestCambodia #Rstats #Asia
From 1990 to 2024, we’ve seen a massive shift: green forests turning into scattered patches. The land is changing fast......Time to act, protect, and restore!
#Cambodia #Forests #ClimateAction #TMFChange #ReforestCambodia #Rstats #Asia


April 21, 2025 at 4:37 PM
𝐂𝐚𝐦𝐛𝐨𝐝𝐢𝐚, 𝐜𝐚𝐧 𝐈 𝐡𝐞𝐚𝐫 𝐲𝐨𝐮 𝐬𝐡𝐨𝐮𝐭 🌿📢 for our forests?!
From 1990 to 2024, we’ve seen a massive shift: green forests turning into scattered patches. The land is changing fast......Time to act, protect, and restore!
#Cambodia #Forests #ClimateAction #TMFChange #ReforestCambodia #Rstats #Asia
From 1990 to 2024, we’ve seen a massive shift: green forests turning into scattered patches. The land is changing fast......Time to act, protect, and restore!
#Cambodia #Forests #ClimateAction #TMFChange #ReforestCambodia #Rstats #Asia
👀 You saw #Brazil & the #Amazon TMF in #3D…
My people in the #DRC said: 𝑾𝒉𝒆𝒓𝒆’𝒔 𝒐𝒖𝒓𝒔? 😏
Well… here it is! 🇨🇩✨
𝐓𝐌𝐅 𝐨𝐟 𝐭𝐡𝐞 𝐃𝐑𝐂 𝐢𝐧 𝐬𝐭𝐮𝐧𝐧𝐢𝐧𝐠 3𝐃! 🌿🌍
A vibrant forest, rich in life & vital for our planet 💧🌳
#TMF #DRC3D #CongoBasin #NatureIn3D #GIS #MappingTMF #Africa #ForestsMatter #ClimateAction #R
My people in the #DRC said: 𝑾𝒉𝒆𝒓𝒆’𝒔 𝒐𝒖𝒓𝒔? 😏
Well… here it is! 🇨🇩✨
𝐓𝐌𝐅 𝐨𝐟 𝐭𝐡𝐞 𝐃𝐑𝐂 𝐢𝐧 𝐬𝐭𝐮𝐧𝐧𝐢𝐧𝐠 3𝐃! 🌿🌍
A vibrant forest, rich in life & vital for our planet 💧🌳
#TMF #DRC3D #CongoBasin #NatureIn3D #GIS #MappingTMF #Africa #ForestsMatter #ClimateAction #R

April 20, 2025 at 9:00 AM
👀 You saw #Brazil & the #Amazon TMF in #3D…
My people in the #DRC said: 𝑾𝒉𝒆𝒓𝒆’𝒔 𝒐𝒖𝒓𝒔? 😏
Well… here it is! 🇨🇩✨
𝐓𝐌𝐅 𝐨𝐟 𝐭𝐡𝐞 𝐃𝐑𝐂 𝐢𝐧 𝐬𝐭𝐮𝐧𝐧𝐢𝐧𝐠 3𝐃! 🌿🌍
A vibrant forest, rich in life & vital for our planet 💧🌳
#TMF #DRC3D #CongoBasin #NatureIn3D #GIS #MappingTMF #Africa #ForestsMatter #ClimateAction #R
My people in the #DRC said: 𝑾𝒉𝒆𝒓𝒆’𝒔 𝒐𝒖𝒓𝒔? 😏
Well… here it is! 🇨🇩✨
𝐓𝐌𝐅 𝐨𝐟 𝐭𝐡𝐞 𝐃𝐑𝐂 𝐢𝐧 𝐬𝐭𝐮𝐧𝐧𝐢𝐧𝐠 3𝐃! 🌿🌍
A vibrant forest, rich in life & vital for our planet 💧🌳
#TMF #DRC3D #CongoBasin #NatureIn3D #GIS #MappingTMF #Africa #ForestsMatter #ClimateAction #R

🟡 Mapping Africa's Aid Inequity: 15 years where global aid fell below average. 🚨
Using R, I visualized this disparity in an animated map. In 2005, Africa got just 4.9% of global aid, less than 1 in 20 dollars.
🌍 Data Source: #WorldBank
#R #DataForDevelopment #AidAllocation #MappingAfrica
Using R, I visualized this disparity in an animated map. In 2005, Africa got just 4.9% of global aid, less than 1 in 20 dollars.
🌍 Data Source: #WorldBank
#R #DataForDevelopment #AidAllocation #MappingAfrica
April 20, 2025 at 1:01 AM
🟡 Mapping Africa's Aid Inequity: 15 years where global aid fell below average. 🚨
Using R, I visualized this disparity in an animated map. In 2005, Africa got just 4.9% of global aid, less than 1 in 20 dollars.
🌍 Data Source: #WorldBank
#R #DataForDevelopment #AidAllocation #MappingAfrica
Using R, I visualized this disparity in an animated map. In 2005, Africa got just 4.9% of global aid, less than 1 in 20 dollars.
🌍 Data Source: #WorldBank
#R #DataForDevelopment #AidAllocation #MappingAfrica
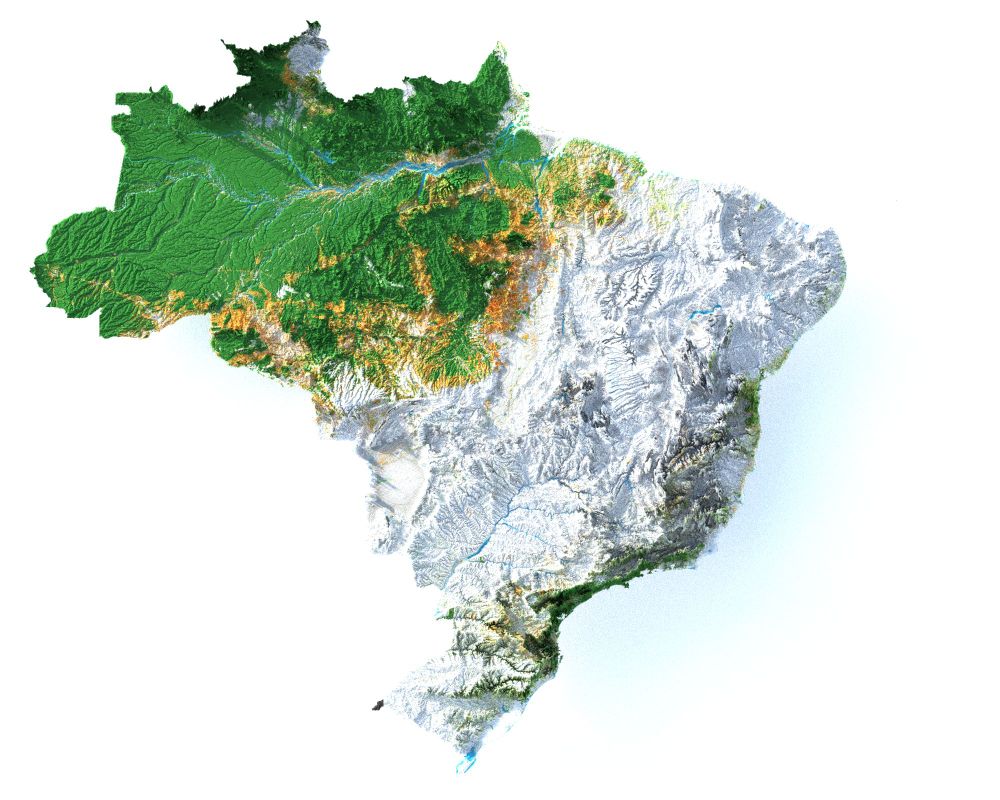
✅ The masterpiece for 🇧🇷 is here 🌱🔥 !
🌳🌎✨ Tropical Moist Forest in full #3D GLORY — 2024 style.
🎨 + 🛰️ + 🌿 = WOW
📢 Let’s hear it, #Brazil! 💚💛
#3D #Brazil #RemoteSensing #GIS #EarthObservation #Rstats #Science
🌳🌎✨ Tropical Moist Forest in full #3D GLORY — 2024 style.
🎨 + 🛰️ + 🌿 = WOW
📢 Let’s hear it, #Brazil! 💚💛
#3D #Brazil #RemoteSensing #GIS #EarthObservation #Rstats #Science
April 19, 2025 at 9:02 PM
✅ The masterpiece for 🇧🇷 is here 🌱🔥 !
🌳🌎✨ Tropical Moist Forest in full #3D GLORY — 2024 style.
🎨 + 🛰️ + 🌿 = WOW
📢 Let’s hear it, #Brazil! 💚💛
#3D #Brazil #RemoteSensing #GIS #EarthObservation #Rstats #Science
🌳🌎✨ Tropical Moist Forest in full #3D GLORY — 2024 style.
🎨 + 🛰️ + 🌿 = WOW
📢 Let’s hear it, #Brazil! 💚💛
#3D #Brazil #RemoteSensing #GIS #EarthObservation #Rstats #Science
✅ I did my part...
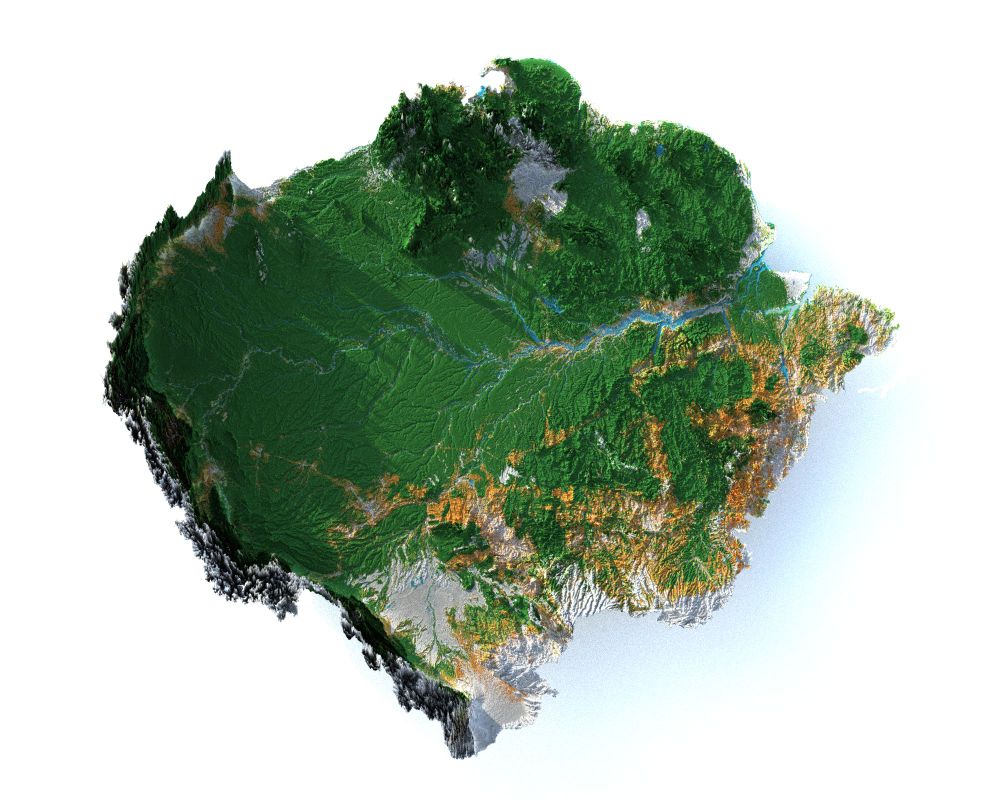
🌳🌍 3D Amazon Rainforest: 2024 Tropical Moist Forest edition!
Elevation, vegetation, human impact: all in one view
📊 Data: forobs.jrc.ec.europa.eu/TMF/data
#3D #Amazon #EarthObservation #GIS #RemoteSensing #Rstats #EOData #SouthAmerica #Brazil #Peru
🌳🌍 3D Amazon Rainforest: 2024 Tropical Moist Forest edition!
Elevation, vegetation, human impact: all in one view
📊 Data: forobs.jrc.ec.europa.eu/TMF/data
#3D #Amazon #EarthObservation #GIS #RemoteSensing #Rstats #EOData #SouthAmerica #Brazil #Peru
April 19, 2025 at 5:32 PM
✅ I did my part...
🌳🌍 3D Amazon Rainforest: 2024 Tropical Moist Forest edition!
Elevation, vegetation, human impact: all in one view
📊 Data: forobs.jrc.ec.europa.eu/TMF/data
#3D #Amazon #EarthObservation #GIS #RemoteSensing #Rstats #EOData #SouthAmerica #Brazil #Peru
🌳🌍 3D Amazon Rainforest: 2024 Tropical Moist Forest edition!
Elevation, vegetation, human impact: all in one view
📊 Data: forobs.jrc.ec.europa.eu/TMF/data
#3D #Amazon #EarthObservation #GIS #RemoteSensing #Rstats #EOData #SouthAmerica #Brazil #Peru
🅣🅗🅔 🅐🅜🅐🅩🅞🅝 🅡🅐🅘🅝🅕🅞🅡🅔🅢🅣: 🅐 🅢🅗🅘🅕🅣 🅕🅡🅞🅜 1990 🅣🅞 2024 🌱📊
From 🟢600 Mha of intact forest to just 🟢500.61 Mha.
🟠 66.67 Mha deforested
🟡 33.59 Mha degraded
💚 9.78 Mha regrowth—too little, too late?
#AmazonRainforest #Geospatial #RStats #ForestConservation #Sustainability #ClimateChange #SpatialData
From 🟢600 Mha of intact forest to just 🟢500.61 Mha.
🟠 66.67 Mha deforested
🟡 33.59 Mha degraded
💚 9.78 Mha regrowth—too little, too late?
#AmazonRainforest #Geospatial #RStats #ForestConservation #Sustainability #ClimateChange #SpatialData


April 18, 2025 at 9:37 PM
🅣🅗🅔 🅐🅜🅐🅩🅞🅝 🅡🅐🅘🅝🅕🅞🅡🅔🅢🅣: 🅐 🅢🅗🅘🅕🅣 🅕🅡🅞🅜 1990 🅣🅞 2024 🌱📊
From 🟢600 Mha of intact forest to just 🟢500.61 Mha.
🟠 66.67 Mha deforested
🟡 33.59 Mha degraded
💚 9.78 Mha regrowth—too little, too late?
#AmazonRainforest #Geospatial #RStats #ForestConservation #Sustainability #ClimateChange #SpatialData
From 🟢600 Mha of intact forest to just 🟢500.61 Mha.
🟠 66.67 Mha deforested
🟡 33.59 Mha degraded
💚 9.78 Mha regrowth—too little, too late?
#AmazonRainforest #Geospatial #RStats #ForestConservation #Sustainability #ClimateChange #SpatialData
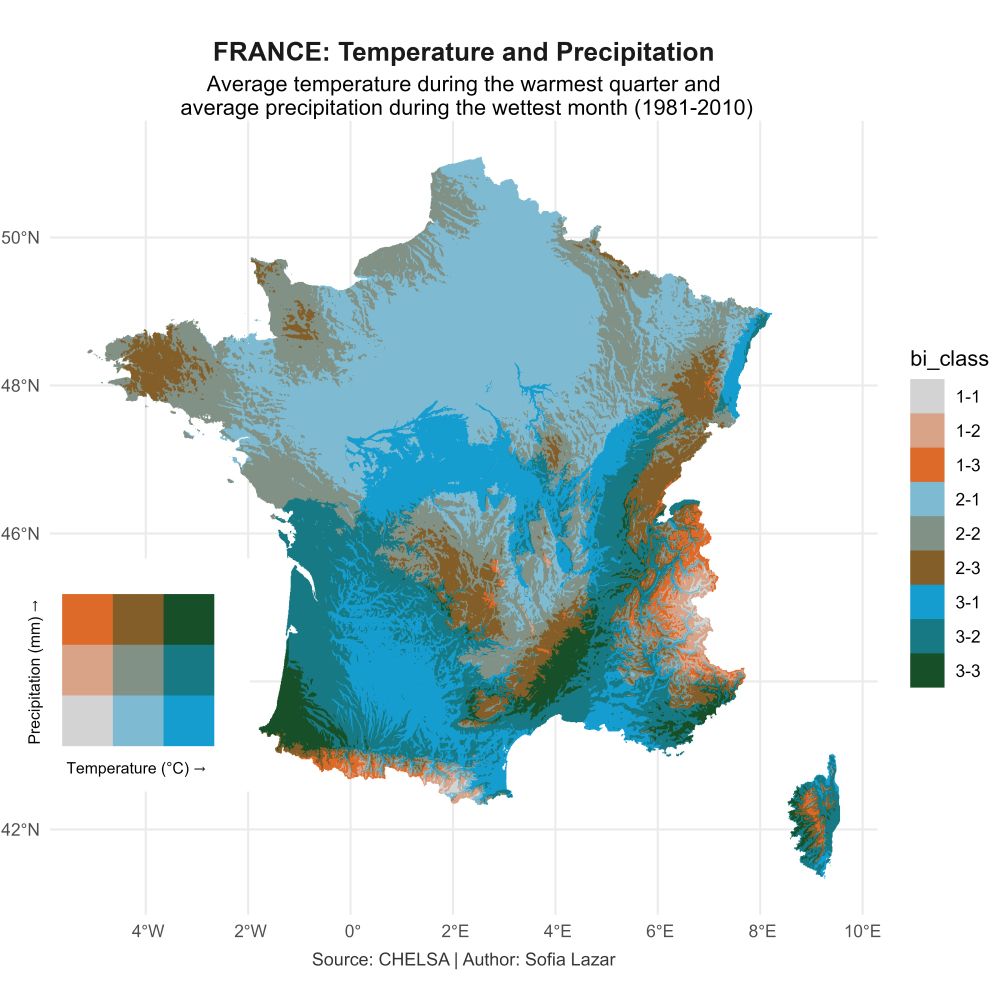
𝐅𝐫𝐚𝐧𝐜𝐞'𝐬 𝐂𝐥𝐢𝐦𝐚𝐭𝐞 🌡️🍃
This bivariate map reveals where temperature meets vegetation across France. Mediterranean regions glow magenta (hot+dry), while northern greens showcase resilient plant life.
#DataViz #ClimateScience #RemoteSensing
This bivariate map reveals where temperature meets vegetation across France. Mediterranean regions glow magenta (hot+dry), while northern greens showcase resilient plant life.
#DataViz #ClimateScience #RemoteSensing

April 16, 2025 at 1:20 PM
𝐅𝐫𝐚𝐧𝐜𝐞'𝐬 𝐂𝐥𝐢𝐦𝐚𝐭𝐞 🌡️🍃
This bivariate map reveals where temperature meets vegetation across France. Mediterranean regions glow magenta (hot+dry), while northern greens showcase resilient plant life.
#DataViz #ClimateScience #RemoteSensing
This bivariate map reveals where temperature meets vegetation across France. Mediterranean regions glow magenta (hot+dry), while northern greens showcase resilient plant life.
#DataViz #ClimateScience #RemoteSensing


🇧🇷 Tropical Moist Forest Crisis in Brazil: Since 1990, Brazil lost 86.86 Mha of undisturbed forests, while regrowth only covered 16.08 Mha. Deforestation escalates by 1,533%, and degradation is climbing. We must act for a sustainable future. 🌍 #Deforestation #ClimateAction #Brazil #Biodiversity
April 16, 2025 at 8:40 AM
🇧🇷 Tropical Moist Forest Crisis in Brazil: Since 1990, Brazil lost 86.86 Mha of undisturbed forests, while regrowth only covered 16.08 Mha. Deforestation escalates by 1,533%, and degradation is climbing. We must act for a sustainable future. 🌍 #Deforestation #ClimateAction #Brazil #Biodiversity
THE CONGO BASIN VANISHING LIFELINE
The DRC's rainforest is disappearing! 🌍 maps from the 2024 #JRC #Tropical #Moist #Forest show a staggering 21.2% loss of intact forest over the past 34 years. From 130.5 Mha in 1990 to just 102.73 Mha in 2024.
#CongoRainforest #Deforestation #ClimateCrisis #JRC
The DRC's rainforest is disappearing! 🌍 maps from the 2024 #JRC #Tropical #Moist #Forest show a staggering 21.2% loss of intact forest over the past 34 years. From 130.5 Mha in 1990 to just 102.73 Mha in 2024.
#CongoRainforest #Deforestation #ClimateCrisis #JRC


April 16, 2025 at 1:22 AM
THE CONGO BASIN VANISHING LIFELINE
The DRC's rainforest is disappearing! 🌍 maps from the 2024 #JRC #Tropical #Moist #Forest show a staggering 21.2% loss of intact forest over the past 34 years. From 130.5 Mha in 1990 to just 102.73 Mha in 2024.
#CongoRainforest #Deforestation #ClimateCrisis #JRC
The DRC's rainforest is disappearing! 🌍 maps from the 2024 #JRC #Tropical #Moist #Forest show a staggering 21.2% loss of intact forest over the past 34 years. From 130.5 Mha in 1990 to just 102.73 Mha in 2024.
#CongoRainforest #Deforestation #ClimateCrisis #JRC
Saudi Arabia 🇸🇦 | Climate Reality in Color
Average Site Water Balance (swb) & Climate Moisture Index (cmi)
📆 1981–2010 | CHELSA BIOCLIM+
From the green slopes of جبال السروات to the dry heart of الربع
الخالي
#ClimateScience #SaudiArabia #GIS #Hydrology #المناخ #البيئة
Average Site Water Balance (swb) & Climate Moisture Index (cmi)
📆 1981–2010 | CHELSA BIOCLIM+
From the green slopes of جبال السروات to the dry heart of الربع
الخالي
#ClimateScience #SaudiArabia #GIS #Hydrology #المناخ #البيئة

April 14, 2025 at 7:13 AM
Saudi Arabia 🇸🇦 | Climate Reality in Color
Average Site Water Balance (swb) & Climate Moisture Index (cmi)
📆 1981–2010 | CHELSA BIOCLIM+
From the green slopes of جبال السروات to the dry heart of الربع
الخالي
#ClimateScience #SaudiArabia #GIS #Hydrology #المناخ #البيئة
Average Site Water Balance (swb) & Climate Moisture Index (cmi)
📆 1981–2010 | CHELSA BIOCLIM+
From the green slopes of جبال السروات to the dry heart of الربع
الخالي
#ClimateScience #SaudiArabia #GIS #Hydrology #المناخ #البيئة
🟡 🅒🅛🅘🅜🅐🅣🅔 🅟🅡🅞🅙🅔🅒🅣🅘🅞🅝
A side-by-side of 🇫🇷 #France and 🇮🇹 #Italy showing projected climate shifts under #SSP1-2.6 (mitigation) vs #SSP5-8.5 (high emissions).
Data from the #MPI-ESM1 model
Access the #BIOCLIM+ dataset:
🔗 chelsa-climate.org/exchelsa-ext...
#ClimateData #RStats #BIOCLIM+ #CHELSA
A side-by-side of 🇫🇷 #France and 🇮🇹 #Italy showing projected climate shifts under #SSP1-2.6 (mitigation) vs #SSP5-8.5 (high emissions).
Data from the #MPI-ESM1 model
Access the #BIOCLIM+ dataset:
🔗 chelsa-climate.org/exchelsa-ext...
#ClimateData #RStats #BIOCLIM+ #CHELSA


April 14, 2025 at 12:30 AM
Are quieter regions left behind or do they simply function differently?
#France #population #urbanplanning #Rstats
#France #population #urbanplanning #Rstats

April 9, 2025 at 12:26 AM
Are quieter regions left behind or do they simply function differently?
#France #population #urbanplanning #Rstats
#France #population #urbanplanning #Rstats
🗺️ Hot or not? 🇸🇦
New #climateERA5 vs #climateCHELSA bivariate maps reveal striking differences in temp & rainfall across #climateSaudiArabia (1981–2010)!
🌡️#climateERA5: Hotter, drier deserts
🌧️#climateCHELSA: Cooler, wetter, more detailed
📊 Your dataset really matters in #climateMapping #R #2Dmaps
New #climateERA5 vs #climateCHELSA bivariate maps reveal striking differences in temp & rainfall across #climateSaudiArabia (1981–2010)!
🌡️#climateERA5: Hotter, drier deserts
🌧️#climateCHELSA: Cooler, wetter, more detailed
📊 Your dataset really matters in #climateMapping #R #2Dmaps


April 7, 2025 at 8:57 PM
🗺️ Hot or not? 🇸🇦
New #climateERA5 vs #climateCHELSA bivariate maps reveal striking differences in temp & rainfall across #climateSaudiArabia (1981–2010)!
🌡️#climateERA5: Hotter, drier deserts
🌧️#climateCHELSA: Cooler, wetter, more detailed
📊 Your dataset really matters in #climateMapping #R #2Dmaps
New #climateERA5 vs #climateCHELSA bivariate maps reveal striking differences in temp & rainfall across #climateSaudiArabia (1981–2010)!
🌡️#climateERA5: Hotter, drier deserts
🌧️#climateCHELSA: Cooler, wetter, more detailed
📊 Your dataset really matters in #climateMapping #R #2Dmaps
Ohh silly me! 🤦♀️ How did I miss that?! 🙃... Classic map betrayal! Here is the wright map

April 7, 2025 at 4:38 PM
Ohh silly me! 🤦♀️ How did I miss that?! 🙃... Classic map betrayal! Here is the wright map
📢 To #Farmers, #Ecologists, #Policymakers & #Agribusiness:
New #CHELSA climate data is in! 🇺🇸
🌡️ Hot & Dry (1-3): Drought risk
🌧️ Cool & Wet (3-1): Great for 🍓
🌾 Moderate (2-2): Corn/soybean belt
🌴 Hot & Wet (3-3): High disease risk
🗺️ Zoom into your state for details!
#Climate #USA #GIS #Rstats
New #CHELSA climate data is in! 🇺🇸
🌡️ Hot & Dry (1-3): Drought risk
🌧️ Cool & Wet (3-1): Great for 🍓
🌾 Moderate (2-2): Corn/soybean belt
🌴 Hot & Wet (3-3): High disease risk
🗺️ Zoom into your state for details!
#Climate #USA #GIS #Rstats

April 7, 2025 at 3:25 PM
📢 To #Farmers, #Ecologists, #Policymakers & #Agribusiness:
New #CHELSA climate data is in! 🇺🇸
🌡️ Hot & Dry (1-3): Drought risk
🌧️ Cool & Wet (3-1): Great for 🍓
🌾 Moderate (2-2): Corn/soybean belt
🌴 Hot & Wet (3-3): High disease risk
🗺️ Zoom into your state for details!
#Climate #USA #GIS #Rstats
New #CHELSA climate data is in! 🇺🇸
🌡️ Hot & Dry (1-3): Drought risk
🌧️ Cool & Wet (3-1): Great for 🍓
🌾 Moderate (2-2): Corn/soybean belt
🌴 Hot & Wet (3-3): High disease risk
🗺️ Zoom into your state for details!
#Climate #USA #GIS #Rstats
🇫🇷 France’s Climate Risks at a Glance 🔴⚪🔵
Using high-res #CHELSA climate data, I mapped the alarming trends:
🌡️ Temps rising 2× faster than global average
🌧️ Rainfall dropping, crops & soil at risk
Big thanks to @milos-makes-maps.bsky.social tut!
#ClimateEmergency #France #Sustainability #Rstats
Using high-res #CHELSA climate data, I mapped the alarming trends:
🌡️ Temps rising 2× faster than global average
🌧️ Rainfall dropping, crops & soil at risk
Big thanks to @milos-makes-maps.bsky.social tut!
#ClimateEmergency #France #Sustainability #Rstats


April 7, 2025 at 10:46 AM
🇫🇷 France’s Climate Risks at a Glance 🔴⚪🔵
Using high-res #CHELSA climate data, I mapped the alarming trends:
🌡️ Temps rising 2× faster than global average
🌧️ Rainfall dropping, crops & soil at risk
Big thanks to @milos-makes-maps.bsky.social tut!
#ClimateEmergency #France #Sustainability #Rstats
Using high-res #CHELSA climate data, I mapped the alarming trends:
🌡️ Temps rising 2× faster than global average
🌧️ Rainfall dropping, crops & soil at risk
Big thanks to @milos-makes-maps.bsky.social tut!
#ClimateEmergency #France #Sustainability #Rstats

