Sören Greule
@soereng.bsky.social
Reposted by Sören Greule

{ggview} can print plots to Viewer (Rstudio or Positron) with true scaling. Adjust plot settings and see the final proportions immediately.
Save the plot once 👌
e.g.:
ggplot(...) +
ggview::canvas(width = 220, height = 220*2/3, units = "mm", dpi = 300)
per @nrennie.bsky.social #datavis #rstats
Save the plot once 👌
e.g.:
ggplot(...) +
ggview::canvas(width = 220, height = 220*2/3, units = "mm", dpi = 300)
per @nrennie.bsky.social #datavis #rstats
December 16, 2025 at 10:53 PM
{ggview} can print plots to Viewer (Rstudio or Positron) with true scaling. Adjust plot settings and see the final proportions immediately.
Save the plot once 👌
e.g.:
ggplot(...) +
ggview::canvas(width = 220, height = 220*2/3, units = "mm", dpi = 300)
per @nrennie.bsky.social #datavis #rstats
Save the plot once 👌
e.g.:
ggplot(...) +
ggview::canvas(width = 220, height = 220*2/3, units = "mm", dpi = 300)
per @nrennie.bsky.social #datavis #rstats
Reposted by Sören Greule

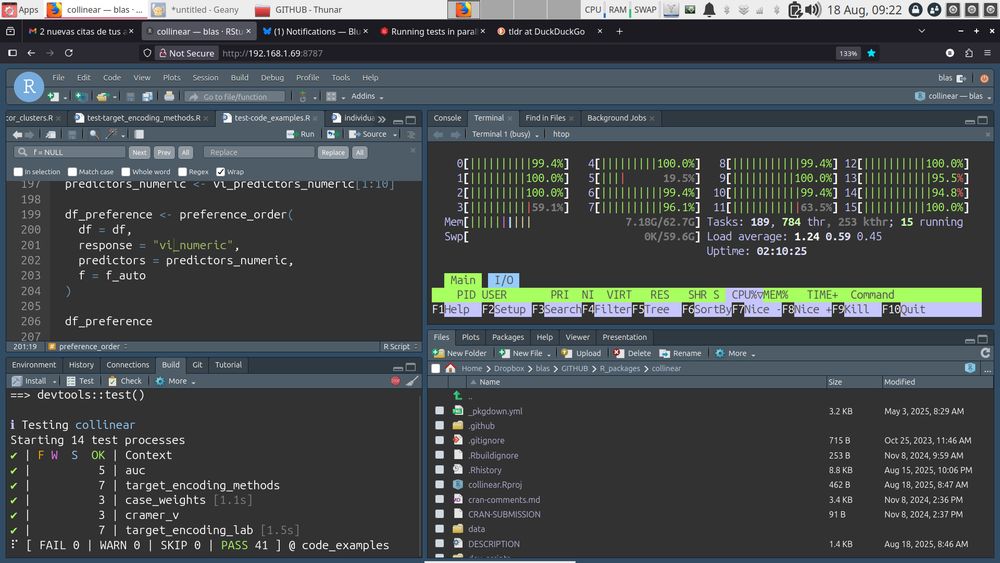
In case you didn't know:
You can run your package unit tests with {testthat} in parallel with two simple steps (see testthat.r-lib.org/articles/par...):
tldr:
1. Add `Config/testthat/parallel: true` to DESCRIPTION.
2. Add `TESTTHAT_CPUS=8` to your .Renviron and restart R.
#rstats
You can run your package unit tests with {testthat} in parallel with two simple steps (see testthat.r-lib.org/articles/par...):
tldr:
1. Add `Config/testthat/parallel: true` to DESCRIPTION.
2. Add `TESTTHAT_CPUS=8` to your .Renviron and restart R.
#rstats
August 18, 2025 at 7:24 AM
In case you didn't know:
You can run your package unit tests with {testthat} in parallel with two simple steps (see testthat.r-lib.org/articles/par...):
tldr:
1. Add `Config/testthat/parallel: true` to DESCRIPTION.
2. Add `TESTTHAT_CPUS=8` to your .Renviron and restart R.
#rstats
You can run your package unit tests with {testthat} in parallel with two simple steps (see testthat.r-lib.org/articles/par...):
tldr:
1. Add `Config/testthat/parallel: true` to DESCRIPTION.
2. Add `TESTTHAT_CPUS=8` to your .Renviron and restart R.
#rstats
Reposted by Sören Greule

Unpopular opinion but the dplyr update where it started to flag if you have multiple to multiple and matches in your join and we all rioted has saved all of us from incorrect reports and few of us knew exactly what a left join was doing.
#rstats
#rstats
June 30, 2025 at 5:45 PM
Unpopular opinion but the dplyr update where it started to flag if you have multiple to multiple and matches in your join and we all rioted has saved all of us from incorrect reports and few of us knew exactly what a left join was doing.
#rstats
#rstats
Reposted by Sören Greule

Small multiples can save even the most complicated chart. And the best thing is, you can use this technique for almost any type of chart. A scatter plot, for example!
medium.com/p/3aa0b039410
(Post 4 out of 4 while I'm on holiday, sharing some highlights from previous years)
medium.com/p/3aa0b039410
(Post 4 out of 4 while I'm on holiday, sharing some highlights from previous years)

April 17, 2025 at 7:51 AM
Small multiples can save even the most complicated chart. And the best thing is, you can use this technique for almost any type of chart. A scatter plot, for example!
medium.com/p/3aa0b039410
(Post 4 out of 4 while I'm on holiday, sharing some highlights from previous years)
medium.com/p/3aa0b039410
(Post 4 out of 4 while I'm on holiday, sharing some highlights from previous years)
Reposted by Sören Greule

library(legendry)
histogram_guide <- compose_sandwich(
middle = gizmo_histogram(just = 0),
text = "axis_base",
position = "bottom"
)
nc <- sf::st_read(system.file("shape/nc.shp", package = "sf"), quiet = TRUE)
ggplot(nc) +
geom_sf(aes(fill = AREA)) +
guides(fill = histogram_guide)
histogram_guide <- compose_sandwich(
middle = gizmo_histogram(just = 0),
text = "axis_base",
position = "bottom"
)
nc <- sf::st_read(system.file("shape/nc.shp", package = "sf"), quiet = TRUE)
ggplot(nc) +
geom_sf(aes(fill = AREA)) +
guides(fill = histogram_guide)

February 18, 2025 at 5:44 PM
library(legendry)
histogram_guide <- compose_sandwich(
middle = gizmo_histogram(just = 0),
text = "axis_base",
position = "bottom"
)
nc <- sf::st_read(system.file("shape/nc.shp", package = "sf"), quiet = TRUE)
ggplot(nc) +
geom_sf(aes(fill = AREA)) +
guides(fill = histogram_guide)
histogram_guide <- compose_sandwich(
middle = gizmo_histogram(just = 0),
text = "axis_base",
position = "bottom"
)
nc <- sf::st_read(system.file("shape/nc.shp", package = "sf"), quiet = TRUE)
ggplot(nc) +
geom_sf(aes(fill = AREA)) +
guides(fill = histogram_guide)
Reposted by Sören Greule

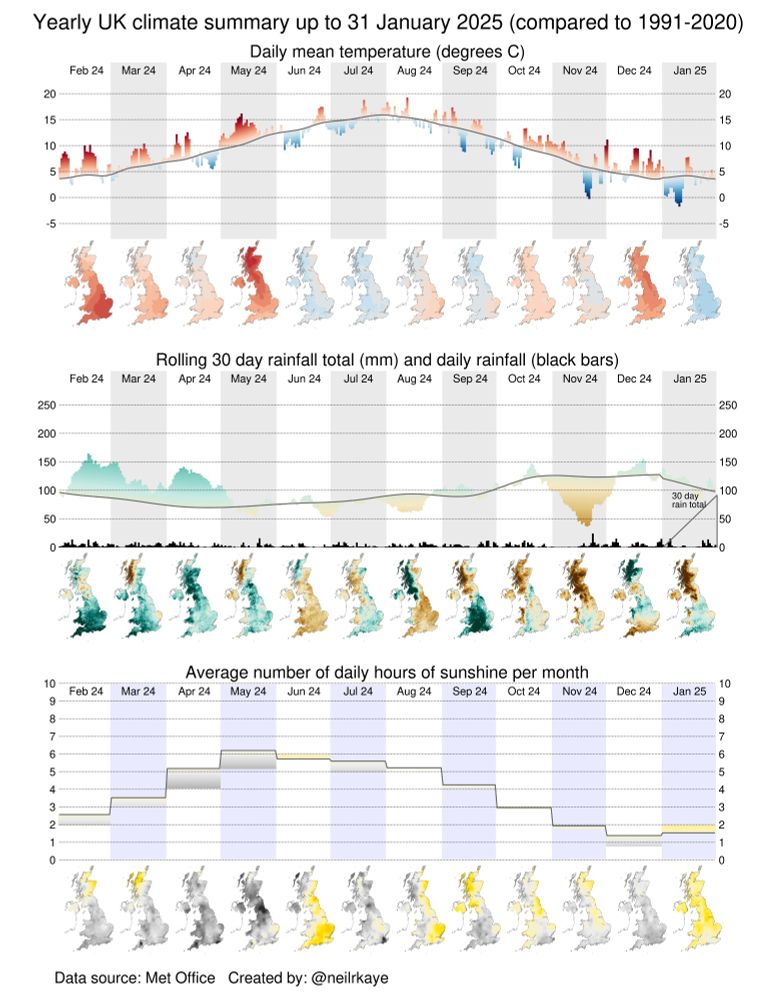
Here in the UK January was colder than average, it was dry in Scotland and Northern Ireland but wetter in England, it was generally sunnier than average. Here is a #dataviz summarising the weather/climate for the last year.
February 4, 2025 at 9:16 AM
Here in the UK January was colder than average, it was dry in Scotland and Northern Ireland but wetter in England, it was generally sunnier than average. Here is a #dataviz summarising the weather/climate for the last year.